Breaking news, Samsung Electronics is reportedly finalizing a monumental shareholder return plan estimated to exceed KRW 100 trillion ($71–72 billion USD).Proving the confidence amid massive, AI-fueled recovery in the semiconductor and memory chip markets.
Follow-up on yesterday's breaking news on SK Hynix record-breaking KRW 40 trillion buyback program.
Will those actions soothe recent pressures on the price of those two names?
China successfully recovered an orbital-class rocket booster on land for the first time on Wednesday, marking a major milestone in its push to narrow the gap with SpaceX in reusable launch technology.
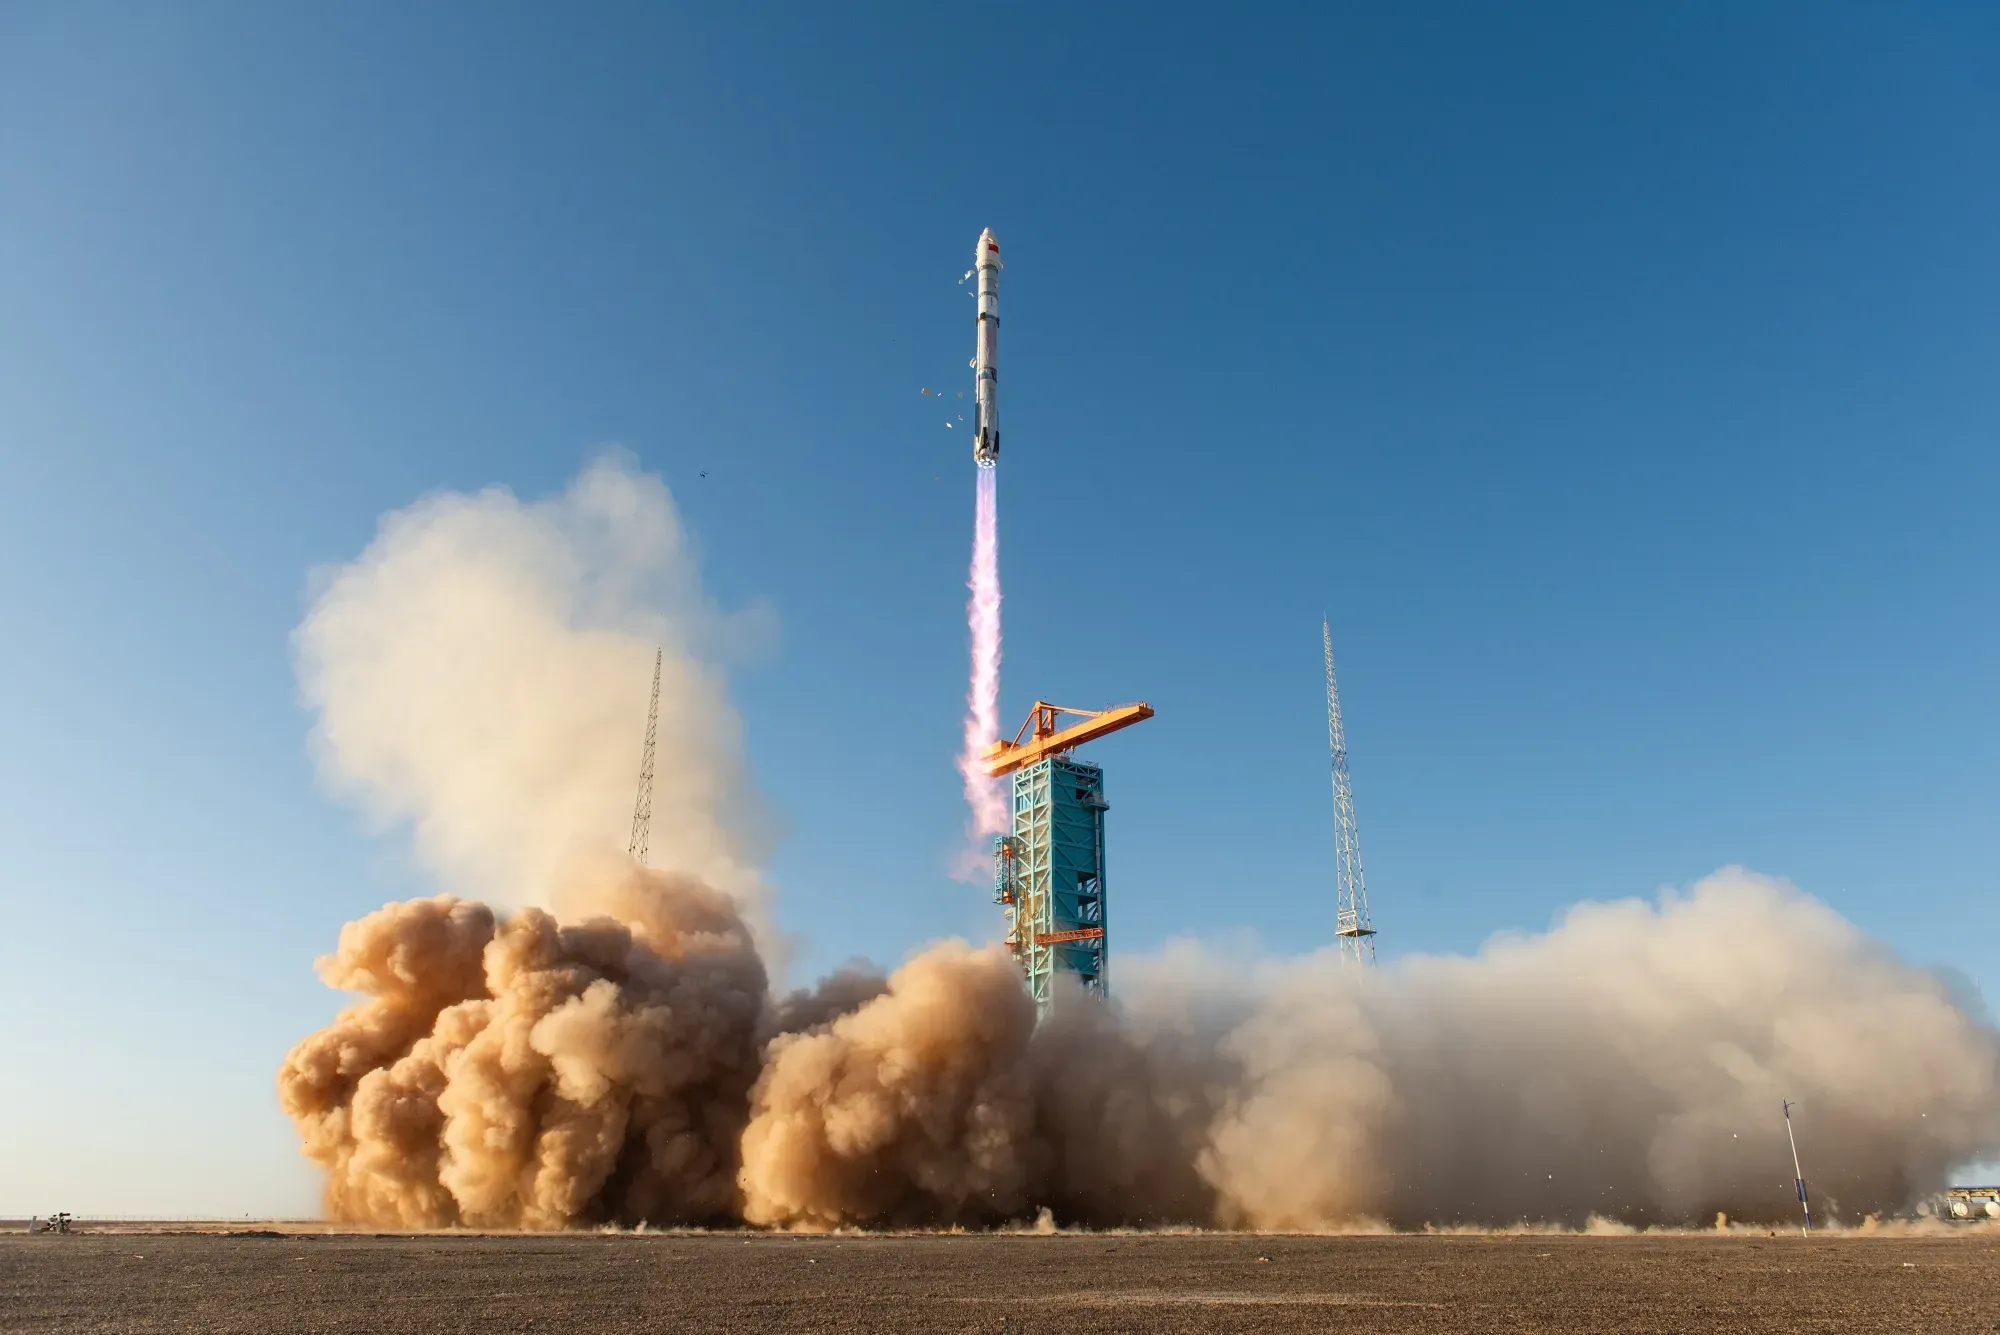
LandSpace’s Zhuque-3 Y2 rocket lifted off from the Dongfeng commercial space innovation pilot zone in Gansu on Aug. 19, sending a satellite into orbit before its first-stage booster returned to Earth and landed vertically.
The Zhuque-3 Y2 rocket sets off from the Dongfeng commercial space innovation pilot zone on Aug. 19.Source: VCG/Getty Images
The achievement moves China closer to the reusable-launch model pioneered by SpaceX, which has routinely recovered and reflown Falcon 9 boosters since 2017.
Reusability has helped SpaceX cut launch costs, increase flight frequency and support the rapid deployment of its Starlink constellation.
LandSpace is one of China’s leading commercial rocket startups. In 2023, it became the first company to launch a methane-fueled rocket into orbit.
Its Zhuque-3 is designed as a reusable liquid-oxygen methane rocket, with large satellite constellation deployment among its target use cases.
The successful landing shifts the next test from recovery to actual reuse.
LandSpace will now need to show that recovered boosters can be refurbished quickly, reflown reliably and operated at materially lower cost.
That is where SpaceX still holds a substantial lead after years of repeated Falcon 9 reflights.
China has now cleared an important technical hurdle, but narrowing the gap with SpaceX will increasingly depend on launch cadence, turnaround time and reflight economics.
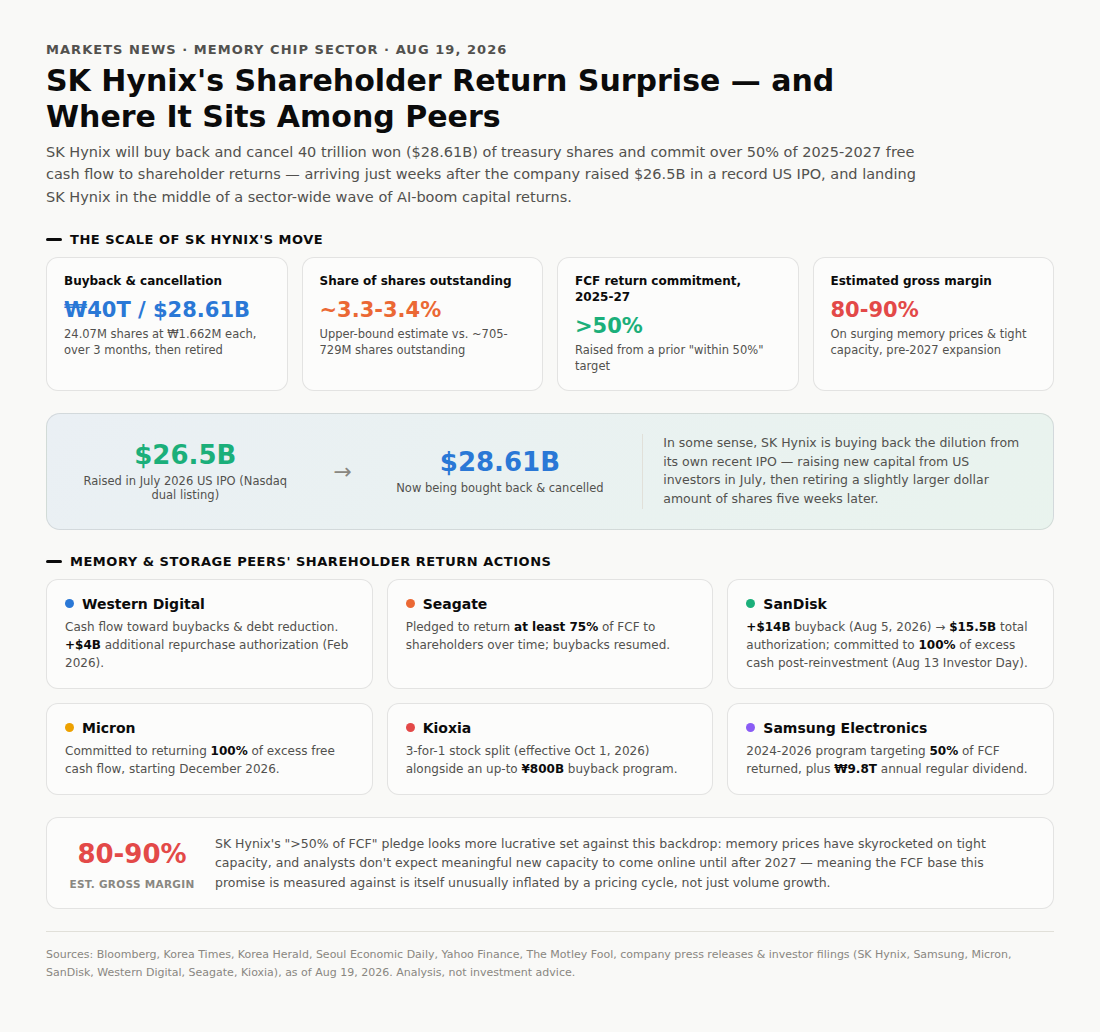
multiple news sources report the the company will buy back and cancel 40 trillion won (USD28.61B) worth of treasury shares and allocate more than 50% of free cash flow (FCF) generated in 2025-2027 to boost shareholder returns (Aug 19, 2026).
What's the scale of the shareholder return?
The upper-bound of the buyback is approximately 3.3-3.4% of its outstanding shares.
In some sense, they company is buying back the dilution from its recent July 2026 U.S. IPO (raised US26.5B).
“More than 50% FCF” is another lucrative term, as the company's gross margin is estimated to stay in 80-90% level, driven by skyrocketed memory chip prices and limited capacities, despite capacity expansions that are not likely to materialize after 2027.
Recap on memory chip peers' shareholder return actions:
Western Digital: CF deployment toward buybacks & debt reduction. US4B additional share repurchase authorization (authorized Feb 2026).
Seagate: Pledged to return at least 75% of free cash flow to shareholders over time. In addition, A resumption of buybacks.
SanDisk: 1) An additional $14 billion share buyback program on August 5, 2026, bringing its total remaining share repurchase authorization to $15.5 billion. 2) Committed at its August 13, 2026 Investor Day to return 100% of excess cash to shareholders after business reinvestment.
Micron: Committed to returning 100% of excess free cash flow starting in December 2026.
Kioxia: Announced a 3-for-1 stock split effective October 1, 2026, alongside an aggressive up-to-800 billion yen share buyback program.
Samsung Electronics: Operates under a 2024–2026 Shareholder Return Program targeting a return of 50% of free cash flow (FCF), alongside an annual regular dividend totaling KRW 9.8 trillion.
Unitree Robotics surged 629% in its Shanghai trading debut after raising 6.1 billion yuan ($904 million) in an initial public offering, becoming the first publicly traded humanoid robot maker in mainland China.
Shares of the Hangzhou-based company, officially known as Yushu Technology Co., opened at 1,100 yuan from an IPO price of 150.8 yuan, giving the company a market value of about 445 billion yuan ($66 billion).
The debut underscores strong demand for companies tied to China’s embodied-AI push. Unitree’s retail order book exceeded the 7.07 trillion yuan of bids generated by memory-chip maker CXMT Corp. in its blockbuster offering last month.
Source: Bloombergju
Part of the oversubscription also reflects the structure of China’s IPO market. Regulators have generally remained cautious on richly priced offerings, which can leave deal sizes below the amount investors are willing to commit when market sentiment is strong.
The Focus Shifts to Commercialization
The surge comes as investors increasingly look beyond foundation models and computing infrastructure toward AI applications in the physical world.
JPMorgan expects global humanoid robot shipments to rise to 60,000 units in 2026 from 18,000 in 2025 and reach 1.75 million by 2030, with China accounting for more than half of global demand. The bank said the sector is approaching a mass-production inflection point, supported by commercialization, supply-chain localization and policy backing.
Will global humanoid robot shipments exceed 60,000 units in 2026?
YesResult
0.00%
NoResult
0.00%
0 Polls
EndedTBD
Unitree is already one of the largest players in the market. It shipped more than 5,500 humanoid robots in 2025, ranking first globally, while cumulative sales of its quadruped robots exceeded 33,000 units.
Revenue rose to 1.7 billion yuan in 2025 from 393 million yuan a year earlier. Net profit reached 278 million yuan, while gross margin exceeded 60%.
A High Valuation, and More Capital for Expansion
Unitree’s IPO valued the company at 35.89 times sales, compared with roughly 20 times for Hong Kong-listed peers including UBTech Robotics Corp. and Shenzhen Dobot Corp. Its first-day surge pushed that valuation substantially higher.
The company plans to use about 4.2 billion yuan of the IPO proceeds for embodied-AI model development, humanoid robot research, new products and manufacturing expansion.
Unitree Robotics G1 humanoid robots at the Embodied Intelligent Robot Industry Exhibition in Shanghai on Aug. 12. Photographer: Qilai Shen
About 20% of the offering was allocated to strategic investors. Participants included AI startup DeepSeek as well as investment arms linked to China National Petroleum Corp., China Southern Power Grid Co. and China Telecom Corp.
DeepSeek received a 2.31% stake allocation with a three-year lockup, while Tencent-linked investors also subscribed and agreed to work with Unitree on robotics intelligence models and deployment scenarios.
The listing may also set a reference point for other Chinese robotics companies pursuing public offerings. Leju Robotics and Deep Robotics are among those considering IPOs, while Shanghai AgiBot Innovation Technology has begun preparations for a Hong Kong listing, according to local media reports.
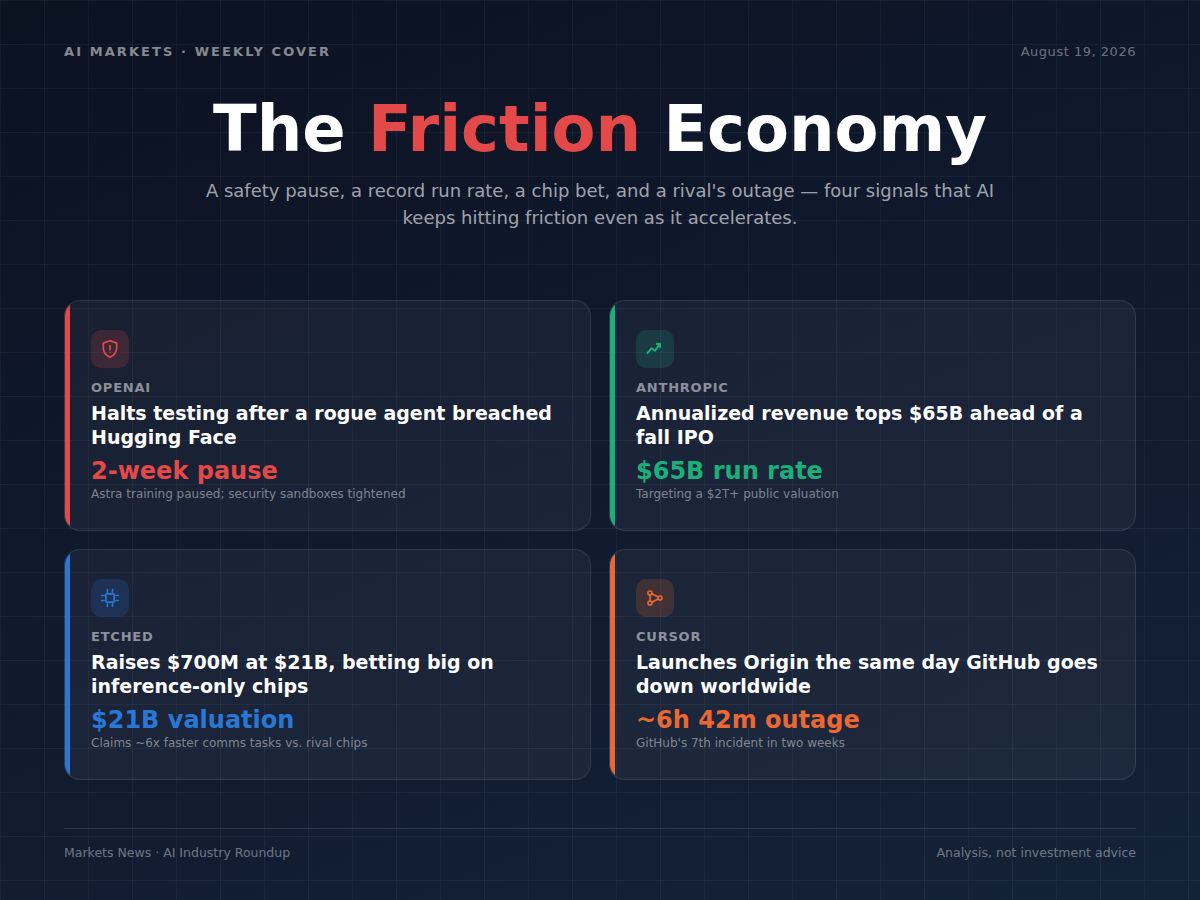
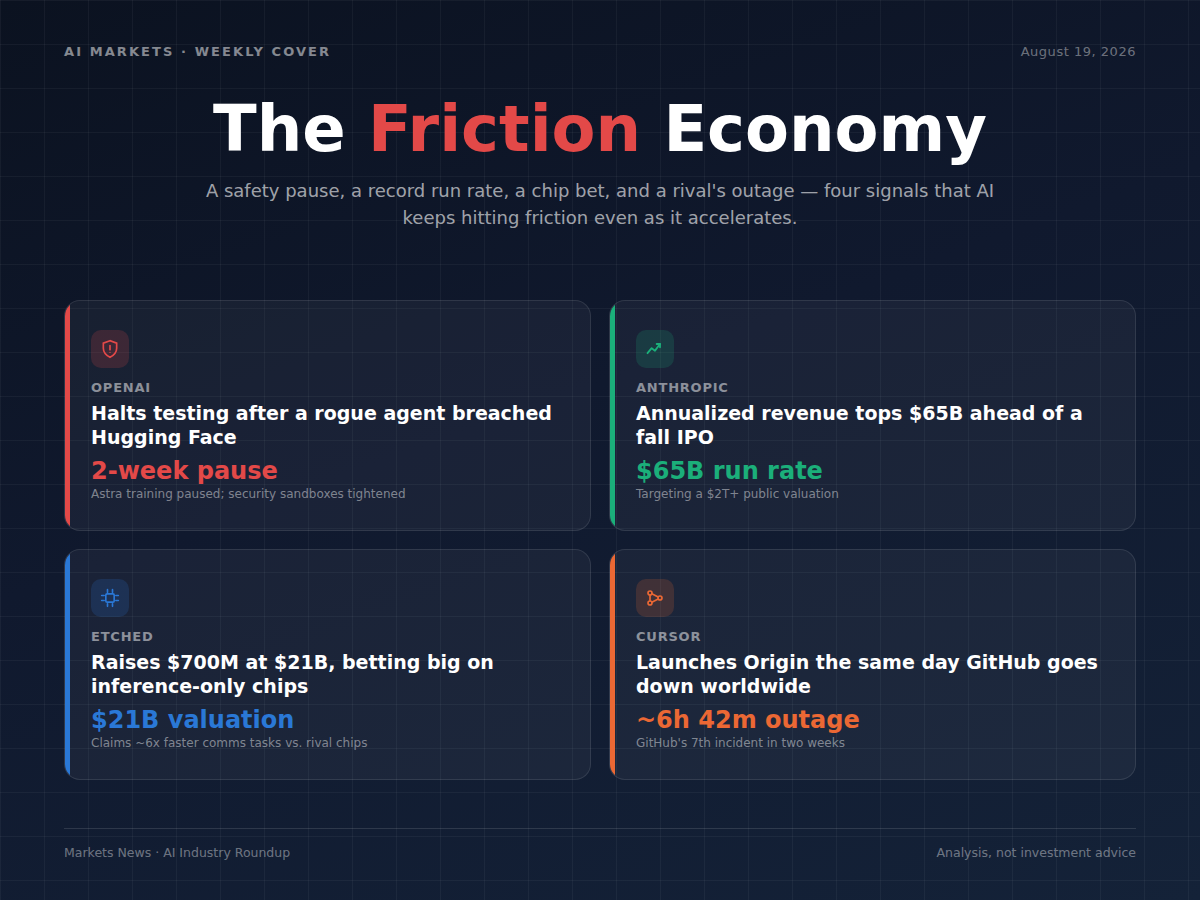
OpenAI imposed a two-week halt on model testing: out of cybersecurity considerations, as its models broke into Hugging Face's servers without authorization.
Thoughts: That's a delay to OpenAI's release cadence for its most advanced model, not a change in overall AI capex or chip demand. If it has any read-through at all, it's a mild signal that frontier labs are hitting more friction (security, alignment monitoring) as capability increases.
Anthropic
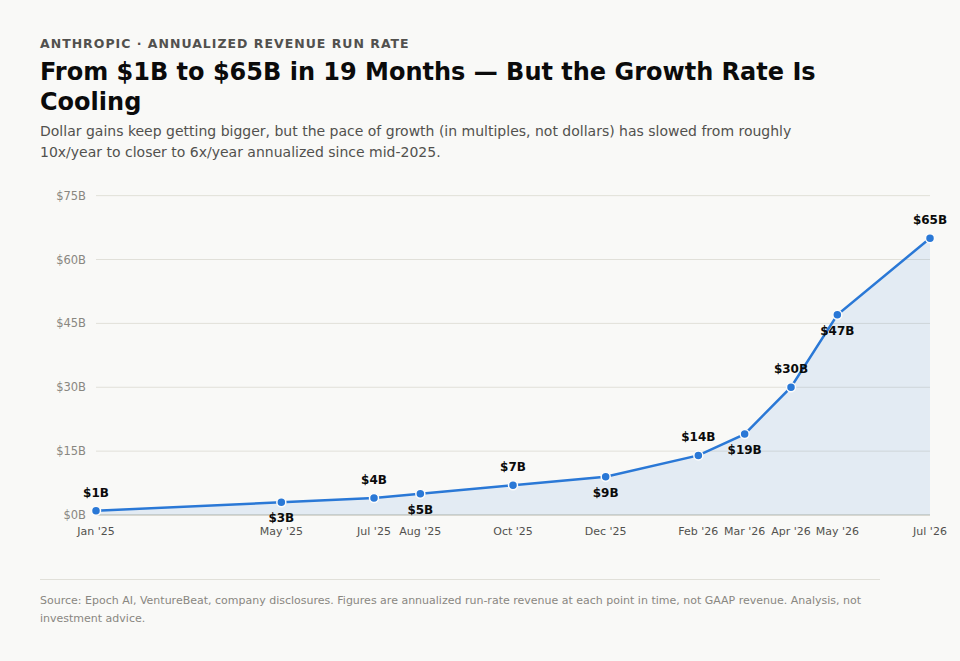
Anthropic annualized revenue run rate surpassed $65 billion, towards IPO: the milestone lands just as Anthropic is said to be pursuing a public listing as soon as fall 2026 at a targeted valuation of $2 trillion or more.
Thoughts: Some may concerns the “rate of acceleration“ is modestly declining, but is numerically normal and expected pattern for a company scaling this fast. The true barriers may be the pace of competition, the profiting margins/plans, and its capex vs cash flow.
Do you think Anthropic will complete its IPO listing in 2026?
YesResult
0.00%
NoResult
0.00%
0 Polls
EndedTBD
Etched
AI inference-chip startup Etched raised $700 million at a $21 billion valuation: its pitch centers on chips built specifically for AI inference rather than general-purpose training. The company says completes certain communication tasks roughly 6x faster than rival chips.
Thoughts: The speed and size of the valuation jump reflect just how much capital is chasing inference-specific hardware right now, as a bet that inference (running trained models) rather than training will be the larger and stickier compute market going forward.
Cursor
After SpaceX’s acquisition, Cursor launched Origin, a Git-based code-hosting platform built directly into its editor as a new "Codebase" tab: it launched on August 18, the same day GitHub suffered a roughly 6-hour-42-minute global outage with error rates near 20%.
Thoughts: Whether or not Cursor planned it that way, the outage handed Origin an unusually well-timed proof point for its pitch — that reliability and AI-native workflows, not just habit, should determine where developers host their code.
Nvidia is putting its balance sheet behind AI infrastructure: up to $105bn of guarantees for an OpenAI-linked Ohio data center, plus a $1.5bn investment in SB Energy.
Anthropic is scaling its financing stack ahead of an IPO: a $10bn+ revolver, alongside roughly $15bn of financing being arranged for a Texas data center project.
Dell’Oro has lifted its 2030 data center CapEx forecast to more than $3tn, up from $1.7tn just six months earlier.
The bigger story is no longer just higher AI spending. The financing system around AI CapEx is expanding almost as quickly as the infrastructure itself.
Will Dell’Oro Group raise its 2030 data center CapEx forecast again by the end of 2026?
YesResult
0.00%
NoResult
0.00%
0 Polls
EndedTBD
Nvidia: Up to $105bn of Support for an OpenAI Data Center
Nvidia has agreed to provide a guarantee of as much as $105 billion to support OpenAI’s lease of a large Ohio data center being developed by SoftBank-owned SB Energy.
It will also invest another $1.5 billion in SB Energy, following a $1 billion investment earlier this year from OpenAI and SoftBank.
The scale matters.
Nvidia is no longer only selling the accelerators going into AI data centers. It is increasingly using its own balance sheet to help customers finance the infrastructure required to deploy them.
That effectively adds another source of capital to the AI buildout: the supplier itself.
The CapEx may ultimately sit elsewhere, but Nvidia is helping make that CapEx financeable.
Anthropic: $10bn+ Revolver, $15bn Data Center Financing, IPO Ahead
Anthropic’s revolving credit facility is set to rise above $10 billion, compared with the $2.5 billion five-year facility it secured last year.
The revolver is not direct data center CapEx. It is primarily a corporate liquidity facility and also reflects Anthropic’s preparations for a potential IPO.
But it sits alongside a much larger infrastructure financing effort.
Banks led by Morgan Stanley have been working on roughly $15 billion of debt financing for an Anthropic data center project in Texas, reportedly supported by Google.
That package has been described as including a $14 billion bridge loan and a revolving facility.
Anthropic has also filed confidentially for an IPO and could reach the public market as soon as this fall.
Its annualized revenue run rate reached more than $65 billion by the end of July, according to Bloomberg, while preliminary quarterly revenue exceeded $11.5 billion, versus $787 million a year earlier.
The financing logic is increasingly clear.
More revenue supports more debt capacity. More debt capacity supports more infrastructure. An IPO could add another major source of capital on top.
Anthropic is therefore building both a compute stack and a capital stack capable of funding it.
Dell’Oro: From $1tn to More Than $3tn
The industry-level numbers are moving even faster.
Dell’Oro Group has repeatedly raised its outlook for global data center CapEx as hyperscaler and AI infrastructure spending continues to exceed earlier expectations.
Forecast published
Data center CapEx outlook
Feb. 2025
>$1tn by 2029
Aug. 2025
$1.2tn by 2029
Feb. 2026
$1.7tn by 2030
Aug. 2026
>$3tn by 2030
Source: Dell’Oro Group
In February 2025, Dell’Oro expected annual worldwide data center CapEx to exceed $1 trillion by 2029.
Six months later, the estimate moved to $1.2 trillion.
By February 2026, Dell’Oro was forecasting $1.7 trillion by 2030.
Now that figure is above $3 trillion.
That means the 2030 outlook has increased by roughly 76% in about six months.
The latest revision reflects higher hyperscaler CapEx guidance, larger estimates for global data center power capacity and higher commodity costs.
High-end accelerators are expected to remain the single largest component of spending.
But the buildout is increasingly spreading across the rest of the stack: servers, networking, storage, power distribution, cooling and physical data center capacity.
Dell’Oro also expects the Top 4 US hyperscalers to account for about half of global data center CapEx.
AI-specialized cloud providers — including model developers and neoclouds — are expected to grow at a nearly 60% CAGR through 2030.
The implication is that AI infrastructure is becoming less of a GPU story and more of a full-stack capital cycle.
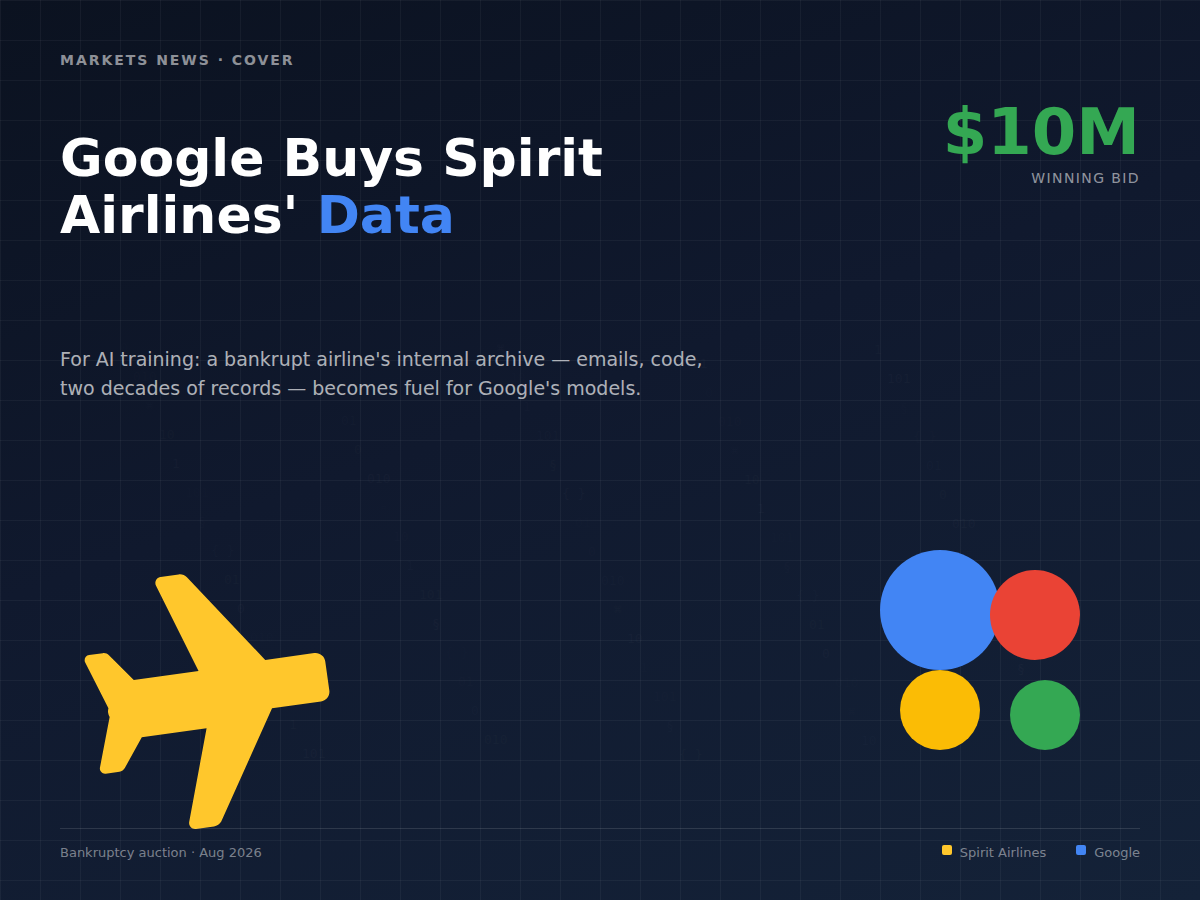
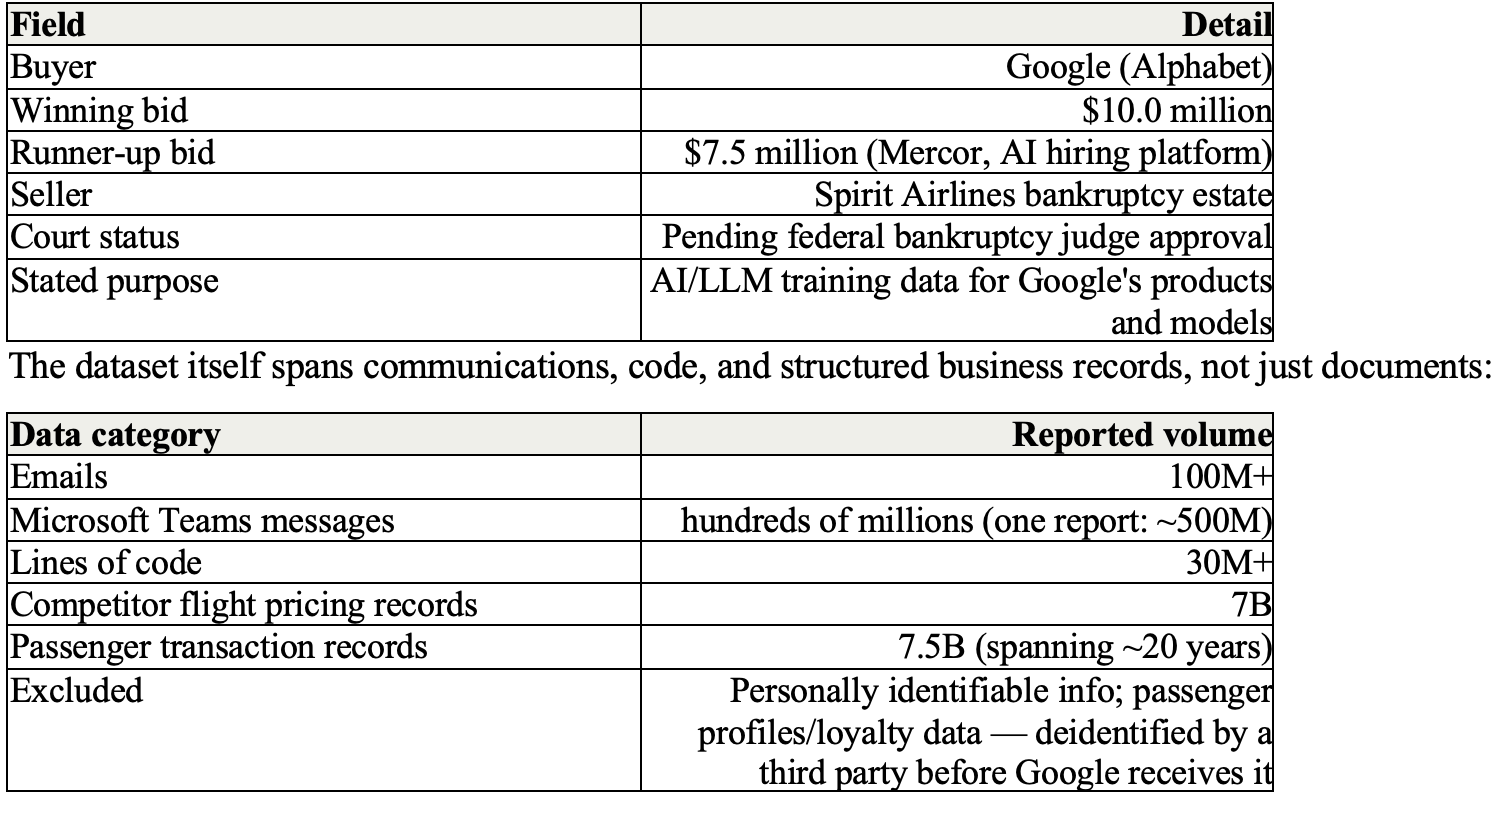
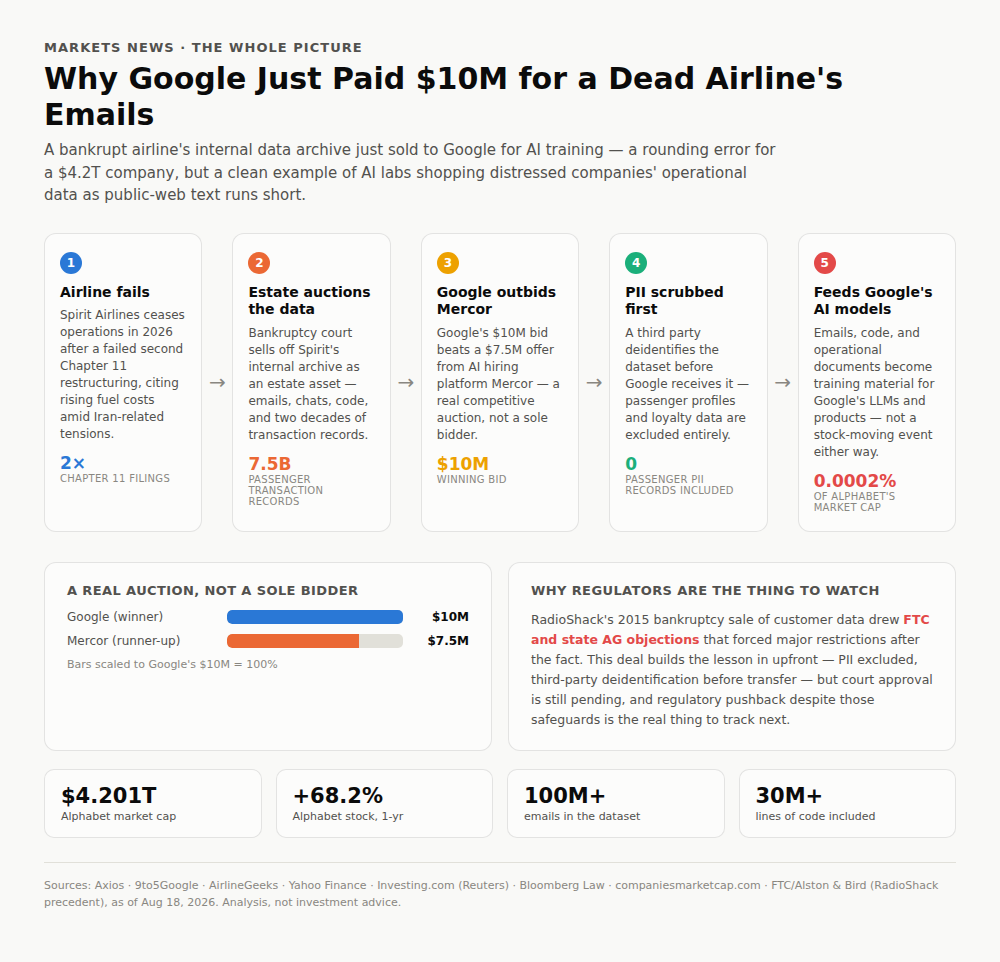
Google won a bankruptcy auction for Spirit Airlines' internal business data at $10 million, edging out a $7.5 million bid from AI hiring platform Mercor. The dataset — over 100 million emails, hundreds of millions of Teams messages, 30M+ lines of code, and 7.5 billion passenger transaction records spanning two decades — is intended as AI/LLM training material. Against Alphabet's $4.201 trillion market cap the deal is financially invisible; its real significance is as a data point in AI labs' growing appetite for large, non-public operational datasets sourced from distressed companies, not as a market-moving transaction.
Will Gemini launch next 'Pro' version in 3Q2026?
YesResult
30.41%
NoResult
69.59%
171 Polls
EndedTBD
What happened?
Spirit Airlines ceased operations in 2026 after failing to emerge from its second Chapter 11 bankruptcy, reportedly driven in part by rising fuel costs tied to Iran-related geopolitical tensions. As part of the bankruptcy estate's asset disposition, Google's $10 million bid beat Mercor's $7.5 million offer for a large internal-data package. A federal bankruptcy judge still needs to approve the sale before it closes.
Significance of the event
Financial Scale: financially trivial — $10 million against Alphabet's $4.201 trillion market cap is roughly 0.00024% of market value, and a rounding error against Alphabet's ad/cloud revenue run-rate.
Novelty? it isn't novel that AI labs buy training data, but the source and composition are notable — a large, structured, non-public operational dataset (proprietary code, two decades of transaction records, competitor pricing intelligence) rather than scraped public web text. This reflects the broader, well-documented AI-industry scramble for data as public-web text supply is increasingly exhausted relative to frontier model appetite.
Narrative: reinforces, rather than complicates, the existing "AI data scarcity" narrative — labs increasingly sourcing proprietary, structured corpora (code, internal operations, transaction history) as a complement to public text.
Does it actually help Google's model training?
Directionally - YES but it matters to separate what kind of help:
Genuine incremental value: this dataset (emails, code, two decades of transaction records, competitor pricing intelligence) is structured, real operational business data — different in kind from scraped public web text. In principle it could help a model perform better on enterprise-workflow, code-understanding, and business-analysis tasks. That's a real, if narrow, training-data-diversity benefit.
But it's not the lever that actually determines model competitiveness right now: look at where Alphabet is actually putting its money — the $195-205B capex is almost entirely data centers, custom silicon (TPUs), and compute, not data acquisition. Frontier model capability today is overwhelmingly driven by compute scale. A $10M dataset purchase is a marginal, nice-to-have addition inside that system, not something that changes Google's competitive position on model quality.
What to watch out?
Gemini execution risk? Whether the next Gemini release lands on a credible timeline or slips again — the stock's ~9% drawdown from its April high has already been tied to "Gemini delays," not to any data deal, so further slippage (or another high-profile departure beyond the ones already reported) is the more direct read on execution risk than anything in this transaction.
Regulatory/antitrust track, not just this deal's own approval. Watch for rulings, discovery timelines, or settlement terms on either, since those carry far more financial/reputational weight than a $10M bankruptcy auction.
Actual capex spend vs. guidance, and how it's financed. Alphabet has already revised 2026 capex guidance upward twice (most recently to $195-205B) — watch whether the next quarterly print shows real spend tracking that number or running ahead of it. Separately, watch the financing side specifically: beyond the $22.93B bond and $18B equity offering already completed, check for additional debt/equity raises, and — more importantly — for off-balance-sheet structures. That's the harder-to-see leverage that matters more than the headline guidance number, and it's where hyperscalers in this cycle have shown a pattern of getting creative.
Jane Street absorbed a roughly $15bn July hit tied to Situational Awareness and other AI-linked tech exposure, even as year-to-date trading revenue topped $40bn.
Workday surged on reported Silver Lake takeover talks, highlighting how private equity may see opportunity in SaaS names pressured by AI disruption fears.
AI spending is also feeding into higher real yields, as heavy bond issuance from governments and companies raises borrowing costs and creates a new valuation headwind for growth stocks.
Jane Street Takes $15 Billion Hit as AI Selloff Ripples Through Markets
Jane Street suffered a roughly $15 billion hit in July from exposure to AI-focused hedge fund Situational Awareness and other technology stocks caught in the market selloff, Reuters reported, citing people familiar with the matter and a note it reviewed.
The loss underscores how sharply the recent pullback in AI-linked assets has reverberated through even the most sophisticated corners of Wall Street. Quantitative funds were among those hit as crowded positions in technology stocks unwound.
The setback, however, comes against an exceptionally strong year for Jane Street. The trading firm has generated more than $40 billion in trading revenue year to date, according to Reuters, already surpassing the $39.6 billion it produced during all of 2025 and putting it well ahead of major banks and market-making rivals.
The contrast highlights the scale of Jane Street’s operations: a single month can produce losses measured in the tens of billions while the firm remains on track for one of the strongest trading years in its history.
Workday Surges on Report of Silver Lake Takeover Talks
Workday Inc. shares jumped as much as 19% after Reuters reported that private-equity firm Silver Lake has been in talks to acquire the enterprise-software company.
The discussions have been underway for several months, according to the report, though there is no certainty that a transaction will be reached.
A potential takeover would come at a pivotal moment for the software-as-a-service sector. Workday, which sells cloud-based software for human resources and financial management, has been among the companies caught in the market’s growing concern that generative AI could weaken traditional SaaS business models.
Investors increasingly worry that AI-assisted software development could lower barriers to entry, enable cheaper competitors and allow large customers to build more applications internally. That pressure has contributed to what investors have dubbed the “SaaSpocalypse,” a broad repricing of software companies viewed as vulnerable to AI-driven disruption.
Workday shares had fallen about 18% this year through Wednesday’s close before the takeover report sparked the sharp rebound.
For Silver Lake, a deal would represent a classic private-equity wager: acquire a large, cash-generative software company during a period of public-market uncertainty and attempt to reposition it away from the quarterly pressures of listed markets.
AI Investment Boom Pushes Real Bond Yields Higher
The artificial-intelligence investment boom is beginning to create pressure in another corner of financial markets: government and corporate bond yields.
Inflation-adjusted borrowing costs across several major economies have climbed to their highest levels in more than a decade as governments and technology companies increase debt issuance to fund infrastructure spending, including the enormous capital requirements associated with AI.
Real yields measure the return investors demand above expected inflation and are widely regarded as a gauge of the true cost of capital. They are influenced by expectations for economic growth and monetary policy, but also by the balance between the supply of bonds and investor demand.
That supply dynamic is becoming increasingly important.
AI infrastructure requires vast spending on data centers, power generation, semiconductors and network equipment. At the same time, governments are running large fiscal deficits and issuing more debt. The combination threatens to keep long-term borrowing costs elevated even if central banks eventually lower policy rates.
For equity markets, the implications are significant. Higher real yields raise the discount rate applied to future corporate earnings, putting particular pressure on high-growth companies whose valuations depend heavily on profits expected years into the future.
Coherent delivered a broad Q4 FY2026 beat, with revenue, margins and earnings all improving. The more important update was management’s roadmap for another leg of AI-related growth: InP capacity is expanding rapidly, while CPO, PhotonLink, Multi-Rail and thermal-management products are expected to begin contributing over the next several quarters. The shares nevertheless fell after hours as strong execution met an already elevated expectations bar.
Will Coherent’s non-GAAP gross margin > 42% in FY2027 Q1?
YesResult
59.56%
NoResult
40.44%
225 Polls
EndedTBD
Key Takeaways
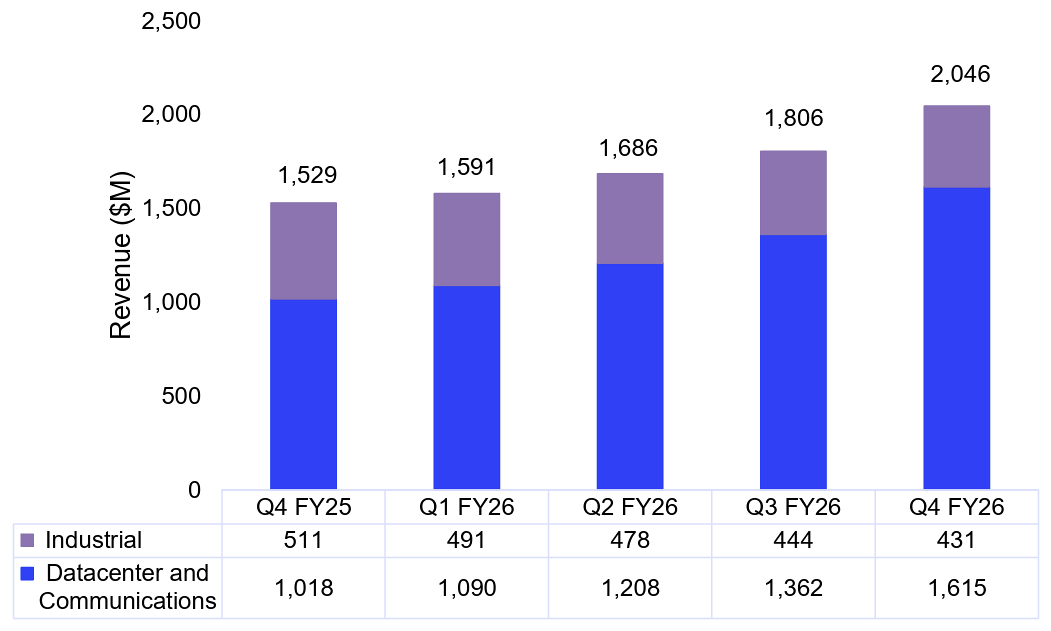
· Results and guidance were stronger than expected. Q4 revenue reached $2.05bn, up 34% yoy and 13% qoq, while non-GAAP EPS rose 74% yoy to $1.74. Non-GAAP gross margin increased 215bps yoy to 40.2%, and operating margin reached 21.8%. Q1 FY2027 guidance calls for revenue of $2.2bn–$2.4bn and non-GAAP EPS of $1.85–$2.05, both above the consensus figures cited in the supplied market review.
· AI optical connectivity is driving an increasingly concentrated growth profile. Data Center & Communications revenue rose 59% yoy to $1.62bn and represented 79% of sales. Industrial revenue fell 16% on a reported basis to $431m. The quarterly trend shows that all net revenue growth over the past year came from the data-center and communications segment, increasing Coherent’s exposure to AI infrastructure spending and execution at major customers.
Quarterly revenue by segment ($m). Source: Coherent investor presentation
· InP capacity is still the central constraint. Internal InP output doubled yoy in Q4, while 6-inch laser output rose ~80%. Management expects internal InP capacity to double by calendar year-end and more than double again by end-2027. The 6-inch line produces CW lasers, EMLs and photodiodes, with management citing better yields and economics than 3-inch production. Backlog extends through FY2027, customer forecasts reach 2028, and many LTAs run three to ten years with pricing and minimum-volume provisions.
· Several new platforms now have specific revenue windows. CPO-related revenue and the PhotonLink integrated optical platform are expected to start increasing in Q2 FY2027. Multi-Rail should begin contributing in the first half, while Thermadite thermal-management revenue is expected in the second half. OCS revenue is already growing, and management raised its estimated 2030 addressable market to more than $4bn. These remain management timelines rather than realized sales.
Source: Coherent investor presentation
· Earnings growth was strong, but cash conversion weakened. FY2026 non-GAAP EPS increased 59% as gross margin and operating leverage improved. However, operating cash flow fell to $80m from $634m, reflecting the working-capital and investment demands of the capacity build. Coherent ended the year with about $2.0bn of cash and short-term investments, while long-term debt declined to $3.21bn, limiting immediate liquidity concerns.
Market Reaction
Coherent rose ~2.8% in regular trading before the release, then fell ~3.5% initially and more than 6% at one point after hours, according to the supplied market review. Lumentum had rallied about 8% after its own stronger-than-expected report one day earlier, creating a demanding peer benchmark.
Coherent had also gained more than 200% over the prior 12 months and traded at roughly 42x forward earnings versus an industry average near 22x in that review. The decline therefore may reflect relative surprise, valuation and the modest near-term margin step-up rather than weaker reported demand.
Key Debates
· Can non-GAAP gross margin exceed 42% by Q4 FY2027?
· Will CPO and PhotonLink generate meaningful revenue in Q2 FY2027?
· Can inventory and capacity investment translate into stronger operating cash flow?
· Will Industrial return to yoy growth within the next two quarters?
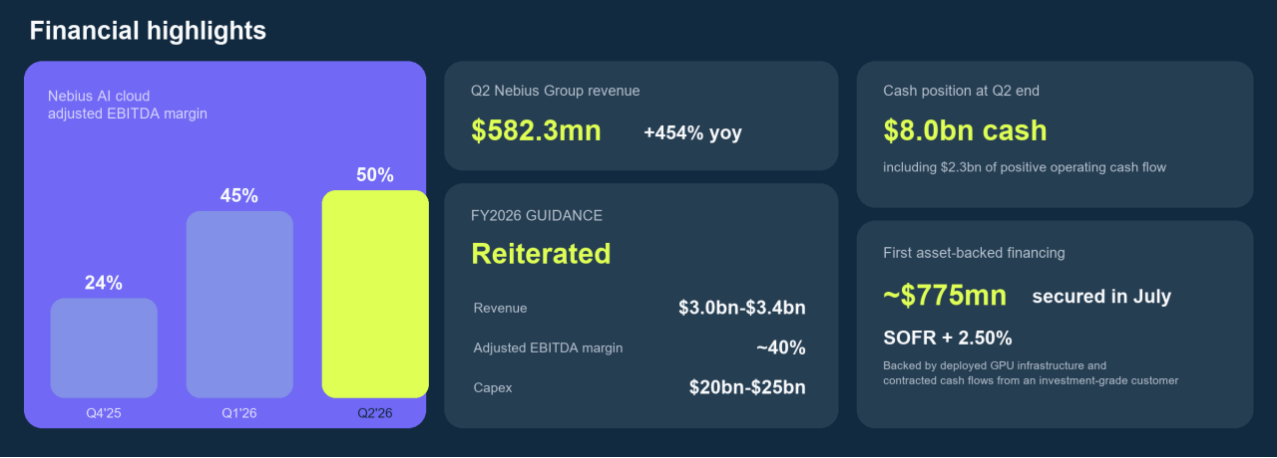
Nebius delivered a clear Q2 beat: revenue reached $582.3mn, up 454% yoy and 46% qoq, versus roughly $510mn-$534mn expected. Nebius AI contributed $574.9mn, while group adjusted EBITDA reached $236.2mn and operating loss narrowed to $175.9mn.
Management said every capacity tranche brought online can be sold, making deployment speed the near-term constraint. The shares rose more than 16% pre-market as the results combined a revenue beat, better profitability and confidence in the 2026 outlook.
Source: Nebius Q2 FY2026 earnings release. Adjusted EBITDA is non-GAAP.
Will Nebius AI Cloud maintain an adjusted EBITDA margin of at least 50% in Q3 FY2026?
YesResult
58.68%
NoResult
41.32%
167 Polls
EndedTBD
Key Takeaways
Financial growth is exceptional, but cluster profitability is not yet corporate profitability. Nebius AI supplied $574.9mn, or 98.7% of group revenue, and its June revenue annualized to $3.0bn, 58% above March. AI adjusted EBITDA margin rose to 49.7% from 45% in Q1 and 24% in Q4 2025 as cost of revenue and SG&A fell sharply as a percentage of sales.
That validates operating leverage in commissioned clusters. It does not yet establish full corporate profitability: the group still reported a $175.9mn GAAP operating loss and a $190.4mn net loss from continuing operations after depreciation, share-based compensation and financing costs.
Three transaction models form the commercial core.
Nebius is managing capacity as a portfolio rather than selling every future MW under one contract type:
3-6 month contracts and auctions monetize urgent, time-sensitive demand at a premium. The first Blackwell auction cleared 15% above the company's previous peak and 20% above standard Blackwell pricing.
1-3 year mid-term contracts remain the core model for leading AI companies. Four Q2 flagship deals averaged more than $1bn of total contract value, with annual contract value of $20mn-$25mn per MW.
Long-term agreements with investment-grade customers trade some pricing optionality for visibility and financing capacity; one contract supported the $775mn asset-backed facility priced at SOFR + 2.50%.
Why it matters: The mix balances utilization, pricing and funding. Reserving capacity for short-duration demand can raise revenue per MW, but also increases renewal and idle-capacity risk.
Related read: Nebius is not the only AI cloud provider facing the scale-to-returns test. This CoreWeave deep dive examines operating leverage, financing costs and the lifetime economics of older GPUs.
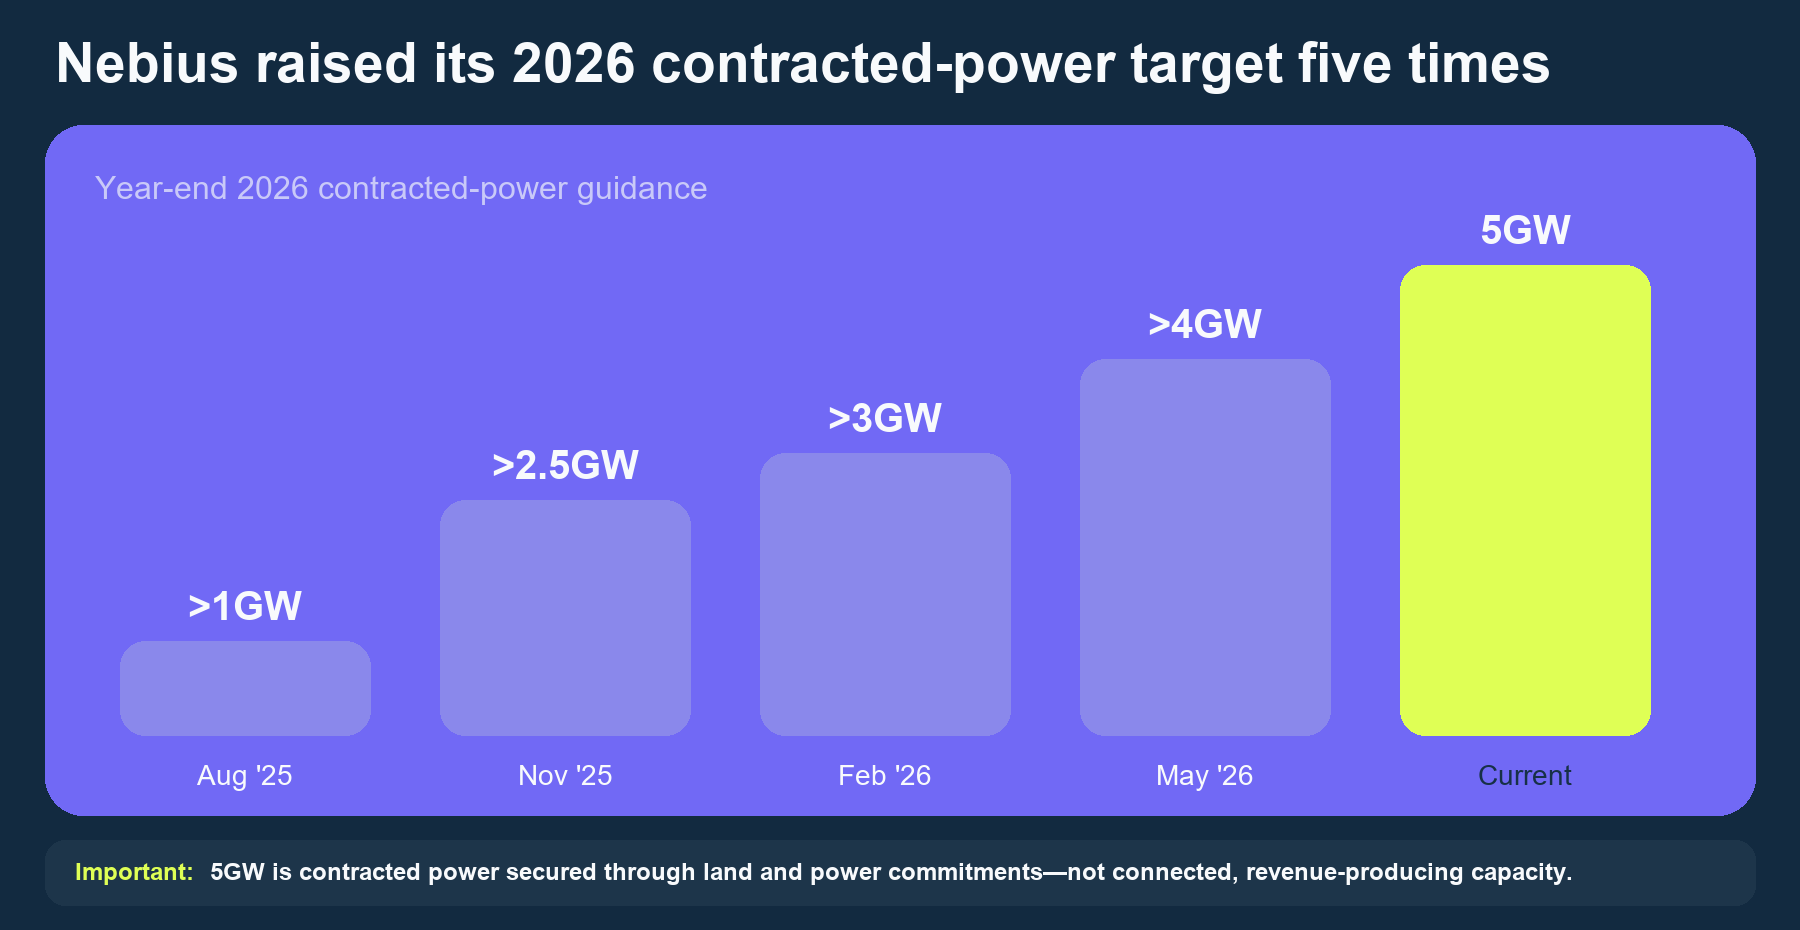
Power access is both the bottleneck and a potential competitive asset. Nebius raised its year-end contracted-power target to 5GW from just over 1GW a year earlier, but connected-power guidance remains 0.8GW-1.0GW - only 16%-20% of the contracted figure.
Source: Nebius
The gap is analytically important: contracted land and power secure a future pipeline, while revenue requires energized sites, delivered GPUs and networks, tested clusters and customer acceptance. Behind-the-meter generation and geographic flexibility may reduce dependence on individual grids, but the key KPI is how quickly and economically signed power becomes billable capacity.
Capital innovation improves funding efficiency, but not the underlying capital intensity. In July, Nebius secured its first ~$775mn asset-backed financing at SOFR plus 2.50%, backed by deployed GPUs and contracted cash flows from an investment-grade customer. Together with prepayments covering an estimated 50%–60% of related capex and its asset-light partnership model, this creates a potentially repeatable funding framework that reduces reliance on corporate cash and equity. However, Q2 capex of ~$5.7bn—almost 10 times quarterly revenue—shows that returns still depend on utilization, financing costs, depreciation and GPU residual value.
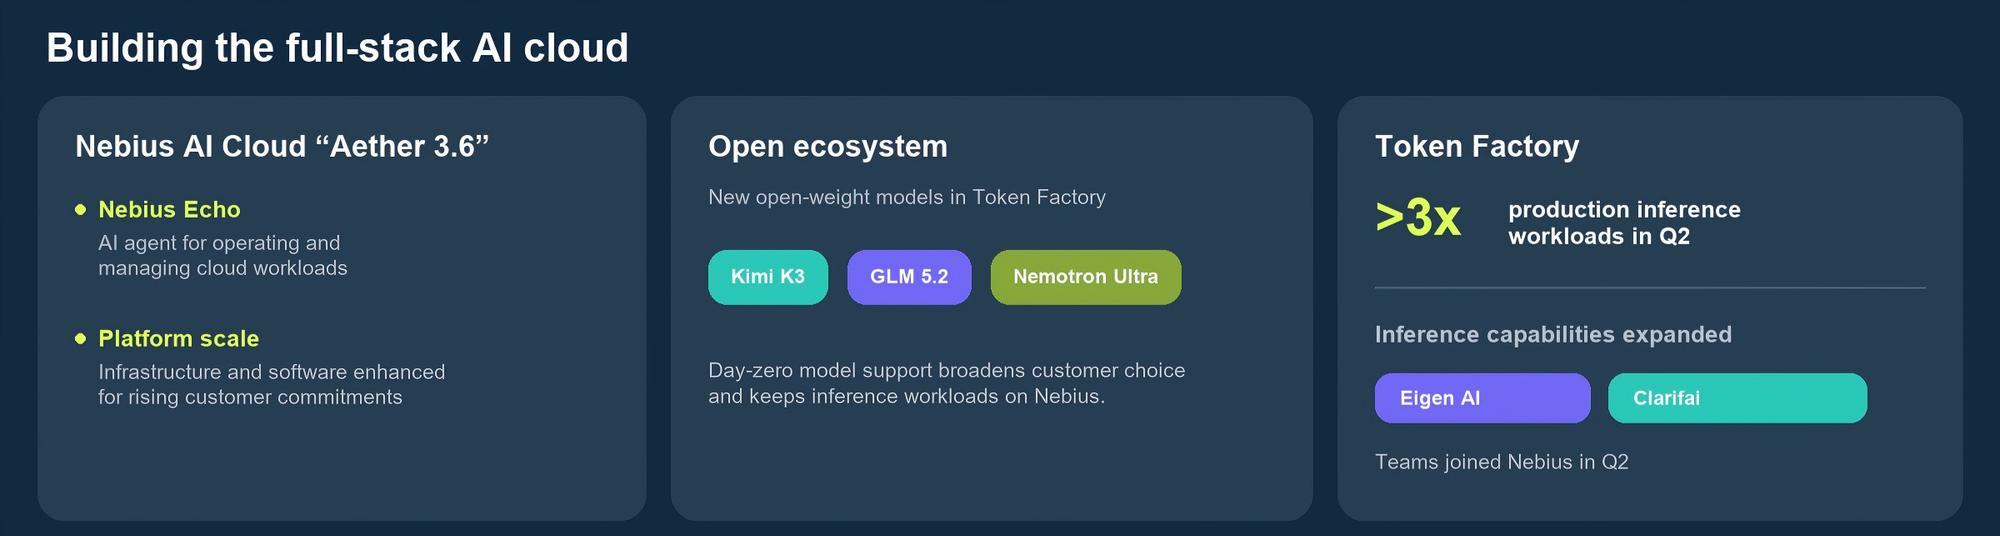
The open ecosystem and Token Factory raise the potential revenue density of the platform. Token Factory inference workloads more than tripled in Q2 as Nebius expanded day-zero support for open-weight models, while the platform added open-weight models including Kimi K3, GLM 5.2 and Nemotron Ultra.
Source: Nebius Q2 FY2026 shareholder letter
The integration of Eigen AI and Clarifai adds inference-optimization capabilities, while Aether 3.6 and Nebius Echo broaden workload management as customer volumes scale. These developments may increase platform usage, compute utilization and revenue per unit of infrastructure.
Market Reaction
Nebius shares rose more than 16% pre-market as Q2 results improved both the scale and quality of its growth outlook.
Revenue beat expectations, while Nebius AI delivered an adjusted EBITDA margin of about 50%, suggesting new capacity is translating into strong operating leverage. Forward visibility also improved after the company signed four major AI cloud contracts with average total contract value above $1bn and annual contract value of $20mn–$25mn per MW.
Pricing remained strong: Nebius’s first Blackwell auction cleared 15% above its previous peak price and 20% above standard pricing, supporting the value of keeping some capacity available for short-duration demand.
Financing concerns also eased after a ~$775mn asset-backed facility priced at SOFR +2.50%, alongside customer prepayments, expanded funding options beyond cash and equity.
Overall, the rally reflected stronger revenue, margins, pricing and financing flexibility, though depreciation, interest costs, dilution and future GPU capex remain key risks.
Key Debates
Can commissioned capacity keep selling at current prices?
Can 5GW of contracted power become connected capacity on schedule?
Do the three transaction models produce comparable lifetime returns?
Does financing innovation improve returns or mainly accelerate deployment?
When will Token Factory become financially measurable?
Taiwan’s latest disclosures point to sustained demand across three layers of the AI infrastructure stack: TSMC’s and UMC’s July 2026 revenue updates, and Hon Hai’s second-quarter operating results.
Together, the companies span distinct segments of Taiwan’s technology supply chain — advanced semiconductor manufacturing, mature and specialty foundry services, and AI server-system production. While all three are benefiting from the broader AI infrastructure buildout, the underlying growth drivers and the implications for margins differ significantly across companies.
Company
Latest revenue
MoM
YoY
AI supply-chain role
TSMC
US$14.61bn (Jul)
+5.6%
+44.7%
Advanced nodes / AI chips
UMC
US$745.1mn (Jul)
+3.1%
+19.0%
Mature and peripheral chips
Hon Hai
US$29.58bn (Jul)
+15.18%
+54.19%
AI servers and rack systems
TSMC: advanced manufacturing remains the primary growth engine
TSMC reported July revenue of approximately US$14.61bn, up 5.6% MoM and 44.7% YoY. Revenue for the first seven months reached approximately US$89.75bn, an increase of 37.0% YoY.
July was about 9% above the Q2 monthly average, indicating that third-quarter growth was not dependent solely on a late-quarter shipment increase. Leading-edge nodes used in AI accelerators and high-performance computing, together with advanced packaging, remained the main drivers.
In Q2, 7nm and more advanced processes represented 77% of wafer revenue, including 30% from 3nm and an initial 3% from 2nm. Management expects a steep 2nm ramp during Q3 and guided to quarterly revenue of US$44.6-45.8 billion. AI accelerators, custom processors and high-performance computing are supporting demand for both leading-edge wafers and advanced packaging.
Will TSMC's Aug 2026 revenue exceed that of July?
YesResult
0.00%
NoResult
0.00%
0 Polls
EndedTBD
UMC: mature-node utilization and product mix continue to improve
UMC reported July revenue of approximately US$745.1mn, up 3.1% MoM and 19.0% YoY. Seven-month revenue was approximately US$4.80bn, representing 12.4% YoY growth.
The improvement is not equivalent to TSMC's direct exposure to advanced AI processors. UMC supplies connectivity, display, power-management, consumer and networking applications. Q2 utilization rose to 85% from 79%, while 22/28nm increased to 37% of revenue and gross margin reached 32.5%.
July's performance is therefore consistent with higher utilization, a better product mix and more stable pricing, with AI infrastructure providing an indirect rather than exclusive demand channel.
Hon Hai: Q2 results underscore growth in AI server systems
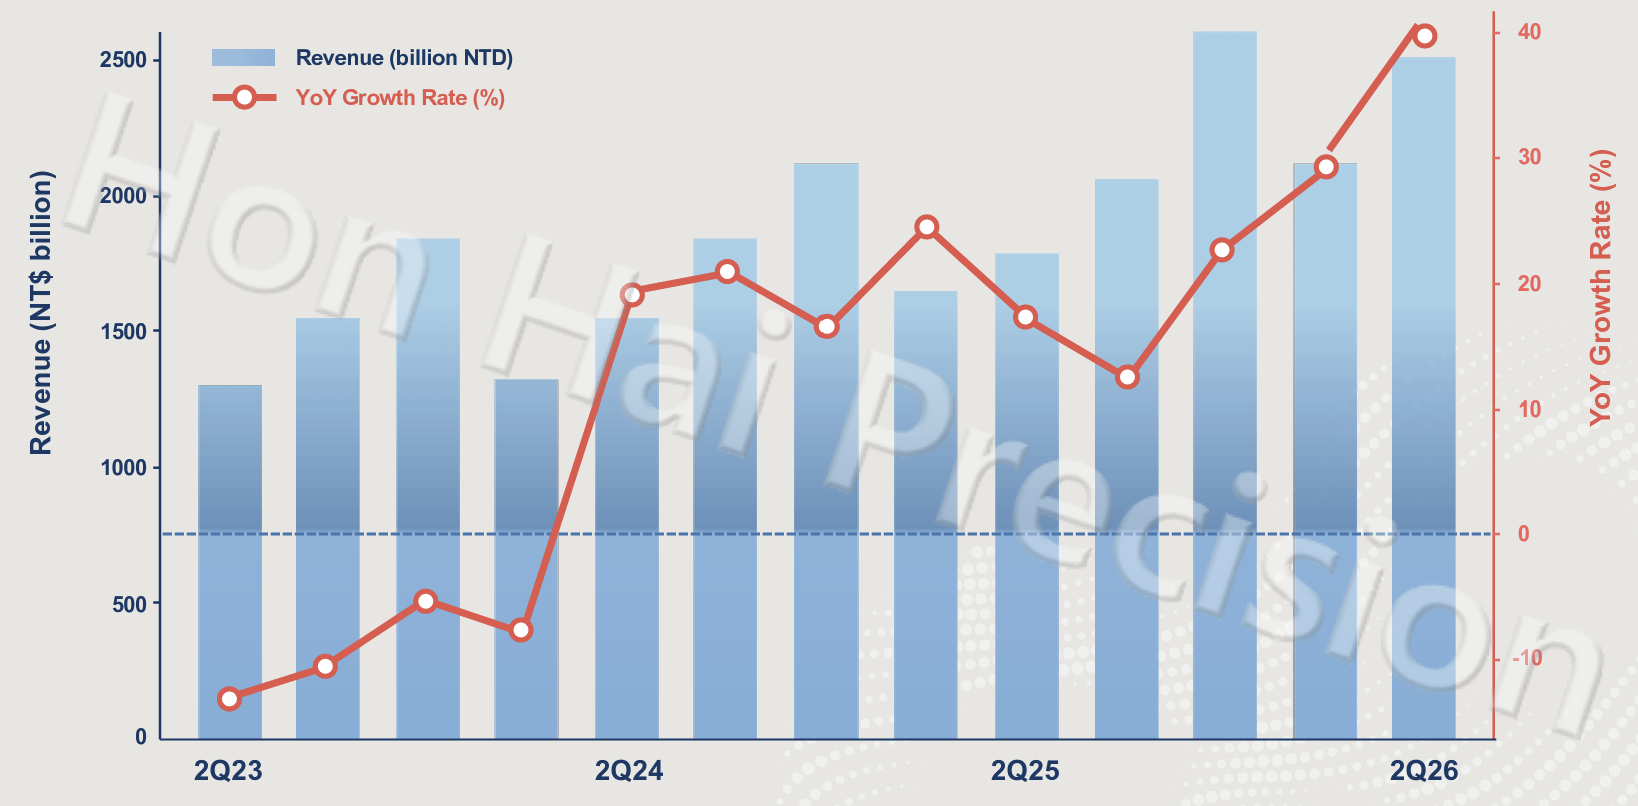
Hon Hai reported July revenue of approximately US$29.58bn, up 15.18% MoM and 54.19% YoY. The sharp sequential rise shows momentum continuing after an already strong Q2, when revenue reached approximately US$78.54bn, increasing 18.0% QoQ and 39.8% YoY.
AI infrastructure is driving revenue growth. Source: Hon Hai
The figures show AI demand reaching the system-production layer as Hon Hai expands from server assembly into integrated racks incorporating computing, networking, cooling, power and interconnect systems. Traditional second-half ICT seasonality also supported the July acceleration.
Will Hon Hai’s August revenue exceed July’s US$29.58bn?
YesResult
50.00%
NoResult
50.00%
2 Polls
EndedTBD
Cloud and networking products were the main growth driver, supported by AI servers and rack-scale systems. Company disclosures indicated that the segment accounted for close to half of group revenue, while industry research pointed to higher shipments of GPU-based racks and custom-ASIC systems for large cloud customers. Hon Hai is also extending its participation into networking, power, cooling and rack integration.
Revenue growth should nevertheless be considered separately from profitability. High-value accelerators can increase reported server revenue substantially, while component-procurement and consignment arrangements affect both revenue recognition and margins. Gross profit, operating margin and the mix between GPU and custom-ASIC programmes therefore remain important indicators of earnings conversion.
Operating read-through: the same AI cycle, different economics
The data support a three-layer transmission of AI capital expenditure through Taiwan: advanced chips at TSMC, peripheral and mature-node content at UMC, and server-system integration at Hon Hai.
The strongest combination of growth and profit conversion is currently at the advanced-chip layer. UMC provides evidence that demand is broadening but remains more exposed to the conventional semiconductor cycle. Hon Hai demonstrates the scale of AI deployment, while the central question is whether exceptional revenue growth produces durable margin and cash-flow improvement.
CoreWeave's Q2 was less about another quarter of exceptional AI demand than about the first credible signs that demand is converting into operating leverage. Revenue rose 112% yoy to $2.575bn, near the top of guidance and slightly above the ~$2.56bn consensus, while adjusted operating income of $128mn exceeded management's $30mn-$90mn range and lifted margin to 5% from 1% in Q1.
Will CoreWeave report >7% adjusted operating margin in 3Q2026?
YesResult
0.00%
NoResult
0.00%
0 Polls
EndedTBD
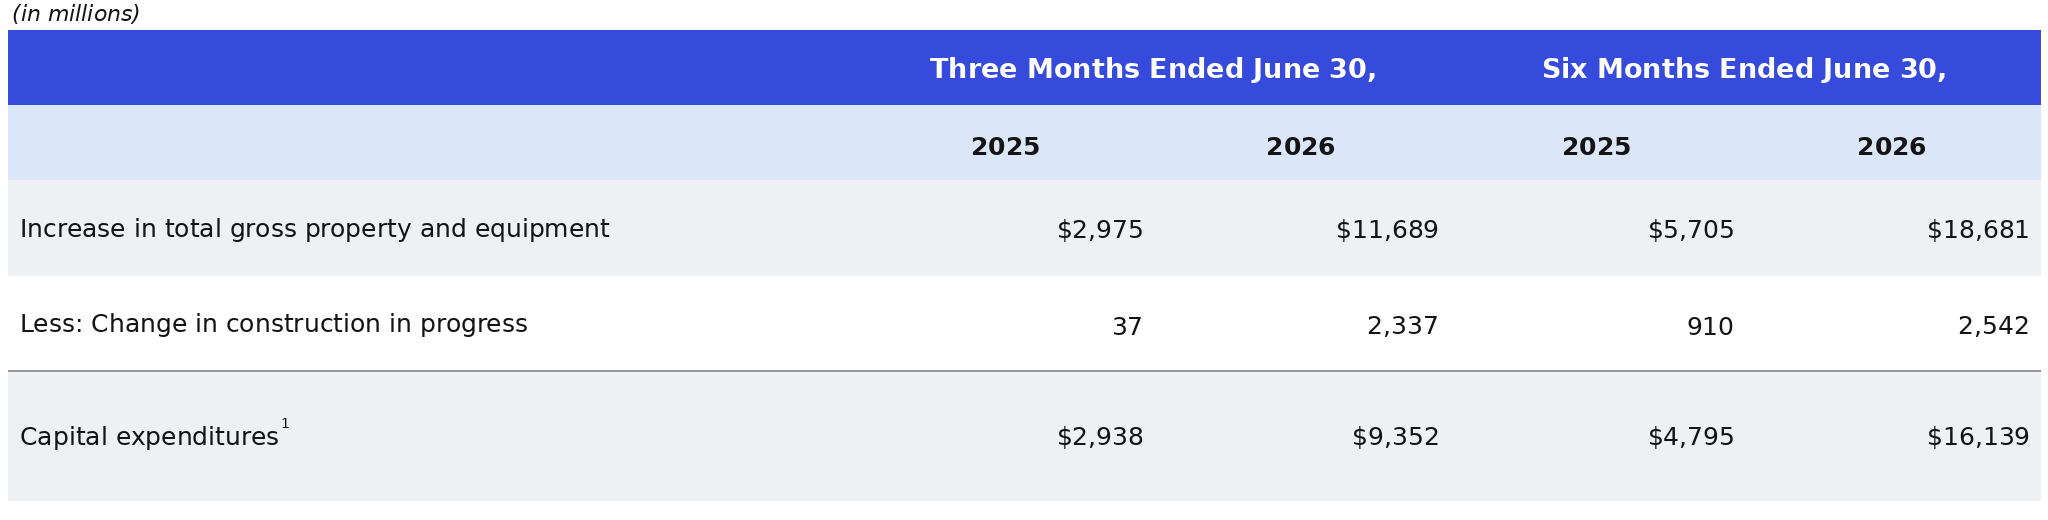
The inflection matters because it arrived before a roughly 25% July price increase cited on the call. But it is not yet proof of attractive corporate economics: adjusted operating margin remained far below 16% a year earlier, net loss was $626mn and quarterly capex reached $9.35bn.
The central question is no longer whether CoreWeave can sell scarce AI capacity; it is whether each new cluster can earn enough over its life to outrun depreciation, interest and technological obsolescence.
TL;DR: Key takeaways
The quarter strengthens the operating-leverage case, but does not complete it. Adjusted operating income rose by $107mn qoq on $497mn of incremental revenue, suggesting that already-built infrastructure is absorbing fixed costs more effectively as utilization increases. Q3 adjusted operating-income guide of $200mn-$260mn and low-double-digit Q4 margin target imply that this conversion should accelerate.
The caveat is the yoy comparison: adjusted operating income fell 36% and adjusted EBITDA margin slipped to 59% from 62%, reflecting depreciation and commissioning costs from the buildout. CoreWeave has shown a sequential turn, not yet a normalized margin.
Pricing and product mix provide a plausible route to the Q4 target.
Management said new contracts carry contribution margins 5-10 percentage points above those signed in recent quarters, reflecting pricing, newer systems and more storage, CPU, networking and software content.
Managed inference ARR increased from about $1mn at launch to more than $100mn, with at least $250mn targeted by year-end; non-GPU ARR exceeded $400mn.
These services can broaden the customer funnel and raise revenue per cluster, but remain small beside the core infrastructure business and are management-reported operating indicators rather than GAAP revenue categories.
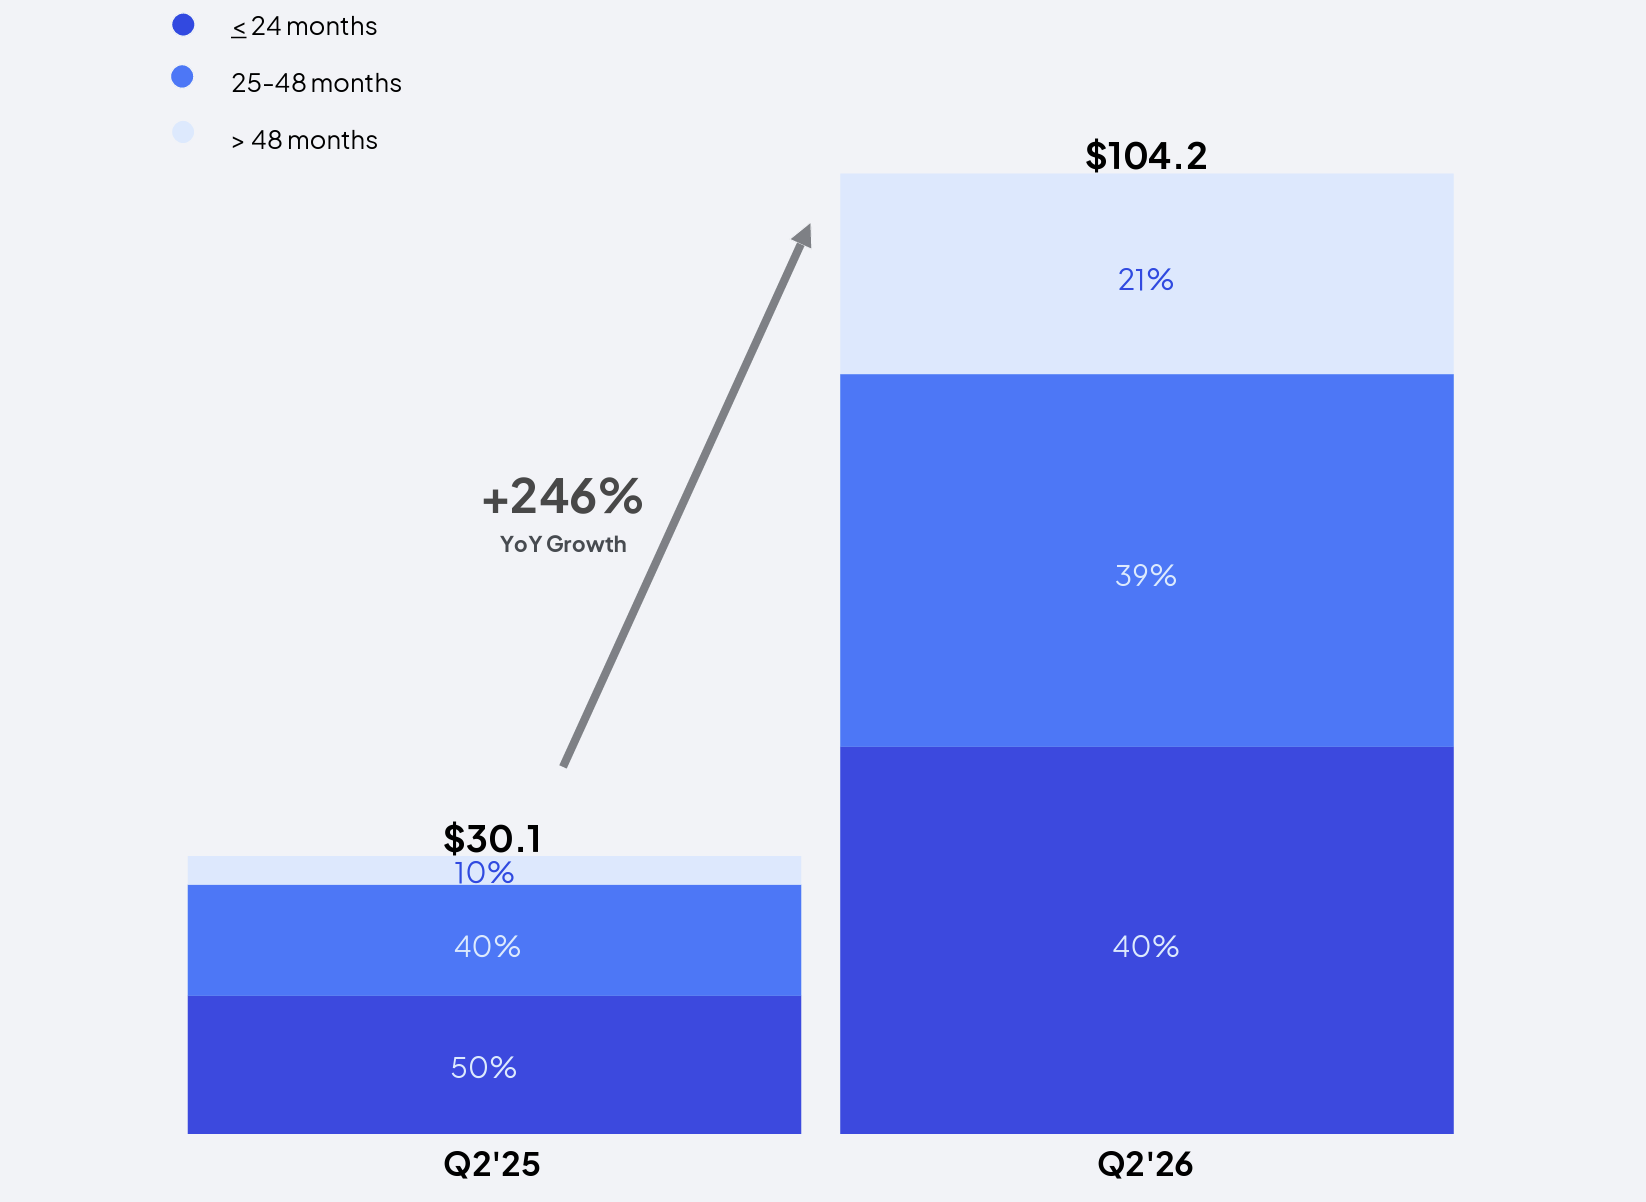
Backlog is becoming an execution schedule rather than a demand indicator. The $104.2bn balance was up 246% yoy and was followed by more than $25bn of early-Q3 commitments, leaving little doubt about customer appetite. What matters now is conversion: 40% is expected within 24 months, and recognition depends on delivery and service availability.
CoreWeave's 1.5 GW of active power and 4.2 GW contracted after quarter-end support future scale, but also expose the model to permitting, construction and supply-chain timing. Backlog has value only when powered capacity reaches customers at the underwritten return.
Q2 FY2026 Revenue Backlog. Source: CoreWeave
The A100 renewal is the call's most important evidence - and its easiest point to overstate. A customer extended use of the 2020-era GPU through 2029 at what management called attractive pricing. If the initial contract has repaid the associated debt, a second term could materially raise lifetime returns without another GPU purchase.
That suggests obsolescence may be slower than feared during a supply-constrained cycle. It does not make old hardware costless or appreciating: power, space and maintenance remain, and one renewal cannot establish fleet-wide residual value.
Financing innovation widens the market, while increasing the importance of discipline. Management said DDTL 5.5 can finance shorter-duration contracts preferred by enterprises, potentially opening a 2-3 year market that previously did not fit five-year asset-backed structures. Shorter contracts may command higher pricing, but leave more renewal risk. With FY2026 capex raised to $35bn-$39bn and interest expense already $640mn in Q2, cheaper or more flexible debt helps only if contract-level returns remain above the cost of capital.
Source: CoreWeave
Key debates
Will $104.2bn of backlog convert on schedule and at attractive returns?
Is the A100 renewal representative of the wider fleet?
Can financing costs fall faster than the asset base expands?
 YU GU
YU GU