Premier info portal for prediction markets. The start point of information market.
Loading…

Latest News

The AI Buildout Still Has Money. But Who Bears the Risk Is Changing
Analysis
AIAI InfrastructureTechnologyAI Power Semi News

The AI Buildout Still Has Money. But Who Bears the Risk Is Changing

AI-related debt issuance has approached $500 billion in 2026. At the same time, delays, grid bottlenecks and fast-aging hardware are making lenders a lot pickier. Is this the end of the AI infrastructure boom?

Economics & FinanceTech

The financing behind the AI infrastructure boom is growing up. And getting more discriminating.

Goldman Sachs analysts estimates that the broader AI ecosystem has issued nearly $500 billion of debt so far in 2026. Separately, AI-linked borrowers accounted for about 18% of U.S. investment-grade issuance, up from 7% in 2025 and just 1% in 2024. Hyperscalers represented only about 40% of Goldman’s broader AI-related total, showing how far the financing boom has spread beyond the largest technology companies.

Lenders have noticed. Before they write another big check for a data center, they increasingly want stronger guarantees, completed permits, committed tenants and a higher yield. Meanwhile, some exposure is moving off hyperscaler balance sheets and into special-purpose vehicles, private-credit funds, infrastructure investors and insurers, although guarantees can still leave hyperscalers carrying much of the ultimate risk.

The bearish take is that investors are losing faith in the economics of AI infrastructure. But I think this call is early.

What I see is a market that still believes AI demand will grow but is no longer willing to swallow construction, power, refinancing and obsolescence risk without getting paid (and protected) for it.

The real question is: Who absorbs the loss when a project shows up late, blows through its budget or is stuffed with hardware that ages before the debt does?

What do you think will be the biggest constraint on AI infrastructure through 2027?

Electricity and grid connections
0.00%
Financing costs
0.00%
Chips and equipment
0.00%
Permitting and political opposition
0.00%
Insufficient AI revenue
0.00%
I’m still making up my mind
0.00%
0 Polls

AI debt is too big to dismiss as a technology-sector footnote

In the first leg of this cycle, the biggest technology companies largely funded AI infrastructure from their own enormous cash flows and balance sheets.

This worked when the numbers were merely big, but now they are eye-watering.

Alphabet expects to invest between $195 billion and $205 billion in 2026. At this scale, the funding mix becomes an issue. Put simply, AI is now reshaping corporate credit and competing with governments, utilities and ordinary businesses for long-dated capital.

Amazon’s first sterling bond sale is a good example. The company raised £4.25 billion across four maturities after drawing more than £10 billion of orders. There was plenty of demand, clearly, covering the deal about 2.5 times versus roughly five times for Alphabet’s sterling sale in February. Demand runs deep, but it is not unlimited.

Still, Amazon can raise billions because it has a diversified business, investment-grade credit and a formidable cash engine. A speculative data-center developer does not get those terms simply by sprinkling “AI” over a pitch deck and suggesting a hyperscaler might eventually need the space.

Placing them all under the label “AI debt” disguises very different risks.

The first headache is delivery, not demand

There is still plenty of demand for compute. The International Energy Agency says global data-center electricity consumption rose 17% in 2025, while consumption by AI-focused data centers jumped by roughly 50%.

In its base case, as shown below, total data-center electricity demand roughly doubles (485 terawatt-hours in 2025) to about 950 terawatt-hours by 2030.

Source: IEA

But wanting compute and delivering a revenue-producing data center are two very different things. A project needs the right land, transmission equipment, grid access, cooling, chips and local approval. If just one piece goes missing, the whole schedule can slip. These projects are only as fast as their slowest bottleneck.

AI demand may be abundant while financeable sites remain scarce.

Google’s Finland bet: Is this what a financeable project looks like now?

Google’s newly announced Finnish expansion is a useful example. The company plans to invest at least €13 billion across digital infrastructure, clean energy and local partnerships in Finland over the next two years. Reuters reports that the program includes three new data centers in northern Finland.

The financing case is unusually strong. Google has signed a 22-year agreement to purchase up to half the output of Fortum’s Loviisa nuclear plant from 2030, while also supporting new wind capacity and a 94-megawatt battery system. A strong sponsor reduces tenant and refinancing risk, secured long-term power reduces a major operational uncertainty, and Finland’s colder climate lowers the cooling burden.

The project gives both bulls and bears something to work with.

The bull case: one of the world’s largest technology companies is committing €13 billion because it expects AI demand to stick around.

The bear case: getting a project like this over the line increasingly takes hyperscaler backing, multi-decade energy commitments and an unusually favorable location.

So, is this a credit bubble?

Not yet, at least not in the strict sense.

Current market evidence supports a repricing story more clearly than a funding-collapse story. Deals are still clearing, but spreads, new-issue concessions and order-book coverage are becoming less favorable to issuers.

The best bubble argument is that infrastructure spending is outrunning proven AI revenue, with part of the buildout funded through complex structures whose risks may be too lightly priced. Capital is being committed today against forecasts for future grid access, equipment values and customer demand.

The strongest rebuttal is that the largest direct borrowers remain investment-grade hyperscalers, while many project-financed facilities have anchor tenants or long-term leases. That reduces tenant risk, but it does not eliminate construction, power-delivery, refinancing or hardware-obsolescence risk.

I can hold both ideas at once.

But is this looking like an underwriting story? In the first phase, investors were rewarded for backing almost anything with a credible AI angle. The next phase will separate projects with secured power, strong counterparties and believable schedules from those running on rosy assumptions about all three.

What I’m watching for signs of trouble

My real alarm bell would be three things happening together: projects getting cancelled, utilization falling and guarantees being called. But this would detect the problem too late. Most likely, the earliest warning signs would be weaker bond-cover ratios, wider new-issue concessions and delays or lease changes after financing has closed.

For now, I see repricing risk, not capital heading for the exits.

Power, permits, tenant quality, hardware life and guarantees now play a much bigger role in deciding which projects get funded and who takes the hit if the timetable slips.

The next fault line may appear in financing documents before it reaches chip orders or headline capex guidance: wider spreads, tighter covenants, stronger guarantees and lease provisions revealing who remains on the hook if a project slips.

What would make you turn bearish on AI-infrastructure credit?

Capex outrunning cash flow
0.00%
Wider spreads and weak demand
0.00%
Project delays or cancellations
0.00%
Lease renegotiations
0.00%
0 Polls

Sources

  1. Goldman Sachs: How AI debt is reshaping the credit market
  2. Google: Google deepens its commitment to Finland with a €13 billion investment in AI infrastructure
  3. International Energy Agency: Energy demand from AI and data centers
  4. International Energy Agency: Key Questions on Energy and AI
  5. Reuters : AI construction crunch widens credit fault lines
  6. Reuters: Amazon’s first sterling bond sale
  7. Reuters: Five debt hotspots in the AI data-center boom
  8. Yahoo Finance: Alphabet Will Spend as Much as $205 Billion This Year. The Depreciation Bill Starts Landing in 2027.
RINs: The “Shadow Currency” of the U.S. Fuel Market
Editorial
Must ReadCommodityUSARegulatory

RINs: The “Shadow Currency” of the U.S. Fuel Market

The US biofuel mandate runs on a shadow market where RIN prices reveal the true cost of forcing more renewable fuel into the system.

Economics & FinancePolitics

On August 31, 2026, the U.S. Environmental Protection Agency (EPA) announced what appeared to be a highly technical decision: 29 small refineries would be exempted from compliance obligations totaling 1.76 billion Renewable Identification Numbers, or RINs. After the announcement, however, the price of RINs used for ethanol compliance rose by about 16% in a single day.

This electronic credit called a RIN has created a market in which companies effectively price the cost of complying with the U.S. government's biofuel mandate. RINs are the "currency" of that market.

Why Does the U.S. Need RINs?

The U.S. has a policy called the Renewable Fuel Standard (RFS). It requires the U.S. transportation fuel system to use a certain amount of renewable fuel each year, including corn ethanol, biodiesel, and renewable diesel. The RFS was first authorized under the Energy Policy Act of 2005 and was expanded further in 2007.

When it comes to requiring the use of renewable fuels, one of the simplest regulatory approaches would have been for the government to tell every refinery exactly how many hundreds of millions of gallons of ethanol and biodiesel it had to blend each year. But this approach has an obvious problem: the cost of using biofuels is not the same for every company. Some firms own their own fuel terminals, ethanol procurement networks, and blending facilities, making it relatively easy for them to blend ethanol into gasoline. Other refineries may focus mainly on processing crude oil into gasoline and diesel and may not have sufficient downstream blending infrastructure, making compliance through their own biofuel blending more expensive. If every refinery were required to personally complete the same proportion of renewable fuel blending, the system would not necessarily achieve the policy target at the lowest possible cost.

The U.S. therefore adopted a different design: the government determines how much renewable fuel the market as a whole must use, and then creates a tradable credit system that allows companies to decide for themselves who will actually carry out those tasks. That system is implemented through RINs.

EPA defines one RIN as one ethanol-equivalent gallon, meaning one gallon of renewable fuel measured on an ethanol-equivalent basis. For 2026, EPA finalized a total applicable renewable fuel volume of 26.81 billion RINs, rising to 27.02 billion RINs in 2027. EPA first converts the national renewable fuel target into uniform percentage standards based on the nationwide target and expected gasoline and diesel supply. Then, each company that produces or imports gasoline or diesel calculates its own Renewable Volume Obligation, or RVO based on the actual amount of fuel it produces or imports. In the simplest terms, RVO = the company's actual production or imports of gasoline and diesel × the annual percentage standard set by EPA. Suppose a particular percentage standard is 10%. If a refinery produces 1 billion gallons of gasoline and diesel subject to the RFS during the year, it would ultimately need approximately 1 billion × 10% = 100 million corresponding RINs to satisfy its RVO.

EPA therefore determines the nationwide rules, but the number of RINs each refinery actually needs depends on how much petroleum fuel it produces or imports. This is the source of demand in the RIN market.

Each renewable fuel is assigned a “D-code” that classifies it based on factors such as the feedstock used, the type of fuel produced, the energy inputs involved, and the applicable greenhouse-gas reduction threshold. These D-codes determine which of the four RVO categories a given renewable fuel can be used to satisfy. (Illustration by EPA)
Technically, the RFS has four categories of RVOs, and each D-code is eligible to satisfy specific RVO categories. (Source: EPA)
Volume requirements for different RVO categories. SRE reallocation will be explained later in this article. (Source: EPA)

How Does a RIN Move Through the System?

To make the process clear, suppose there are four companies in the market:

  • A: a corn ethanol producer
  • B: a fuel trader
  • C: a fuel terminal / blender responsible for blending ethanol into gasoline
  • D: a refinery producing gasoline and diesel

The life of a typical RIN consists of moving among these entities.

Company A's corn ethanol plant must first participate in the RFS regulatory system, and the feedstocks it uses, its production process, and the fuel it ultimately produces must qualify under an EPA-approved renewable fuel pathway.

Now suppose A produces 1 million gallons of qualifying corn ethanol. Conventional fuel ethanol generally has an equivalence value of 1.0, so these 1 million gallons of ethanol can generate 1,000,000 RINs. A must generate the RINs associated with its qualifying renewable fuel in the EPA Moderated Transaction System, or EMTS. EMTS is described as the database of record for all RIN transactions and can be understood as the official ledger for this market. The generation, transfer, separation, and retirement of all RINs (these concepts will be explained soon) must be recorded in this official EPA electronic system.

Once RIN generation has been completed in the system, A has 1 million RINs on its books. But at this stage, those RINs are not yet financial assets that can be freely sold separately from the ethanol. They are in a state known as Attached RINs. In this state, ownership of the RINs moves together with ownership of the physical ethanol. If a buyer purchases the ethanol, it also acquires the corresponding RINs. The relevant RIN information must also appear on the product transfer documents.

A now sells the 1 million gallons of ethanol to fuel trader B. B therefore receives the 1 million gallons of ethanol + the corresponding Attached RINs.

B then sells the ethanol to terminal C. The ethanol and the Attached RINs are still transferred together to C.

Terminal C now holds 1 million gallons of ethanol and 1 million Attached RINs. At the same time, C also holds conventional gasoline produced by the refining system. It blends 90% gasoline with 10% ethanol to produce E10, the most common gasoline blend in the U.S..

At this point, a critical change occurs. The original ethanol has now actually been blended into gasoline and entered transportation fuel, satisfying the separation conditions specified in the regulations. The corresponding RINs can therefore be separated from the physical ethanol and become Separated RINs. From this moment onward, the RINs are no longer tied to the original batch of ethanol. C can sell the blended E10 gasoline to gas stations while separately selling the 1 million Separated RINs to a refinery or a registered RIN trader, or it can choose to hold the Separated RINs temporarily in its own account and sell them later. A Separated RIN is therefore a credit that has been detached from the physical fuel and can be traded independently. What we normally refer to as the "RIN market" is primarily the market for these credits, rather than for Attached RINs.

Now shift the perspective to refinery D. Its primary production process is refining crude oil into gasoline and diesel. It produces fossil fuels rather than corn ethanol, so it does not receive a RIN for every gallon of ordinary gasoline it produces in the way ethanol producer A does. Quite the opposite: refineries and gasoline/diesel importers are typical obligated parties under the RFS. As they produce or import petroleum fuels, their RVOs increase accordingly. D must therefore obtain an equivalent quantity of RINs. There are two typical ways to obtain RINs. The first is for the obligated party to participate directly in renewable fuel blending, thereby obtaining and separating RINs. The second is to purchase RINs that have already been separated by someone else in the market.

In practice, the industry chain may therefore work as follows: Refinery D produces gasoline, while Ethanol Plant A produces ethanol and generates Attached RINs. Terminal C then blends the two into E10 and sells the resulting Separated RINs back to D. This also explains why a tradable RIN market is necessary. The company that incurs the regulatory obligation is not necessarily the same company that actually performs the renewable fuel blending. RINs connect these two stages.

RINs, however, are not traded on an exchange with an order book like CME. EPA explains that buyers and sellers first reach a transaction agreement outside EMTS, after which the buyer and seller separately submit Buy and Sell records in EMTS. EMTS matches the transaction records from both sides and performs quality checks. Only after confirmation are the RINs formally transferred from the seller's account to the buyer's account. By this stage, the ethanol that originally created those RINs may already have been burned in a car engine as part of E10 gasoline. Yet the "compliance value" left behind by that ethanol continues to exist independently in the form of RINs, even though the RINs themselves have no direct consumption value. This is also why RINs have strong characteristics of financial assets.

Source: EPA

Refinery D does not have to surrender the corresponding RINs to EPA immediately every time it produces a gallon of gasoline. Throughout the compliance year, it can continue producing gasoline and diesel and accumulating RVOs, while buying and selling RINs and building a RIN inventory. Only at the annual compliance stage, usually after the end of the compliance year, does it calculate its actual obligation for the year and retire for compliance the RINs it owns. EPA's currently published reporting deadline for the 2026 compliance year is March 31, 2027. To retire a RIN essentially means to cancel it for compliance purposes. Once a RIN has been used to satisfy a refinery's RVO, it can no longer be sold or used by another refinery to satisfy a second compliance obligation. Its life cycle ends there.

Source: EPA

Where Does the Value of a RIN Come From?

The government requires certain companies to hold enough RINs to comply with the law, creating mandatory demand. At the same time, the supply of RINs is tied to the production and use of renewable fuels. Therefore, as long as the government's renewable fuel target exceeds the amount the market would naturally choose to use without policy incentives, RINs will have a positive price.

An extremely simplified example illustrates the mechanism. Suppose conventional diesel costs $3 per gallon to produce, while renewable diesel costs $4 per gallon. Without policy intervention, the market would naturally prefer producing the cheaper conventional diesel. But now suppose the government requires greater use of renewable diesel. For the marginal gallon of renewable diesel to be worth producing, the $1 cost gap must be compensated. If producing that gallon of renewable diesel generates a RIN worth $1, the producer's effective cost becomes $4 - $1 of RIN value = $3, making renewable diesel competitive again.

The most important economic meaning of the RIN price is therefore: how much additional economic incentive is required for the U.S. to consume one more unit of renewable fuel? It is the shadow price of the Renewable Fuel Standard. The government determines the quantity target, while the market uses the RIN price to tell policymakers and companies how difficult that target is to achieve.

Why Did RIN Prices Rise Above Two Dollars in 2026?

If the renewable fuel mandate is easy to satisfy, RINs do not need to be expensive. For example, U.S. gasoline has long contained large amounts of E10, meaning gasoline with roughly 10% ethanol. Within this range, blending ethanol into gasoline is already a highly mature commercial activity.

The problem emerges when the government requires renewable fuel use to increase further. By around 2013, the ethanol share of the U.S. gasoline pool had already approached the roughly 10% level that mainstream E10 could accommodate, commonly referred to as the E10 blend wall. Expanding ethanol consumption further increasingly requires higher-ethanol blends such as E15 and E85, along with compatible vehicles, gas station equipment, and consumer acceptance.

If the low-cost opportunities for blending ethanol into gasoline are gradually exhausted, additional RFS obligations may increasingly depend on other fuels such as biodiesel and renewable diesel. The more expensive the marginal compliance pathway becomes, the higher the RIN price must rise to incentivize additional production.

On June 4, 2026, D4 RINs associated with biomass-based diesel had reached $2.41, while D6 RINs associated mainly with conventional ethanol had reached $2.37, both close to the record highs set in 2021. EIA attributed the rise in RIN prices in 2026 primarily to higher blending mandates.

This shows just how large the policy value embedded in RINs can become. One gallon of fuel ethanol generally generates 1.0 RIN. One gallon of biodiesel generates about 1.5 RINs. One gallon of renewable diesel typically generates about 1.6-1.7 RINs. So when the RIN price reaches roughly $2.40, the credits alone can provide more than $3.50 of value per gallon of biodiesel or renewable diesel. That $3.50 is not energy value. It is additional regulatory value.

The economic effect of RINs is therefore similar to simultaneously increasing the relative cost of petroleum fuels and increasing the relative value of renewable fuels. NBER describes the mechanism very directly: economically, RINs function like a charge on obligated petroleum fuels while providing a corrective subsidy to renewable fuels.

The August 2026 Small Refinery Exemptions

In August 2026, the U.S. allowed qualifying small refineries to apply for Small Refinery Exemptions, or SREs. Put simply, if EPA determines that an eligible small refinery faces particular economic hardship because of the RFS, the agency may exempt some or all of its RFS obligation.

We now know that the number of RINs a refinery needs to acquire depends fundamentally on its RVO. If EPA directly exempts part of a refinery's obligation, the refinery naturally no longer needs to purchase RINs for that portion of the obligation. Demand for RINs should therefore fall, and RIN prices should also decline, at least in theory.

On August 24, 2026, while EPA delayed the compliance deadline and the market awaited decisions on 34 SRE petitions, D6 RINs fell by 34 cents in a single day to $1.75, their lowest level since mid-April. The market had already begun betting that EPA might exempt a large amount of RIN obligations.

One week later, the answer arrived. Of the 34 SRE petitions for 2025:

  • 18 received full exemptions
  • 11 received 50% exemptions
  • 3 were denied
  • 2 were determined to be ineligible

The total compliance obligation exempted ultimately reached 1.76 billion RINs. This was a large number. When EPA finalized its 2026-2027 rules, the reallocation volume incorporated for 2025 SREs was 990 million RINs. The actual exemption of 1.76 billion RINs was 770 million RINs higher than the 990 million previously incorporated. Under the simplest supply-and-demand logic, this should have been extremely bearish for RINs. But something highly counterintuitive happened: after the policy announcement, RIN prices instead rose by about 16%.

The answer was hidden in another sentence in the same EPA announcement. Although EPA exempted 1.76 billion RINs of 2025 obligations, it also announced that it planned to propose, before the end of October 2026, a mechanism to reallocate 100% of the difference between the actual 2025 exemption volume and the amount previously assumed into the 2026 and 2027 RVOs. In other words, a single announcement created two opposing shocks at the same time. Although some 2025 obligations were being eliminated immediately, reducing current RIN demand, approximately 770 million additional obligations could be added back into 2026-2027, increasing future RIN demand. Because of the existence of the E10 blend wall, the market ultimately judged that the additional future scarcity mattered more than the immediate exemptions, and RIN prices rose.

Volume requirements for different RVO categories (Source: EPA)

At the Other End of the RIN Market Is More Than One-Third of U.S. Corn Demand

If RINs were merely an internal accounting system within the refining industry, this story might not matter very much.

But the other end of the RIN system is connected to U.S. agriculture. A large share of U.S. corn is ultimately not eaten directly by people or fed to livestock, but processed into fuel ethanol. USDA data show that in the 2024/25 marketing year, 5.44 billion bushels of U.S. corn were used for fuel ethanol, accounting for 36% of total U.S. corn use. In other words, more than one-third of U.S. corn demand is now connected to the transportation fuel system.

So when EPA changes RIN demand, the effects do not stop at the refinery. When RIN prices change, the economics of producing ethanol, biodiesel, and renewable diesel change as well, which in turn affects demand for feedstocks such as corn and soybean oil. The RFS has therefore never been merely an environmental policy. It is simultaneously an energy policy and an agricultural policy.

Ethanol share of total U.S. corn use, 2010/11-2024/25 (Source: USDA Feed Grains Yearbook Tables, Tables 4 and 31. Denominator includes exports.)

RINs Are Not Environmental Points, but the Price of "Regulatory Scarcity"

Calling RINs a kind of "shadow currency" does not, of course, mean that they are literally equivalent to dollars. They cannot be used to buy coffee, nor do they possess purchasing power in the conventional sense. But the analogy captures the three most important characteristics of RINs.

First, the government creates demand. Obligated parties that produce and import gasoline and diesel generate RVOs based on their fuel volumes and are therefore legally required to obtain the corresponding number of RINs.

Second, renewable fuel creates supply. Renewable fuel producers that meet RFS requirements generate RINs. The RINs initially move together with the physical fuel in Attached form and, once the necessary conditions are satisfied, become independently tradable Separated RINs.

Third, the market determines the price. If the quantity of renewable fuel required by the government is easy to supply, RINs are cheap. If the requirement approaches the limit of what the existing U.S. fuel system can absorb at low cost, RIN prices rise. They will keep rising until some new marginal compliance pathway becomes economically viable.

What the U.S. Renewable Fuel Standard has therefore created is fundamentally a price-discovery mechanism. The government specifies the quantity, the market searches for the lowest-cost way to achieve it, and the RIN price continuously tells the market how difficult that target is to meet.

One economic interpretation of a RIN, therefore, is that it represents the price of regulatory scarcity, a price that simultaneously connects the U.S. energy industry with agriculture. Most American drivers may never personally buy or sell a RIN in their lives. But every time they fill up their tanks, this market is operating in the background. The violent price movement in August 2026 merely caused a machine that normally remains hidden behind gasoline prices to briefly reveal itself.

Disclaimer: The content is for informational purposes only. You should not construe any such information or other material as legal, tax, investment, financial, or other advice. Nothing contained in this article constitutes a solicitation, recommendation, endorsement, or offer by the author(s) or any third party service provider to buy or sell any securities or other financial instruments in your or in any other jurisdiction in which such solicitation or offer would be unlawful under the securities laws of such jurisdiction. The author(s) report(s) no conflict of interest.

Operational Update - Evergreen, Yang Ming and Wan Hai Record Positive 8M 2026 Revenue Growth
Quick Take
Container ShippingEarnings & OperationsMaritimeMaritime Insights

Operational Update - Evergreen, Yang Ming and Wan Hai Record Positive 8M 2026 Revenue Growth

Taiwan’s three major container carriers — Evergreen Marine, Yang Ming Marine Transport, and Wan Hai Lines — all posted higher revenue in August 2026, both y/y and m/m.

Economics & Finance

Taiwan’s three major container carriers — Evergreen Marine, Yang Ming Marine Transport, and Wan Hai Lines — all posted higher revenue in August 2026, both y/y and m/m. The improvement was also visible on a year-to-date basis, with all three remaining in positive territory through the first eight months of the year.

Company Aug.
Revenue
MoM YoY 8M
Revenue
8M
YoY
Evergreen NT$49.0bn +1.9% +48.6% NT$288.7bn +9.8%
Yang Ming NT$21.6bn +3.7% +56.2% NT$127.0bn +11.9%
Wan Hai NT$19.2bn +3.0% +65.6% NT$114.4bn +19.2%

Will all three carriers post at least 10% YoY revenue growth for 9M 2026?

Yes
0.00%
No
0.00%
0 Polls

Evergreen Marine

Evergreen reported August revenue of NT$49.0bn ($1.52bn), up 48.6% YoY and 1.9% MoM.

Revenue for the first eight months reached NT$288.7bn ($9.1bn), increasing 9.8% YoY.

Evergreen Marine Monthly Operating Revenue

Evergreen currently operates 242 vessels with total capacity of approximately 2.02mn TEU, including 169 owned vessels and 73 chartered vessels. Its orderbook includes 76 vessels totaling around 868,000 TEU.

Yang Ming Marine Transport

Yang Ming reported August revenue of NT$21.6bn ($670mn), up 56.2% YoY and 3.7% MoM.

Revenue for January-August reached NT$127.0bn ($4.0bn), representing 11.9% YoY growth.

Yang Ming Marine Transport Monthly Operating Revenue

The carrier operates 98 vessels with total capacity of approximately 756,000 TEU. Its current orderbook consists of 21 vessels totaling around 272,000 TEU.

Wan Hai Lines

Wan Hai generated NT$19.2bn ($600mn) in August revenue, increasing 65.6% YoY and 3.0% MoM.

Eight-month revenue reached NT$114.4bn ($3.6bn), up 19.2% YoY, the fastest growth among the three carriers.

Wan Hai Lines Monthly Operating Revenue

Wan Hai operates 124 vessels with total capacity of approximately 624,000 TEU, while its orderbook includes 49 vessels totaling around 504,000 TEU.

Capacity Snapshot

Fleet Capacity and Orderbook

Current deployed capacity versus newbuilding orderbook.

Current Fleet
Orderbook
2.2 1.65 1.10 0.55 0
2.023
0.868
Evergreen
0.756
0.272
Yang Ming
0.624
0.504
Wan Hai
mn TEU

Evergreen remains the largest of the three by both revenue and deployed capacity. Wan Hai, meanwhile, recorded the strongest year-to-date revenue growth and also has the largest orderbook relative to its existing fleet.

Source:

  1. Company press release - https://emops.twse.com.tw/server-java/t58query#37
Kalshi Commodities Hit $400mn Monthly Volume, as It Files for WTI Perpetual Futures
News
Prediction MarketCommodity

Kalshi Commodities Hit $400mn Monthly Volume, as It Files for WTI Perpetual Futures

Kalshi’s commodities trading volume has topped $400mn a month, more than four times crypto’s pace at the same stage, as the platform files for WTI perpetual futures and expands further into regulated derivatives.

Economics & Finance

TL;DR

  • Kalshi says monthly commodities trading volume has surpassed $400 million, seven months after launch.
  • Commodity volume is more than four times what crypto reached at the same stage on the platform.
  • Kalshi has also filed for WTI crude oil perpetual futures, extending its push beyond prediction markets.

Will Kalshi’s WTI perpetual futures be approved by the CFTC before the end of 2026?

Yes
0.00%
No
0.00%
0 Polls

Kalshi’s Commodity Trading Business Surpasses $400mn

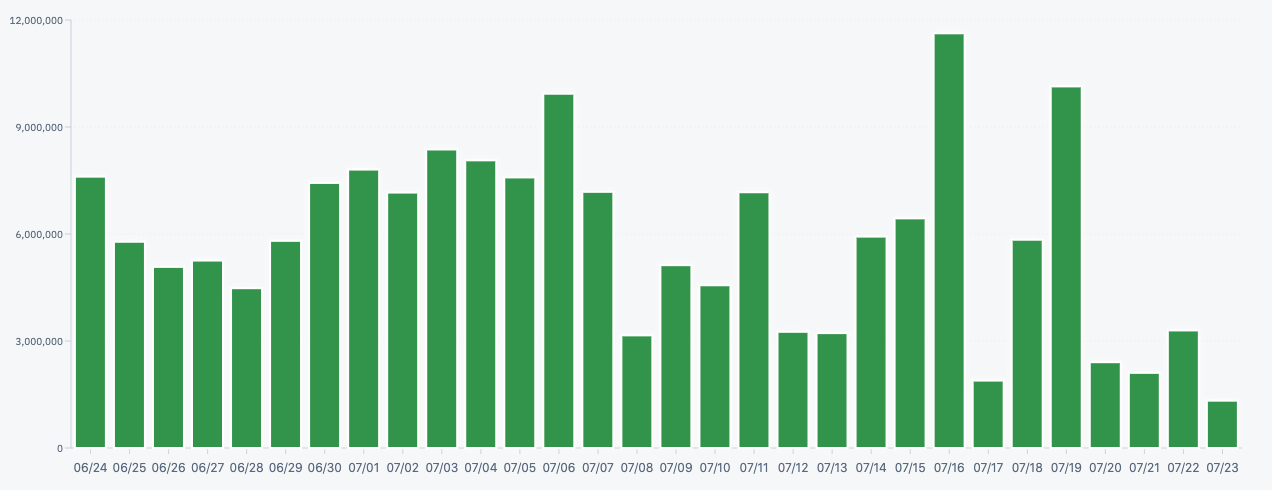
Kalshi said its commodities trading business has surpassed $400 million in monthly volume, only seven months after launch.

The company said commodity trading volume at this stage is more than four times what cryptocurrency trading had reached over the same period. Its commodity prediction markets currently cover products including oil, natural gas and metals.

Kalshi Commodities Trading Volumn. Source: Dune

Co-founder Tarek Mansour said stronger liquidity has helped drive the growth. A larger pool of active participants makes it easier for users to enter and exit positions and allows Kalshi to launch new categories more quickly.

The company also said its trading volumes from the 2026 FIFA World Cup partnership came in well above its earlier expectations.

Kalshi Files for WTI Perpetual Futures

Kalshi is also expanding into perpetual futures across traditional asset classes. Reuters reported that the company has filed for products tied to equity indexes, metals and WTI crude oil.

WTI already has a large and mature futures market, so Kalshi is not introducing the first WTI derivative. The difference is that a perpetual future has no fixed expiry date, allowing traders to maintain continuous exposure through a single contract.

If approved, Kalshi’s WTI product would be the first perpetual oil futures product on a regulated U.S. platform.

Perpetual futures became popular in crypto but are increasingly being applied to traditional assets. Kalshi’s filings suggest it is trying to bring that structure into the U.S. regulated derivatives market, alongside its existing prediction-market business.

Source:

  1. Reuters - https://www.reuters.com/business/kalshis-400-million-plus-monthly-commodity-trade-volume-outpaces-early-crypto-2026-09-08
  2. Reuters - https://www.reuters.com/business/energy/prediction-market-kalshi-file-us-crude-oil-perps-source-says-2026-09-02
Silicon Bakery - Amazon Links $60bn Qualcomm Chip Orders to Equity, OpenAI Deepens Samsung Ties and Reaches Tape-Out in Nine Months
News
AIAI InfrastructureSemiconductorMag 7Silicon BakeryIndustry PulseData CenterHyperscalers

Silicon Bakery - Amazon Links $60bn Qualcomm Chip Orders to Equity, OpenAI Deepens Samsung Ties and Reaches Tape-Out in Nine Months

Amazon could buy up to $60bn of Qualcomm AI data-center products under a deal that ties chip procurement to equity warrants, while OpenAI deepens its Samsung chip partnership and says Jalapeno reached tape-out in just nine months.

Economics & Finance

TL;DR

  • Amazon could buy up to $60bn of Qualcomm AI data-center products, while receiving warrants to purchase up to 25 million Qualcomm shares as procurement milestones are met.
  • OpenAI says it is working with Samsung on joint production and research of next-generation chips, expanding the relationship beyond memory supply.
  • OpenAI also says its own AI models helped take its first custom chip, Jalapeno, to tape-out in just nine months.

Will Qualcomm announce another hyperscaler AI chip customer before the end of 2026?

Yes
0.00%
No
0.00%
0 Polls

Amazon Gives Qualcomm a $60bn Opening in AI Silicon

Qualcomm has signed a long-term agreement under which Amazon could purchase up to $60bn of its AI data-center chips and related products, marking one of the chipmaker’s biggest moves beyond smartphones.

The partnership covers AI inference chips, optical connectivity reaching 1.6 Tbps, and future-generation technologies. Amazon will also receive warrants allowing it to purchase up to 25 million Qualcomm shares, with vesting linked to procurement progress.

The structure resembles Marvell’s recent deal with Google, where a hyperscaler combines long-term purchasing commitments with equity-linked incentives.

Read more: Marvell’s AI chip deal with Google

Marvell gives Google option to buy $12.2 billion stake in custom AI chip deal
Google is expanding its custom AI chip partnership with Marvell Technology in a deal that could generate up to $120 billion in revenue for Marvell through fiscal 2033.

What matters

  • The $60bn is a purchase-linked threshold, not guaranteed Qualcomm revenue. It covers chips, connectivity, systems and manufacturing services.
  • The warrants tie Amazon’s potential equity upside to the scale of its purchases, while introducing possible dilution for Qualcomm shareholders.
  • Qualcomm is competing on more than accelerator performance: the deal spans compute, connectivity and future chip generations.
  • The main financial question is profitability. Qualcomm has said early custom-chip business could reduce chip-segment gross margin by 1.5–2 percentage points, while still adding to operating profit.

OpenAI Moves Deeper Into Custom Silicon

OpenAI is also expanding its role in the semiconductor stack.

OpenAI Korea head Harrison Kim said the company is working with Samsung on “joint production and research” of next-generation chips. The new point is not that OpenAI is developing its own silicon—that was already known—but that Samsung’s role may now extend beyond the previously disclosed memory relationship.

OpenAI’s first custom chip, Jalapeno, was designed with Broadcom for AI inference and is set to be manufactured by TSMC. Samsung and SK Hynix had already agreed to supply memory for the Stargate project.

The exact scope of Samsung’s new role remains unclear. OpenAI has not specified whether it involves foundry manufacturing, HBM, advanced packaging, co-design or another part of the chip-development process.

At the same time, CFO Sarah Friar said OpenAI used its own AI models while developing Jalapeno and reached tape-out in nine months. Tape-out is the stage when a chip design is finalized and sent for manufacturing.

The broader shift is becoming clearer: AI companies are moving deeper into chip design and supply-chain development, while also using AI itself to shorten parts of the semiconductor design cycle.

Source:

  1. Reuters - https://www.reuters.com/technology/qualcomm-amazon-develop-custom-chips-ai-data-centers-2026-09-08/
  2. Reuters - https://www.reuters.com/world/asia-pacific/openai-says-working-with-samsung-next-generation-chips-deepening-cooperation-2026-09-09
  3. Reuters - https://www.reuters.com/world/china/openai-offers-ai-chip-design-touts-cost-advantage-over-open-source-cfo-says-2026-09-09
HYROX Founders Retake Control in Deal Backed by L Catterton
News
Consumer DiscretionaryPrivate EquitySports InsightM&A

HYROX Founders Retake Control in Deal Backed by L Catterton

HYROX’s founders have regained majority control of the fast-growing fitness racing brand after a consortium led by L Catterton acquired the majority stake held by Infront Sports & Media.

Economics & Finance

HYROX’s founders have regained majority control of the fast-growing fitness racing brand after a consortium led by L Catterton acquired the majority stake held by Infront Sports & Media.

Infront said on Sept. 8 that it had completed the sale of its stake to the consortium, which also includes HYROX co-founders Christian Toetzke and Moritz Fürste and Silicon Valley investment firm WndrCo.

The financial terms were not disclosed. Media reports have valued HYROX at around €600 million, or roughly $700 million.

Founders Take Back Control

HYROX was founded in Germany in 2017 by Toetzke and Fürste. Its race format combines eight one-kilometre runs with eight functional workout stations, using the same structure across events globally.

Source: HYROX

Infront first invested in HYROX in 2019 and became its majority shareholder in 2022, backing the company through a period of rapid international expansion.

Infront itself is part of Dalian Wanda Group’s sports portfolio. Wanda acquired a majority stake in the Switzerland-based sports marketing company in 2015 for about €1.05 billion, before combining it with other sports assets under Wanda Sports.

Wanda remains Infront’s majority shareholder. Earlier this year, the two companies completed a strategic review of Infront and said the existing ownership structure would remain in place.

The HYROX transaction therefore marks the end of the period in which the company was controlled through Wanda-owned Infront, with majority control now returning to its German founders.

HYROX has grown sharply during Infront’s ownership. In the 2025/26 season, it staged more than 100 events across over 30 countries, attracting more than 1.4 million participants and 1.5 million spectators. That compares with around 80,000 participants in the 2022/23 season.

Infront CEO Philippe Blatter said the company decided to sell following a strategic review and viewed the new ownership structure as well suited to HYROX’s next stage of growth.

L Catterton and WndrCo Join the Shareholder Group

The deal also brings in two investors with backgrounds outside traditional sports event ownership.

L Catterton, one of the world’s largest consumer-focused investment firms, manages around $40 billion in capital and counts LVMH among its shareholders.

The firm has invested extensively in fitness and consumer brands, including Equinox, Peloton, Hydrow and Solidcore.

WndrCo was founded by Jeffrey Katzenberg and Sujay Jaswa. Katzenberg previously chaired Walt Disney Studios and later co-founded DreamWorks.

For L Catterton, HYROX sits at the intersection of sports participation and consumer branding. The business has expanded beyond race entry fees into training partnerships, affiliated gyms, sponsorships and related products.

Olympics and Further Expansion

HYROX’s management has already outlined several priorities under the new ownership structure.

Toetzke said the company plans to focus on bringing hybrid racing closer to Olympic recognition, expanding participation and investing in new products and services.

Will we see HYROX in the Olympics in Brisbane, Australia in 2032?

Yes
100.00%
No
0.00%
1 Polls

Fürste has previously said he would like to see HYROX become part of the Summer Olympics within the next decade.

Less than a decade after holding its first event in Hamburg, HYROX has developed from a German fitness race into a global mass-participation sports brand.

The main change from the transaction is therefore not simply the arrival of another private-capital investor. The founders are back in majority control, while L Catterton brings experience in scaling global consumer brands.

After years of rapid event expansion, HYROX’s next phase will increasingly depend on whether it can turn hybrid racing into a broader global sports category — and build a larger commercial ecosystem around it.

Aviation Rader - GE Aerospace’s $11.75bn CPP Deal Targets a Critical Engine Bottleneck; Airbus Deliveries Rise 9% y/y
News
AerospaceSupply ChainM&AIndustrialsIndustry PulseAviation Radar

Aviation Rader - GE Aerospace’s $11.75bn CPP Deal Targets a Critical Engine Bottleneck; Airbus Deliveries Rise 9% y/y

GE Aerospace is moving to secure critical engine-casting capacity with its $11.75bn acquisition of CPP, while Airbus deliveries rose 9% in the first eight months of 2026 as it works toward its full-year target.

Economics & Finance

TL;DR

  • GE Aerospace will acquire CPP for $11.75bn, bringing a key engine-castings supplier in-house.
  • CPP supplies LEAP and GEnx engines; about 70% of revenue comes from commercial and defense engines.
  • Airbus delivered 475 aircraft in the first eight months of 2026, up 9% y/y, and remains broadly on track for its full-year target 870.

Do you think Airbus will deliver more than 870 aircraft in total in 2026?

Yes
0.00%
No
0.00%
0 Polls

GE Moves to Secure Engine-Casting Capacity

GE Aerospace agreed to buy Consolidated Precision Products (CPP) for $11.75bn, its largest acquisition since becoming a standalone company in 2024. The deal is expected to close in the second half of 2027.

CPP is one of the world’s largest precision-castings suppliers and produces parts for LEAP, GEnx and most major current-generation aircraft programs. GE expects CPP to generate about $2bn in 2027 revenue.

GE expects its airfoil demand to rise more than 30% by 2030 versus 2026, as suppliers simultaneously support new-engine production and aftermarket demand.

GE plans to raise CPP output through better factory yields, higher machine utilization and lower scrap. Bringing airfoil design and manufacturing closer together could also shorten development cycles for new engine technologies.

The deal also matters for competitors: CPP supplies other engine makers, including RTX’s Pratt & Whitney. Howmet Aerospace, a major rival in aerospace castings, fell about 8% after the announcement.

The broader signal is that aerospace manufacturers are increasingly treating supply-chain capacity as a strategic asset. With aircraft demand already extending years into the future, securing enough engines may depend less on order books than on controlling the specialized manufacturing capacity behind them.

Airbus Deliveries Rise 9%

Airbus delivered 475 aircraft between January and August 2026, up from 434 in the same period last year. August deliveries totaled 57 aircraft.

The company is targeting 870 deliveries for the full year, compared with 793 in 2025.

Deliveries of the A320 family rose 11%, while A330 deliveries fell 31% to 11 aircraft.

A330 deliveries resumed in August with one handover after being suspended in June and July following the discovery of a lost tool in an A330 tail section.

Airbus also sold 67 aircraft in August, including eight A350F freighters to an undisclosed customer. Year-to-date gross orders reached 1,157 aircraft, or 1,091 net of cancellations.

Source:

  1. Reuters - https://www.reuters.com/legal/transactional/ge-aerospace-buy-castings-maker-cpp-nearly-12-billion-2026-09-08
  2. Reuters - https://www.reuters.com/business/aerospace-defense/airbus-aircraft-deliveries-end-august-rose-9-2026-09-07/
Latest on Hapag-Lloyd’s ZIM Acquisition: Revised Deal Seeks Israeli Approval
News
MaritimeM&AContainer Shipping

Latest on Hapag-Lloyd’s ZIM Acquisition: Revised Deal Seeks Israeli Approval

Hapag-Lloyd is revising its $4.2bn acquisition of ZIM to address Israeli security concerns, with tighter foreign ownership limits and strategic assets set to remain under Israeli control.

Economics & Finance

TL;DR

  • Hapag-Lloyd is revising its $4.2bn cash acquisition of ZIM to address Israeli national-security concerns.
  • The revised structure would cut the foreign ownership threshold requiring government approval from 24% to 10%, while strategic assets would be carved out into a locally controlled ZIM Israel.
  • The deal now hinges less on valuation than on whether Israel retains sufficient control over critical shipping capacity and sensitive cargo.

Will Hapag-Lloyd complete its acquisition of ZIM by the end of 2026?

Yes
0.00%
No
0.00%
0 Polls

Hapag-Lloyd is revising the structure of its proposed $4.2 billion cash acquisition of ZIM Integrated Shipping Services, as the German carrier seeks to overcome Israeli concerns over national security and control of strategic shipping assets.

Following several rounds of talks with Israeli officials, Hapag-Lloyd and Israeli private equity firm FIMI are preparing an amended proposal designed to preserve Israel’s maritime independence and access to key trade routes, including connections with Asia.

A central concession involves Israel’s “golden share” in ZIM. Under the current arrangement, a foreign investor can hold up to 24% of the carrier without prior government approval. Hapag-Lloyd has proposed reducing that threshold to 10%, giving the Israeli government tighter oversight over future foreign ownership.

The deal would also carve out a strategically important part of ZIM’s operations. FIMI plans to acquire a business containing 16 vessels through a new company, ZIM Israel, which would maintain Israel’s direct maritime links with global markets. FIMI has also committed not to list ZIM Israel outside the Israeli stock market.

The acquisition would further strengthen Hapag-Lloyd’s position in the global container shipping market. According to the latest Alphaliner data, Hapag-Lloyd currently ranks fifth globally, operating 287 containerships with around 2.4mn TEU of capacity, alongside an orderbook of 64 vessels totaling roughly 499,000 TEU.

Hapag-Lloyd still aims to complete the acquisition by the end of 2026, but the decisive question is now whether it can integrate ZIM commercially while leaving Israel with effective control over the shipping assets it considers strategic.

Read more: : Inside Hapag-Lloyd’s latest results

Results Deep Dive - Hapag-Lloyd Returns to Profit in Q2 and Raises 2026 Outlook
Hapag-Lloyd’s H1 2026 results were mixed. The company returned to profit in Q2 as stronger demand and spot freight rates lifted transport volumes and average pricing, producing a clear recovery from a loss-making Q1.

Source:

  1. Reuters - https://www.reuters.com/world/middle-east/hapag-lloyd-plans-improvements-42-billion-bid-israels-zim-2026-09-07
Energy Matrix - More Crude Does Not Mean More Fuel
Analysis
EnergyEnergy MatrixCommoditySupply ChainTanker ShippingOil & Gas

Energy Matrix - More Crude Does Not Mean More Fuel

Crude supply alone no longer explainss whether the market has enough fuel. Refinery configuration, product inventories and shipping costs increasingly determine which fuels are available, where they can be delivered—and at what price.

Economics & Finance

For much of the modern oil era, the market’s main concern was whether producers could supply enough crude. That question still matters, particularly during the severe Middle Eastern disruptions of 2026.

But recent events have exposed another constraint: even when crude is available, the refining system may not be able to produce enough of the fuels consumers need, in the right specifications and in the right places.

Data source: U.S. Energy Information Administration, Gasoline and Diesel Fuel Update; Bloomberg L.P.

The refining margins climbed to record highs as diesel, jet-fuel and gasoline cracks surged.

What are crack spreads?

Crack spreads are indicators of the profitability of refining crude oil into petroleum products such as gasoline and diesel. One common crack spread is calculated by subtracting the spot market price of a gallon of crude oil from the wholesale price of a gallon of refined product.

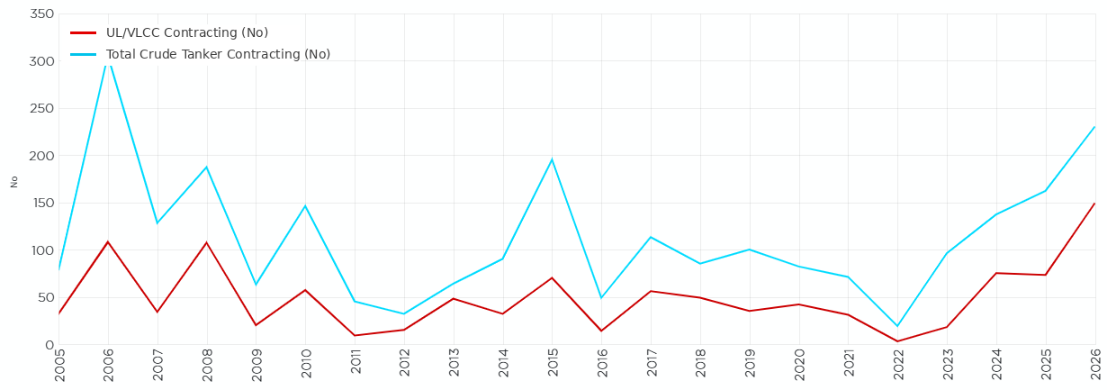
The pressure has now spread to fuel oil, traditionally one of the least valuable parts of the barrel. The global market could face adeficit of 218,000 bpd in Q3 2026, compared with only 6,000 b/d a year earlier. Stocks in Singapore, Fujairah and the Amsterdam-Rotterdam-Antwerp hub were already about 30% below three-year seasonal averages. Singapore VLSFO had risen 76% since the Iran war began, versus a 40% increase in Brent.

Source: Clarkson

The contrast with crude is striking. Global oil supply recovered by 2.4 million b/d in July to 101.5 million b/d, while refinery throughput remained nearly 5 million b/d below the previous year at 80.9 million b/d.

This is the crude-product disconnect: more crude does not automatically mean more usable fuel.

Which factor will determine whether today’s high refining margins can last?

Product inventories
0.00%
Capacity growth
0.00%
Shipping conditions
0.00%
0 Polls

Refiners Are Optimising the Barrel

High crack spreads give refiners a strong incentive to change how they use each barrel. The decision is no longer simply whether to increase crude throughput. Refiners must also decide which units to run, which intermediate feedstocks to process and which products to maximise.

When diesel and jet-fuel cracks rise, a complex refinery can increase the use of hydrocrackers and other secondary units. Fuel oil, vacuum gas oil and residual streams that might otherwise be sold can instead be processed into higher-value transport fuels.

Source: Valero

In June 2026, distillate fuel accounted for 29.6% of US refinery yield and jet fuel for 12.4%, while residual fuel oil accounted for only 1.7%.

Global capacity figures can therefore be misleading. OPEC estimates that refining capacity reached 103.66 million b/d in 2025, against throughput of 86.89 million b/d. The apparent gap of almost 17 million b/d is not interchangeable spare capacity. Some plants are offline; others can process crude but lack the hydrocrackers, cokers or desulphurisation units needed to maximise scarce products.

What matters is not simply how much crude a refinery can process, but what it can turn that crude into.

Refining Is Moving Away From Consumption

The current shock has exposed a longer-term geographical shift. Europe has lost 28 refineries larger than 30,000 b/d through closures or conversions since 2009, while newer, more complex plants have been built in the Middle East, India, China and Africa.

The IEA expects 4.2 million b/d of new capacity between 2024 and 2030, partly offset by 1.6 million b/d of closures. Most additions are in Asia and the Middle East; the Middle East alone is projected to add 860,000 b/d to global product supply.

Refinery expansion and closures and demand growth, 2024-2030. Source: IEA

China is an important but policy-constrained source of flexible supply. Its seaborne crude imports in August 2026 remained almost 40% below their pre-war average, yet light- and middle-distillate exports rose to 963,000 b/d, from 774,000 b/d in July. Refiners could use earlier crude purchases and inventories, while weak domestic demand and high overseas prices encouraged exports. Licences, taxation and energy-security policy still determined how much supply was released.

Fuel oil is therefore caught between lower external supply, greater internal refinery consumption and stronger shipping demand. Its outperformance relative to Brent represents a distinct product-scarcity premium.

Shipping Amplifies the Shortage

Refining’s geographical shift increases shipping demand even without higher consumption. In 2024, global seaborne refined-product volumes fell by 0.7%, but tonne-miles rose by 6.5%. Less product was transported, yet each tonne travelled farther because of refinery closures and Red Sea diversions.

A closed European refinery does not necessarily remove European diesel demand. It may simply replace a local barrel with one shipped from India, the Middle East or the United States.

Longer voyages then feed back into fuel oil. Red Sea diversions and higher sailing speeds added an estimated 800,000–1 million tonnes per month to global bunker demand.

Shipping is therefore not merely the final delivery stage. It determines whether a regional surplus can become usable supply elsewhere—and the fuel consumed in making that connection can deepen the shortage.

The abnormal rise in fuel-oil prices captures the wider change. The market is pricing not only crude scarcity, but also lost product exports, limited conversion capacity and the rising cost of connecting regional markets.

Source:

  1. eia; https://www.eia.gov/todayinenergy/detail.php?id=68104
  2. Reuters; https://www.reuters.com/business/energy/ship-fuel-shortage-looms-refiners-strained-by-war-favour-other-products-2026-09-07
China Injects $45 Billion Into Banks and Insurers to Shore Up Capital
News
BankingCapital MarketsFiscal Policy

China Injects $45 Billion Into Banks and Insurers to Shore Up Capital

China is injecting RMB300 billion ($45 billion) into major banks and insurers in its largest financial-sector recapitalization in nearly two decades, aiming to strengthen balance sheets and sustain lending as economic growth slows.

Economics & Finance

China is injecting RMB300 billion ($45 billion) into major banks and insurers in its largest financial-sector recapitalization in nearly two decades, aiming to strengthen balance sheets and sustain lending as economic growth slows.

The Ministry of Finance (MOF) will issue special government bonds to recapitalize eight financial institutions, including Industrial & Commercial Bank of China Ltd. (ICBC), Agricultural Bank of China Ltd. (AgBank) and People’s Insurance Company (Group) of China Ltd., according to official announcements on Sunday.

AgBank plans to raise up to RMB160 billion through a private placement, while ICBC is targeting RMB100 billion. Both banks said the proceeds will be used entirely to replenish core Tier 1 capital. The MOF will subscribe to RMB130 billion of AgBank’s offering and RMB70 billion of ICBC’s, with China National Tobacco Corp. also participating as a major investor.

The move comes as profitability pressures make it harder for banks to build capital organically. The sector’s average net interest margin has fallen to historic lows, constraining capital accumulation through retained earnings. As of June, Chinese banks reported an average capital adequacy ratio of 15.26% and a core Tier 1 capital ratio of 10.72%.

The recapitalization also supports China’s six largest state-owned banks as they prepare for the second phase of global Total Loss-Absorbing Capacity (TLAC) requirements. Several of the lenders, particularly the Big Five, are designated global systemically important banks and therefore face additional loss-absorbing capacity requirements.

Financial Institution Raising Capital MOF Contribution
Agricultural Bank of China 160 130
China Exim Bank 30 30
China Export & Credit Insurance 10 10
China Life Insurance 35 35
China Reinsurance 3 3
China Taiping Insurance 7 7
ICBC 100 70
PICC 15 15
Total 360 300
Note: RMB bn. Source: Shanghai Stock Exchange, Xinhua News Agency

Insurers are facing similar balance-sheet pressures. A prolonged low-interest-rate environment has reduced investment returns and increased the risk of a mismatch between asset yields and liability costs. Regulators have previously said they were studying measures to strengthen capital positions at major insurers.

Last week, the National Financial Regulatory Administration also published draft amendments to the Insurance Law, including tighter oversight of insurers’ shareholders. The proposed changes would mark the first major revision of the law since 1995.

For Beijing, the broader objective is to support economic activity without weakening financial stability. Stronger capital buffers give banks and insurers greater capacity to absorb losses linked to the property downturn, local-government debt and weak household demand, while allowing banks to continue extending credit to the economy.

According to Bloomberg Intelligence, ICBC and AgBank could face annualized EPS dilution of about 3.5% and 6.3%, respectively, from their planned RMB100 billion and RMB160 billion core Tier 1 capital raises.

Source:

  1. Bloomberg; https://www.bloomberg.com/news/articles/2026-09-06/agbank-icbc-plan-private-placements-totaling-up-to-260b-yuan-mtpk2qgx
Will Örebropartiet Enter the Swedish Parliament in 2026?
Analysis
Election

Will Örebropartiet Enter the Swedish Parliament in 2026?

A 12% Local Breakthrough, or an Impossible Conversion from Local Support to a National Vote?

PoliticsEconomics & Finance

Örebropartiet (ÖP) is a local political party in Örebro, Sweden, led by Markus Allard. Historically, it has focused primarily on municipal and regional politics rather than national politics. In late 2025, ÖP announced that it would contest Sweden's 2026 parliamentary election for the first time. The election will be held on September 13.

Örebropartiet's biggest opportunity comes from a special feature of Sweden's electoral system: a party does not need to win 4% of the national vote to enter parliament if it can instead secure 12% of the vote in a single constituency. Örebro County happens to be one such constituency.

In late August, a Novus poll brought market attention to ÖP. The survey showed Örebropartiet polling at 15.1% in the Örebro County regional election, with a sample size of 1,088. If that figure translated directly into the Riksdag election, ÖP would win a parliamentary seat and make history.

The problem is that Swedish voters do not cast just one ballot. They vote separately in:

  1. Municipal elections
  2. Regional elections
  3. Riksdag elections

A voter can therefore support different parties in different elections to express different preferences on local and national politics. The 12% threshold applies to the Riksdag election, not to the regional election measured in the Novus poll, so the two cannot be directly converted.

Now Infostat has provided data that are much closer to the actual underlying of the prediction market. It directly asked voters in Örebro County, "If a parliamentary election were held today, which party would you vote for?". A total of 1,136 people participated in the survey, with data collection continuing through September 3.

Metric Support
ÖP regional election, Novus 15.10%
Riksdag “other parties”, Infostat 6.30%
Infostat estimate for ÖP Slightly below 6%
Required in the Riksdag 12.00%

Even under the most favorable interpretation for Örebropartiet, if we assign the entire 6.3% "other parties" vote to ÖP, it would still be 5.7% short of the 12% threshold. In other words, with only 9 days remaining, its Riksdag support would need to increase by roughly 90%. If we instead use Infostat's estimate that ÖP itself is polling at slightly below 6%, the required increase would exceed 100%.

Infostat reported an uncertainty interval of ±1.53% around the 6.3% support for "other parties". Even if we move the entire uncertainty range in ÖP's favor, 6.3% + 1.53% = 7.83%, leaving the party still more than 4% short of 12%.

For a Yes outcome to occur, Örebropartiet would therefore need a very large final-week surge that has not yet appeared in parliamentary voting-intention polls.

If someone reads the methodology behind the Infostat survey, they might raise a reasonable objection: Infostat began collecting data in June, so the poll may underestimate the surge in media attention Örebropartiet has received over the past several days.

However, the timing of the interviews weakens this argument. Infostat states that three-quarters of the interviews were conducted after August 24, meaning that the overwhelming majority of responses were collected very close to the current electoral environment. When Infostat split the sample into earlier and later periods, support for "other parties" rose only from 5.5% to 6.6%. Infostat explicitly noted that this change remained entirely within the margin of statistical uncertainty and did not provide evidence of a clear late surge.

The 15.1% regional poll therefore demonstrates that Örebropartiet has a large pool of potential supporters. But the latest Riksdag poll suggests that many voters who are willing to support ÖP in local elections are still not prepared to give the party their national ballot.

To convert 15.1% regional support into the 12% Riksdag support required to enter parliament, ÖP would need to retain 12% / 15.1% = 79.5% of its local support on the national ballot.

If ÖP's current Riksdag support is around 6% while its regional support is around 15.1%, the orders of magnitude implied by these two separate surveys suggest that its national-ballot support is currently only around 40% of its regional support. Because the surveys use different methodologies and samples, this should not be treated as a precise voter-conversion estimate. But it is sufficient to show that the gap is substantial.

To enter parliament, ÖP would have to close almost all of that gap in roughly one week.

Why Can Local Support Be So High While Parliamentary Support Is So Low?

Örebropartiet is, first and foremost, a successful local political party. It has a clear brand in local politics, and voters can support Markus Allard with their regional or municipal ballot while reserving the more consequential Riksdag ballot for a national party.

This is exactly how Infostat's Peter Santesson interprets the survey results. In local elections, voters are more willing to support smaller parties as a way of expressing a political preference or sending a signal. In parliamentary elections, where government formation is at stake and voters face the risk of "wasting" their vote, their willingness to experiment falls significantly.

The latest nationwide Demoskop poll puts the centre-left bloc at 50.6% and the ruling right-wing coalition at 47.3%, a gap of only 3.3%. At the same time, the Liberals are polling at just 2.8%, below the national 4% Riksdag threshold, which further increases the importance of tactical voting and concerns about wasted votes.

Source: Reuters

For a voter who likes Örebropartiet locally but also cares deeply about which bloc forms Sweden's next government, voting for ÖP in the regional election while supporting another party in the Riksdag election is reasonable. That is precisely how a 15.1% regional figure and a sub-6% parliamentary figure can coexist.

A breakthrough coordination surge that carries ÖP into parliament is not impossible. The party already has a local support base of roughly 15.1%, media coverage of the 12% rule has only recently intensified, and the growing perception that "my vote may no longer be wasted" could itself encourage more supporters to cast their Riksdag ballot for ÖP.

But moving from roughly 6% national-ballot support to 12% in just 9 days would require an exceptionally strong political mobilization, and the latest data do not yet show that such a surge is underway. For that reason, the Yes price of 25c on Polymarket may be too high.

Disclaimer: The content is for informational purposes only. You should not construe any such information or other material as legal, tax, investment, financial, or other advice. Nothing contained in this article constitutes a solicitation, recommendation, endorsement, or offer by the author(s) or any third party service provider to buy or sell any securities or other financial instruments in your or in any other jurisdiction in which such solicitation or offer would be unlawful under the securities laws of such jurisdiction. The author(s) report(s) no conflict of interest.

The AI Boom Is Widening America’s Trade Deficit. Is It Also Nuking GDP?
Analysis
AIMacro & Micro CompassTechnologyIndicatorsConsumer Spending

The AI Boom Is Widening America’s Trade Deficit. Is It Also Nuking GDP?

AI investment is booming, yet the latest U.S. trade numbers reveal a cost investors may be underestimating.

Economics & FinanceTech

America’s AI infrastructure binge is printing exactly where the street least expected it: the trade deficit.

The U.S. goods-and-services deficit spiked 24.4% in July to $88.6 billion. Imports rose while exports fell, so this was hardly an AI-only issue.

But under the hood, capital-goods imports increased by $14.4 billion, stacking $6.9 billion in computers, $6.6 billion in computer accessories and $1.2 billion in semiconductors. These three tech buckets alone tacked on $14.7 billion from June, albeit the overall category rose only $14.4 billion because other categories declined.

Source: BEA

None of these categories is an AI-only measure. They also include ordinary enterprise, consumer and industrial equipment, and the July values are nominal rather than price-adjusted. Still, the concentration of the increase in computers, accessories and semiconductors is consistent with—not proof of—the AI infrastructure buildout showing up in the trade data.

U.S. companies are pouring money into data centers, accelerators, servers and networking gear. And a big chunk of the physical kit still comes from abroad.

This tees up a wonky macro setup: the same AI spending juicing U.S. investment can also make the trade numbers look worse.

What do you think is the biggest risk in the U.S. AI buildout?

Too much reliance on imported hardware
0.00%
Capex outruns the productivity payoff
100.00%
Power and grid constraints
0.00%
I don’t see a major macro risk yet
0.00%
1 Polls

The AI boom can lift investment and drag on GDP at the same time

Imports subtract from GDP, but that does not mean importing a $1 million AI server mechanically makes the economy $1 million smaller. The server also shows up as a business investment on the other side of the ledger. The import subtraction is there to strip out the portion that was produced overseas rather than in the U.S.

So the relevant question is not whether an imported server is “bad for GDP.” Its foreign-produced value is excluded by design. The GDP question is how much domestic value—construction, power infrastructure, installation, software and related services—the broader buildout generates alongside the imported equipment.

Right now, the answer looks like yes, but with a pretty chunky haircut from trade.

After the July trade report, the Atlanta Fed’s GDPNow model put third-quarter real GDP growth at 4.7% annualized. At the same time, it estimated real private domestic investment growing 20.8%, while net exports were knocking 1.46 percentage points off GDP growth.

Put simply, investment is ripping, but trade is leaning the other way.

The Fed has also tried to isolate this more directly. Its rough proxy for the AI buildout shows software, data centers, power facilities and computer equipment adding about 1.18 percentage points to annualized GDP growth in Q1 2026. Computer-related net exports took back 0.45 points, leaving a net contribution of roughly 0.73 points. In Q4 2025, the import drag almost wiped out the entire gross contribution.

My take is that saying AI is “nuking GDP” goes a bit too far. The better read is that imported hardware is diluting how much of the AI capex boom turns into current U.S. GDP.

AI Speedrun - AI Propped Up the Global Economy. Can It Keep Doing So?
AI investment helped cushion global growth, but with hyperscaler capex nearing $725 billion, can demand and productivity justify the cost?

The U.S. is buying the hardware before it gets the payoff

This trade deficit looks different from one driven by imported TVs or sneakers. This AI gear is supposed to produce something.

Private U.S. data-center construction was blazing at a $75.2 billion annualized pace in July, gapping up from $44.7 billion at the end of 2024.

Investment in computers and peripheral equipment has gone from about $186 billion annualized in Q4 2024 to a massive $401 billion in Q2 2026.

Source: FRED

The numbers get bigger and bigger and they tell us the U.S. isn’t simply consuming foreign technology; rather, it is installing foreign-made components inside a rapidly expanding domestic computing base.

The bull case is pretty simple because a GPU fabricated in Asia and plugged into a Virginia server farm weighs on net exports today, but it may support U.S.-based cloud revenue, software, research and productivity for years.

The better question is duration. The Federal Reserve staff find AI-exposed industries are showing some stronger productivity readings, but there still isn’t a clear economy-wide break from historical trends. In other words, the capex is here and is printing, but the broad productivity dividend is still more promise than print.

That’s what I care about as an investor. If spending keeps compounding while measurable productivity eventually catches up, today’s import bill looks like the upfront cost of building a much more productive economy.

If the productivity payoff stays elusive, the same capex starts looking a lot harder to justify.

“Made in America” still has a long way to go

The other takeaway from the trade numbers is just how global the supposedly American AI boom still is.

The U.S. cornered less than 10% of global semiconductor manufacturing capacity in 2024, a brutal bleed down from 37% in 1990, according to the Commerce Department. Taiwanese players have since penciled in at least $250 billion in commitments for U.S. semi, energy, and AI capacity, but getting a fab fully online and scaling yields is a multi-year grind.

You can see the exact same supply-chain leverage on the server side.

Mexico’s trade data show a regional production hub embedded in an Asian supply chain: the country exported $82.9 billion of servers in the first half of 2026 while importing $28.4 billion of servers from Taiwan. The U.S. absorbed 93.9% of Mexico’s server exports over the 12 months through June.

Source: SPGlobal

These gross trade figures do not reveal how much value Mexico added or how much of the U.S. import price reflects components produced elsewhere. What they do show is that near-shoring can change the final shipping route more quickly than it eliminates foreign content.

Nearshoring helps, but it doesn’t magically turn imports into domestic production.

Here’s what traders should watch next

The next trade report lands on October 6. I’d watch the same three buckets, computers, accessories and semiconductors, before getting too excited about one month’s spike. If they stay elevated, the AI capex cycle is clearly bleeding into the trade account rather than just creating July noise.

Then watch the net-export contribution in GDPNow, currently at -1.46 points, against investment growth. Watch whether GDPNow continues to show rapid aggregate investment growth alongside a worsening net-export contribution. The two measures are not directly comparable, but together they indicate whether domestic demand remains strong while more of that demand leaks into imports.

Finally, keep an eye on the domestic semiconductor output and data-center construction. U.S. semiconductor and electronic-component production has already climbed sharply, with the Fed’s production index reaching 188.0 in May versus 150.2 at the end of 2024.

This is the secular tell.

The AI boom is blowing out the import tab right now because America still relies heavily on overseas hardware. But if domestic chip production, server capacity and productivity close the gap, this trade drag gets smoothed out over the long haul.

For now, I wouldn’t read the wider deficit as evidence that AI is hurting the economy.

I’d read it as the invoice hitting the desk before the returns do.

What would most strengthen the bull case for U.S. AI investment?

Faster domestic chip production
0.00%
AI productivity showing up in GDP
0.00%
A smaller trade drag from tech imports
0.00%
Continued capex growth at current margins
0.00%
0 Polls

Sources

Atlanta Fed: GDPNow — Current and Past GDPNow Commentaries

Bureau of Economic Analysis: U.S. International Trade in Goods and Services, July 2026

Federal Reserve: The AI Buildout and the Economy: Publicly Available Data to Assess AI’s Impact

S&P Global Market Intelligence: Picture This — Mexico Server Boom, AI Data Center Supply Chains

U.S. Department of Commerce: Fact Sheet — Restoring American Semiconductor Manufacturing Leadership