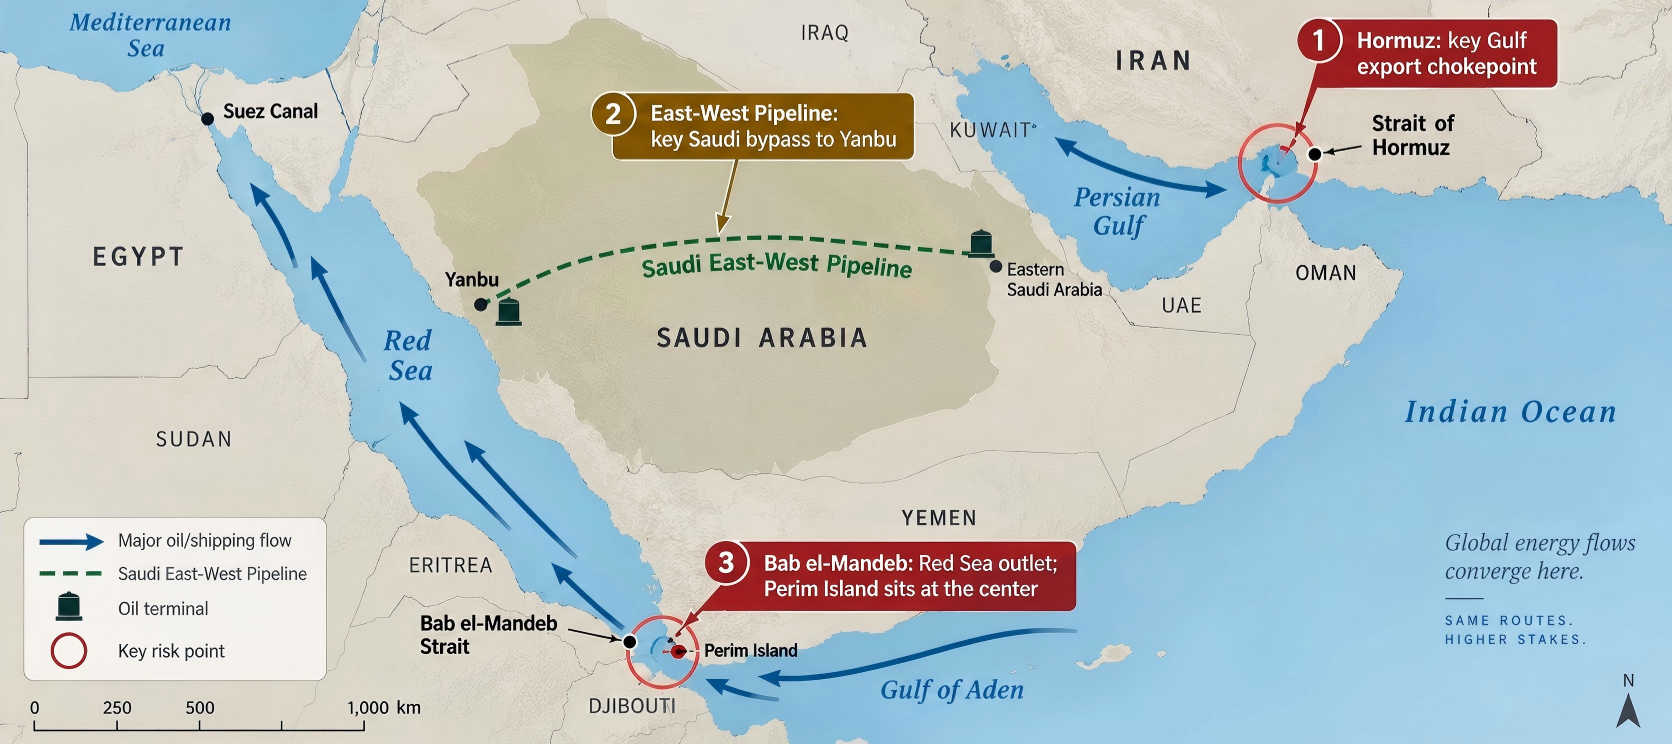
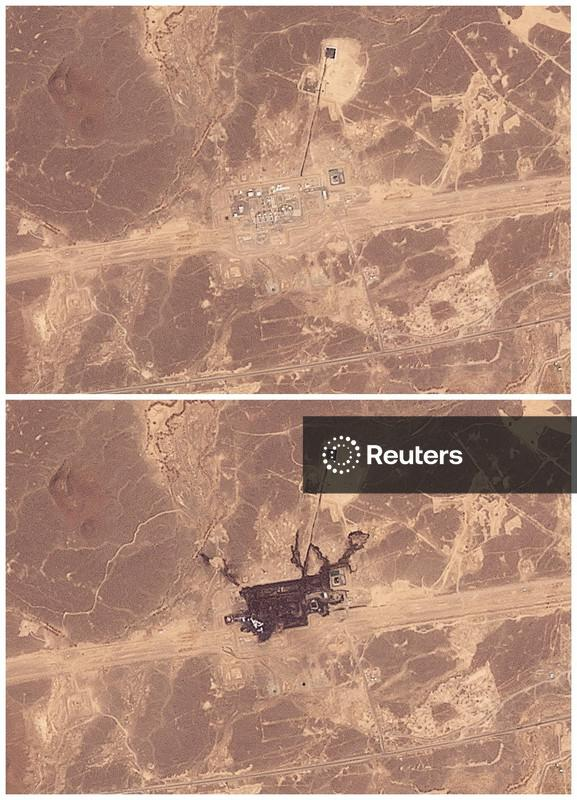
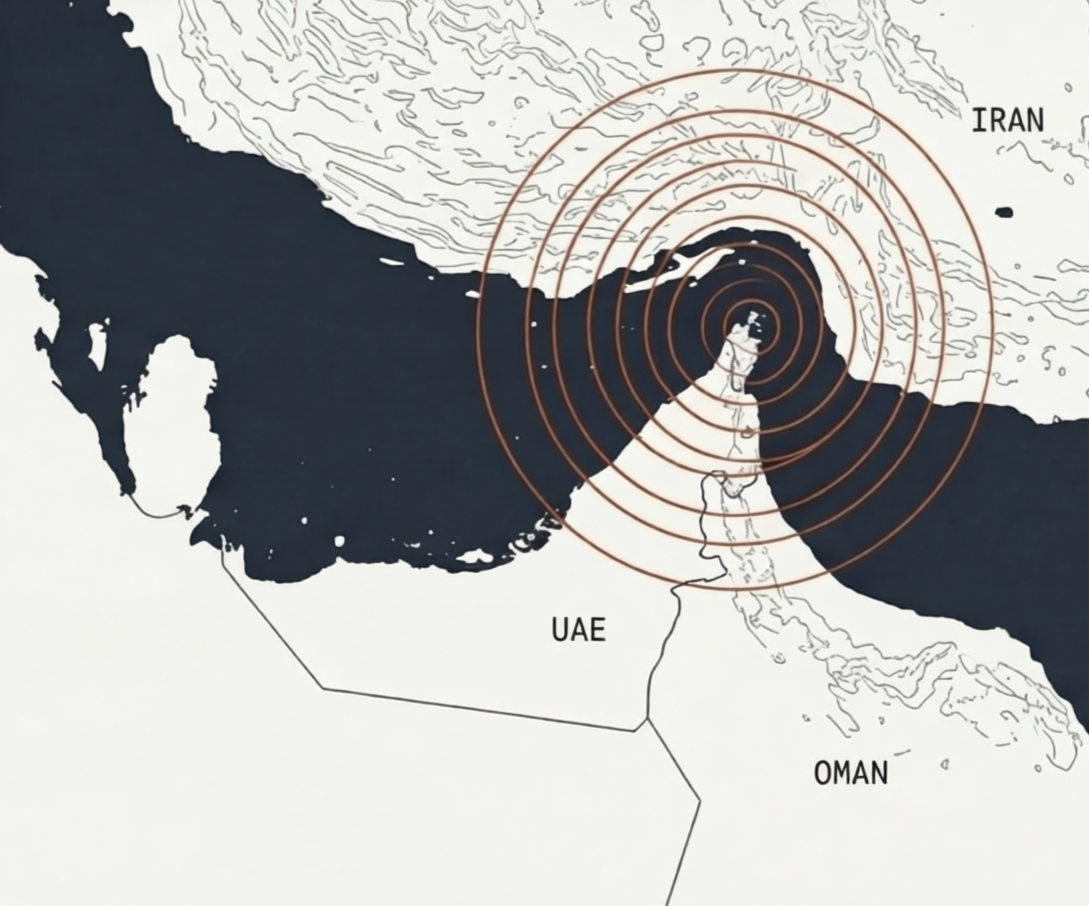
Sept. 11: Saudi Arabia’s East-West pipeline was knocked offline, threatening a route carrying about 4mn bpd to Yanbu; stocks there may cover only 5–7 days if flows do not resume.
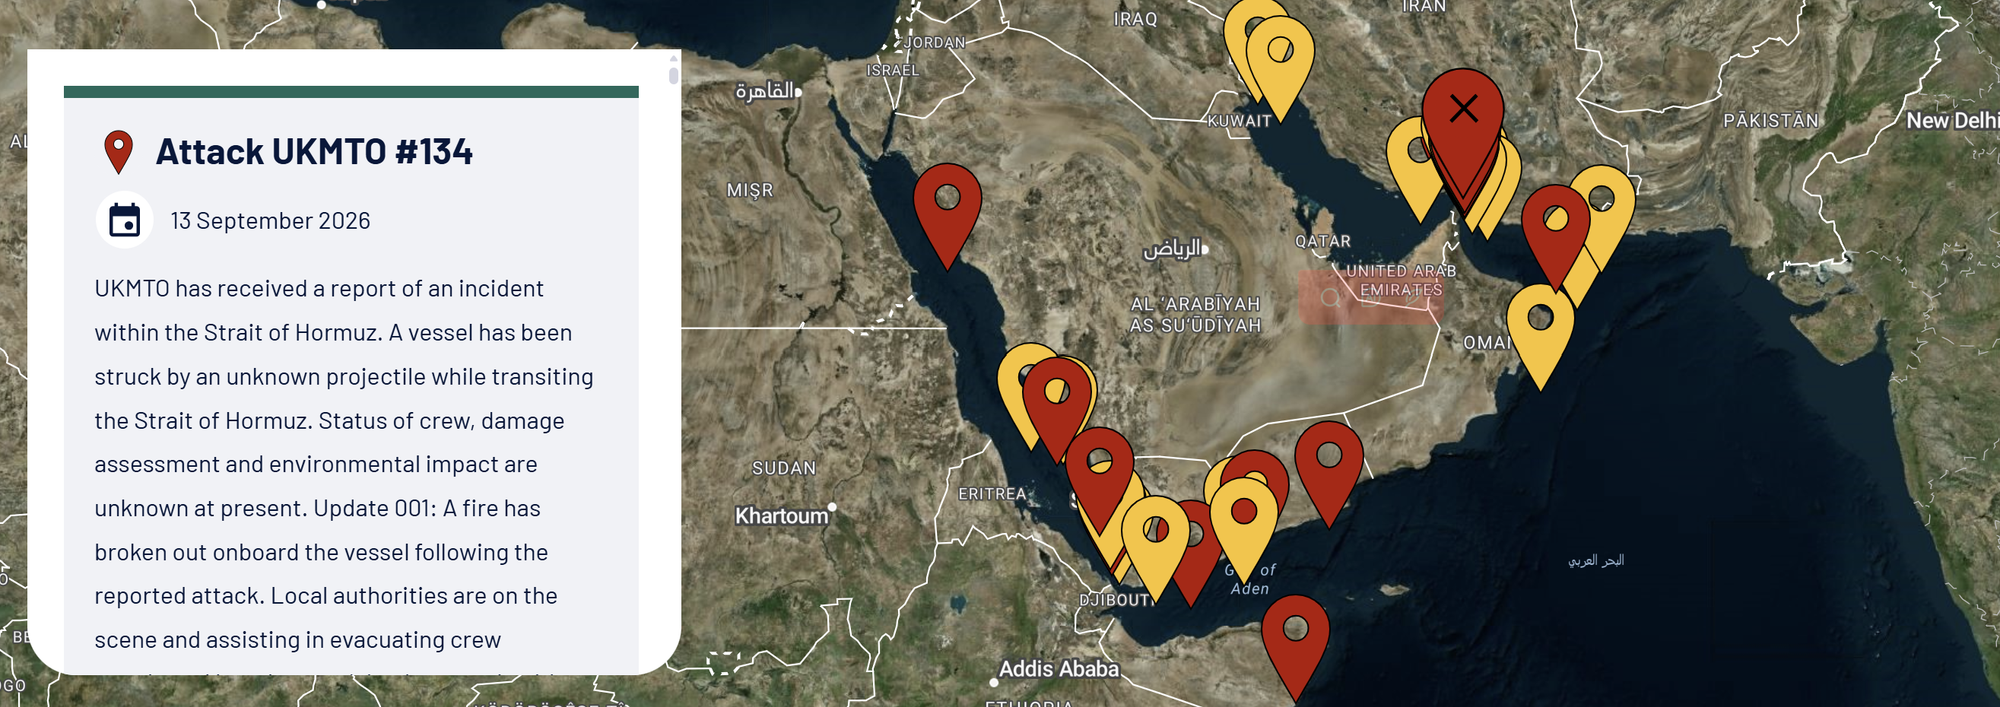
Sept. 13: Shipping risks widened as a vessel was hit in the Strait of Hormuz, while Houthi advances around Perim Island raised concerns over Bab el-Mandeb.
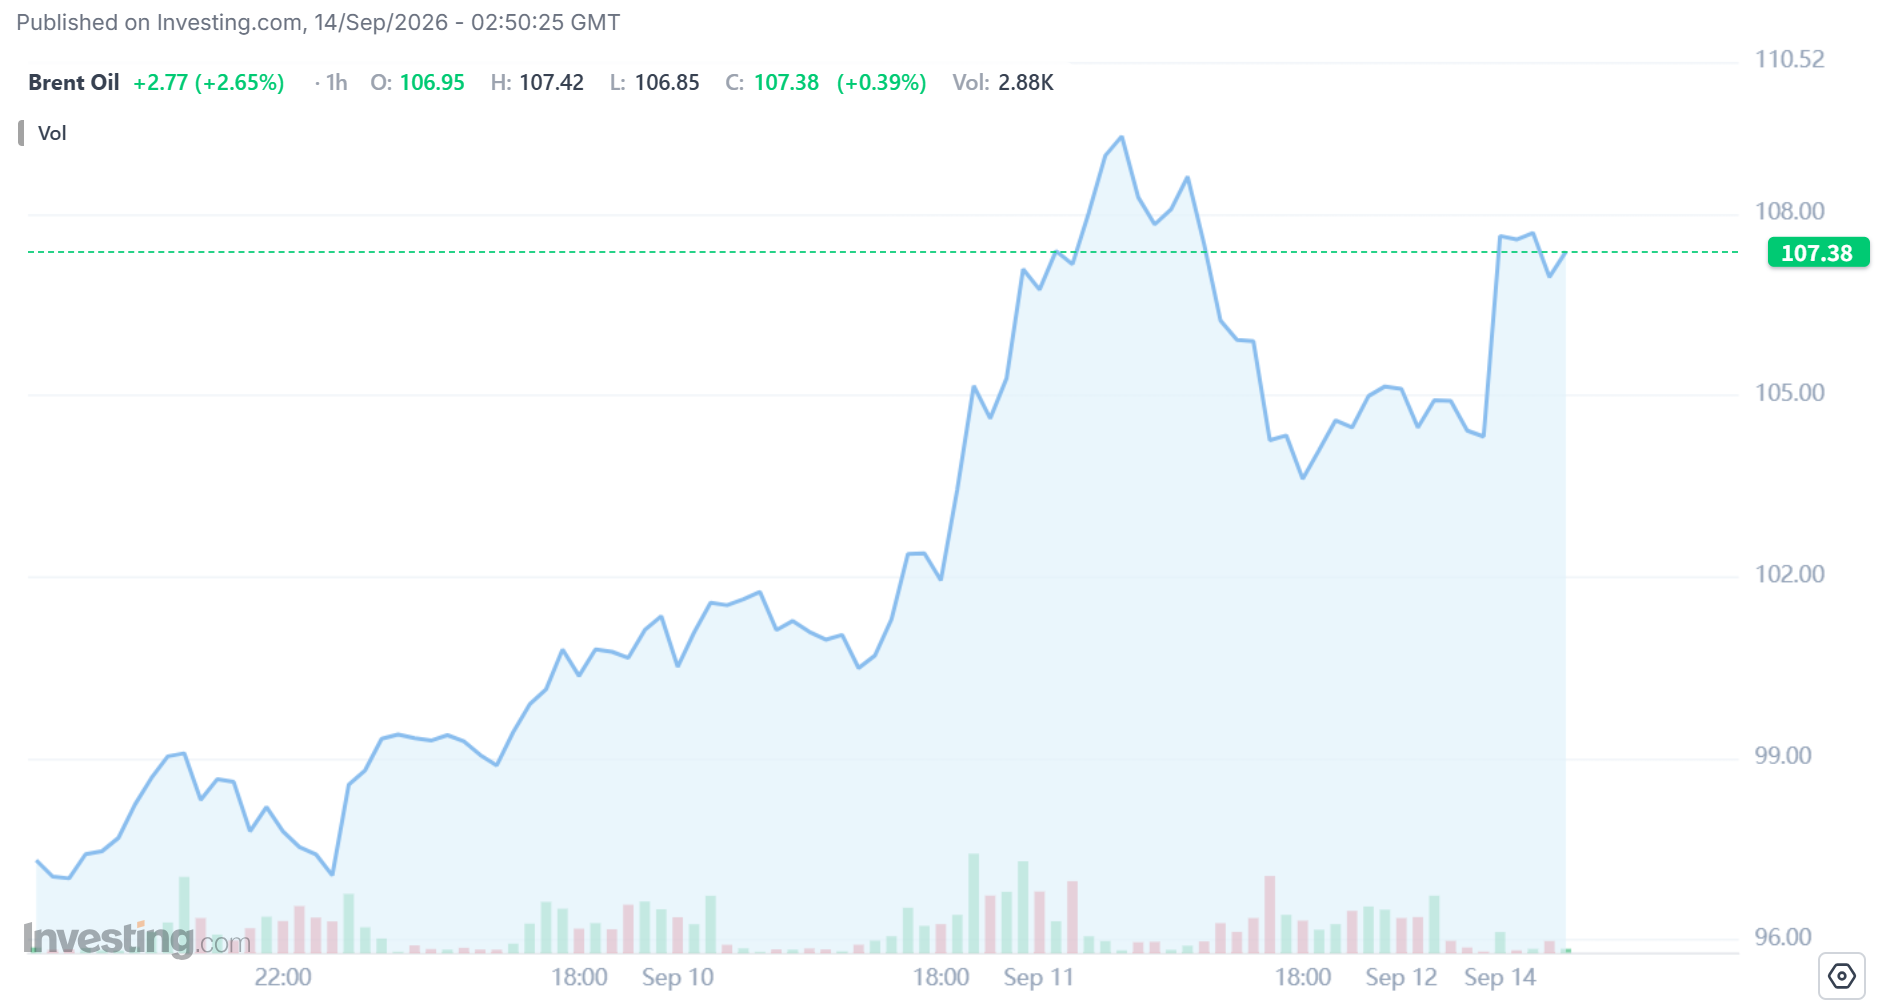
Sept. 13–14: Oman postponed planned Iran–Gulf talks on Hormuz, and oil opened higher Monday, with Brent around $107.5/bbl and WTI around $102.3/bbl.
Will Brent crude trade above $110 before the end of September 2026?
YesResult
0.00%
NoResult
0.00%
0 Polls
EndedTBD
–
Saudi Pipeline Outage Adds to Supply Fears
Saudi Arabia’s East-West oil pipeline remained shut through the weekend after drone strikes hit the system on Friday, adding another constraint to a market already dealing with reduced flows through the Strait of Hormuz.
A combination of satellite images shows the East-West pipeline facility on September 8, 2026 (top) and the same facility after sustaining damage on September 11, 2026 (bottom), in the Hejaz Region, Saudi Arabia. Source: Reuters
The 1,200-kilometer pipeline has become a key bypass route during the war, moving around 4 million barrels a day west to the Red Sea port of Yanbu — roughly 4% of global oil supply.
Saudi buyers and traders estimate Yanbu has enough stored oil to sustain exports for only five to seven days if the pipeline remains offline. Saudi Arabia has not disclosed the full extent of the damage, while repair estimates range from a partial restart relatively soon to as long as five to six weeks.
That makes the outage more than an infrastructure problem: it weakens one of the region’s main alternatives to Hormuz just as supply routes are becoming less reliable.
–
Risks Rise Across the Strait of Hormuz and Bab el-Mandeb
Shipping risks also intensified over the weekend.
On Sunday, a vessel transiting the Strait of Hormuz was struck by a projectile, causing a fire and forcing the crew to evacuate. Iran separately said an Iranian commercial vessel was hit off its coast, killing one person and injuring four crew members.
Source: UKMTO
Further west, Yemen’s Houthis advanced to Perim Island, which sits in the Bab el-Mandeb Strait at the entrance to the Red Sea. The route has recently carried around 4–5% of global oil supply.
The geography is increasingly important: Hormuz remains under pressure, Saudi Arabia’s main overland bypass is disrupted, and risks are now rising around another major energy chokepoint.
–
Oman Talks Slip as Oil Opens Higher
Diplomatic hopes also weakened late Sunday after Oman postponed a planned meeting between Iran and Gulf Arab states on future shipping arrangements through Hormuz.
Iran has maintained that it will not reopen the strait until the United States meets Tehran’s demands, limiting expectations for a near-term breakthrough.
By Monday’s open, the market was pricing three overlapping risks:
Saudi Arabia’s main Hormuz bypass remained offline
shipping risks had widened toward Bab el-Mandeb
the clearest near-term diplomatic channel had been delayed
Source: Investing
Brent rose to $107.51 a barrel and WTI to $102.32, after both initially gained more than 3%. Crude had already climbed around 8% the previous week, moving back above $100 for the first time since July.
On August 31, 2026, the U.S. Environmental Protection Agency (EPA) announced what appeared to be a highly technical decision: 29 small refineries would be exempted from compliance obligations totaling 1.76 billion Renewable Identification Numbers, or RINs. After the announcement, however, the price of RINs used for ethanol compliance rose by about 16% in a single day.
This electronic credit called a RIN has created a market in which companies effectively price the cost of complying with the U.S. government's biofuel mandate. RINs are the "currency" of that market.
Why Does the U.S. Need RINs?
The U.S. has a policy called the Renewable Fuel Standard (RFS). It requires the U.S. transportation fuel system to use a certain amount of renewable fuel each year, including corn ethanol, biodiesel, and renewable diesel. The RFS was first authorized under the Energy Policy Act of 2005 and was expanded further in 2007.
When it comes to requiring the use of renewable fuels, one of the simplest regulatory approaches would have been for the government to tell every refinery exactly how many hundreds of millions of gallons of ethanol and biodiesel it had to blend each year. But this approach has an obvious problem: the cost of using biofuels is not the same for every company. Some firms own their own fuel terminals, ethanol procurement networks, and blending facilities, making it relatively easy for them to blend ethanol into gasoline. Other refineries may focus mainly on processing crude oil into gasoline and diesel and may not have sufficient downstream blending infrastructure, making compliance through their own biofuel blending more expensive. If every refinery were required to personally complete the same proportion of renewable fuel blending, the system would not necessarily achieve the policy target at the lowest possible cost.
The U.S. therefore adopted a different design: the government determines how much renewable fuel the market as a whole must use, and then creates a tradable credit system that allows companies to decide for themselves who will actually carry out those tasks. That system is implemented through RINs.
EPA defines one RIN as one ethanol-equivalent gallon, meaning one gallon of renewable fuel measured on an ethanol-equivalent basis. For 2026, EPA finalized a total applicable renewable fuel volume of 26.81 billion RINs, rising to 27.02 billion RINs in 2027. EPA first converts the national renewable fuel target into uniform percentage standards based on the nationwide target and expected gasoline and diesel supply. Then, each company that produces or imports gasoline or diesel calculates its own Renewable Volume Obligation, or RVO based on the actual amount of fuel it produces or imports. In the simplest terms, RVO = the company's actual production or imports of gasoline and diesel × the annual percentage standard set by EPA. Suppose a particular percentage standard is 10%. If a refinery produces 1 billion gallons of gasoline and diesel subject to the RFS during the year, it would ultimately need approximately 1 billion × 10% = 100 million corresponding RINs to satisfy its RVO.
EPA therefore determines the nationwide rules, but the number of RINs each refinery actually needs depends on how much petroleum fuel it produces or imports. This is the source of demand in the RIN market.
Each renewable fuel is assigned a “D-code” that classifies it based on factors such as the feedstock used, the type of fuel produced, the energy inputs involved, and the applicable greenhouse-gas reduction threshold. These D-codes determine which of the four RVO categories a given renewable fuel can be used to satisfy. (Illustration by EPA)Technically, the RFS has four categories of RVOs, and each D-code is eligible to satisfy specific RVO categories. (Source: EPA)Volume requirements for different RVO categories. SRE reallocation will be explained later in this article. (Source: EPA)
How Does a RIN Move Through the System?
To make the process clear, suppose there are four companies in the market:
A: a corn ethanol producer
B: a fuel trader
C: a fuel terminal / blender responsible for blending ethanol into gasoline
D: a refinery producing gasoline and diesel
The life of a typical RIN consists of moving among these entities.
Company A's corn ethanol plant must first participate in the RFS regulatory system, and the feedstocks it uses, its production process, and the fuel it ultimately produces must qualify under an EPA-approved renewable fuel pathway.
Now suppose A produces 1 million gallons of qualifying corn ethanol. Conventional fuel ethanol generally has an equivalence value of 1.0, so these 1 million gallons of ethanol can generate 1,000,000 RINs. A must generate the RINs associated with its qualifying renewable fuel in the EPA Moderated Transaction System, or EMTS. EMTS is described as the database of record for all RIN transactions and can be understood as the official ledger for this market. The generation, transfer, separation, and retirement of all RINs (these concepts will be explained soon) must be recorded in this official EPA electronic system.
Once RIN generation has been completed in the system, A has 1 million RINs on its books. But at this stage, those RINs are not yet financial assets that can be freely sold separately from the ethanol. They are in a state known as Attached RINs. In this state, ownership of the RINs moves together with ownership of the physical ethanol. If a buyer purchases the ethanol, it also acquires the corresponding RINs. The relevant RIN information must also appear on the product transfer documents.
A now sells the 1 million gallons of ethanol to fuel trader B. B therefore receives the 1 million gallons of ethanol + the corresponding Attached RINs.
B then sells the ethanol to terminal C. The ethanol and the Attached RINs are still transferred together to C.
Terminal C now holds 1 million gallons of ethanol and 1 million Attached RINs. At the same time, C also holds conventional gasoline produced by the refining system. It blends 90% gasoline with 10% ethanol to produce E10, the most common gasoline blend in the U.S..
At this point, a critical change occurs. The original ethanol has now actually been blended into gasoline and entered transportation fuel, satisfying the separation conditions specified in the regulations. The corresponding RINs can therefore be separated from the physical ethanol and become Separated RINs. From this moment onward, the RINs are no longer tied to the original batch of ethanol. C can sell the blended E10 gasoline to gas stations while separately selling the 1 million Separated RINs to a refinery or a registered RIN trader, or it can choose to hold the Separated RINs temporarily in its own account and sell them later. A Separated RIN is therefore a credit that has been detached from the physical fuel and can be traded independently. What we normally refer to as the "RIN market" is primarily the market for these credits, rather than for Attached RINs.
Now shift the perspective to refinery D. Its primary production process is refining crude oil into gasoline and diesel. It produces fossil fuels rather than corn ethanol, so it does not receive a RIN for every gallon of ordinary gasoline it produces in the way ethanol producer A does. Quite the opposite: refineries and gasoline/diesel importers are typical obligated parties under the RFS. As they produce or import petroleum fuels, their RVOs increase accordingly. D must therefore obtain an equivalent quantity of RINs. There are two typical ways to obtain RINs. The first is for the obligated party to participate directly in renewable fuel blending, thereby obtaining and separating RINs. The second is to purchase RINs that have already been separated by someone else in the market.
In practice, the industry chain may therefore work as follows: Refinery D produces gasoline, while Ethanol Plant A produces ethanol and generates Attached RINs. Terminal C then blends the two into E10 and sells the resulting Separated RINs back to D. This also explains why a tradable RIN market is necessary. The company that incurs the regulatory obligation is not necessarily the same company that actually performs the renewable fuel blending. RINs connect these two stages.
RINs, however, are not traded on an exchange with an order book like CME. EPA explains that buyers and sellers first reach a transaction agreement outside EMTS, after which the buyer and seller separately submit Buy and Sell records in EMTS. EMTS matches the transaction records from both sides and performs quality checks. Only after confirmation are the RINs formally transferred from the seller's account to the buyer's account. By this stage, the ethanol that originally created those RINs may already have been burned in a car engine as part of E10 gasoline. Yet the "compliance value" left behind by that ethanol continues to exist independently in the form of RINs, even though the RINs themselves have no direct consumption value. This is also why RINs have strong characteristics of financial assets.
Refinery D does not have to surrender the corresponding RINs to EPA immediately every time it produces a gallon of gasoline. Throughout the compliance year, it can continue producing gasoline and diesel and accumulating RVOs, while buying and selling RINs and building a RIN inventory. Only at the annual compliance stage, usually after the end of the compliance year, does it calculate its actual obligation for the year and retire for compliance the RINs it owns. EPA's currently published reporting deadline for the 2026 compliance year is March 31, 2027. To retire a RIN essentially means to cancel it for compliance purposes. Once a RIN has been used to satisfy a refinery's RVO, it can no longer be sold or used by another refinery to satisfy a second compliance obligation. Its life cycle ends there.
The government requires certain companies to hold enough RINs to comply with the law, creating mandatory demand. At the same time, the supply of RINs is tied to the production and use of renewable fuels. Therefore, as long as the government's renewable fuel target exceeds the amount the market would naturally choose to use without policy incentives, RINs will have a positive price.
An extremely simplified example illustrates the mechanism. Suppose conventional diesel costs $3 per gallon to produce, while renewable diesel costs $4 per gallon. Without policy intervention, the market would naturally prefer producing the cheaper conventional diesel. But now suppose the government requires greater use of renewable diesel. For the marginal gallon of renewable diesel to be worth producing, the $1 cost gap must be compensated. If producing that gallon of renewable diesel generates a RIN worth $1, the producer's effective cost becomes $4 - $1 of RIN value = $3, making renewable diesel competitive again.
The most important economic meaning of the RIN price is therefore: how much additional economic incentive is required for the U.S. to consume one more unit of renewable fuel? It is the shadow price of the Renewable Fuel Standard. The government determines the quantity target, while the market uses the RIN price to tell policymakers and companies how difficult that target is to achieve.
Why Did RIN Prices Rise Above Two Dollars in 2026?
If the renewable fuel mandate is easy to satisfy, RINs do not need to be expensive. For example, U.S. gasoline has long contained large amounts of E10, meaning gasoline with roughly 10% ethanol. Within this range, blending ethanol into gasoline is already a highly mature commercial activity.
The problem emerges when the government requires renewable fuel use to increase further. By around 2013, the ethanol share of the U.S. gasoline pool had already approached the roughly 10% level that mainstream E10 could accommodate, commonly referred to as the E10 blend wall. Expanding ethanol consumption further increasingly requires higher-ethanol blends such as E15 and E85, along with compatible vehicles, gas station equipment, and consumer acceptance.
If the low-cost opportunities for blending ethanol into gasoline are gradually exhausted, additional RFS obligations may increasingly depend on other fuels such as biodiesel and renewable diesel. The more expensive the marginal compliance pathway becomes, the higher the RIN price must rise to incentivize additional production.
This shows just how large the policy value embedded in RINs can become. One gallon of fuel ethanol generally generates 1.0 RIN. One gallon of biodiesel generates about 1.5 RINs. One gallon of renewable diesel typically generates about 1.6-1.7 RINs. So when the RIN price reaches roughly $2.40, the credits alone can provide more than $3.50 of value per gallon of biodiesel or renewable diesel. That $3.50 is not energy value. It is additional regulatory value.
The economic effect of RINs is therefore similar to simultaneously increasing the relative cost of petroleum fuels and increasing the relative value of renewable fuels. NBER describes the mechanism very directly: economically, RINs function like a charge on obligated petroleum fuels while providing a corrective subsidy to renewable fuels.
The August 2026 Small Refinery Exemptions
In August 2026, the U.S. allowed qualifying small refineries to apply for Small Refinery Exemptions, or SREs. Put simply, if EPA determines that an eligible small refinery faces particular economic hardship because of the RFS, the agency may exempt some or all of its RFS obligation.
We now know that the number of RINs a refinery needs to acquire depends fundamentally on its RVO. If EPA directly exempts part of a refinery's obligation, the refinery naturally no longer needs to purchase RINs for that portion of the obligation. Demand for RINs should therefore fall, and RIN prices should also decline, at least in theory.
The answer was hidden in another sentence in the same EPA announcement. Although EPA exempted 1.76 billion RINs of 2025 obligations, it also announced that it planned to propose, before the end of October 2026, a mechanism to reallocate 100% of the difference between the actual 2025 exemption volume and the amount previously assumed into the 2026 and 2027 RVOs. In other words, a single announcement created two opposing shocks at the same time. Although some 2025 obligations were being eliminated immediately, reducing current RIN demand, approximately 770 million additional obligations could be added back into 2026-2027, increasing future RIN demand. Because of the existence of the E10 blend wall, the market ultimately judged that the additional future scarcity mattered more than the immediate exemptions, and RIN prices rose.
Volume requirements for different RVO categories (Source: EPA)
At the Other End of the RIN Market Is More Than One-Third of U.S. Corn Demand
If RINs were merely an internal accounting system within the refining industry, this story might not matter very much.
But the other end of the RIN system is connected to U.S. agriculture. A large share of U.S. corn is ultimately not eaten directly by people or fed to livestock, but processed into fuel ethanol. USDA data show that in the 2024/25 marketing year, 5.44 billion bushels of U.S. corn were used for fuel ethanol, accounting for 36% of total U.S. corn use. In other words, more than one-third of U.S. corn demand is now connected to the transportation fuel system.
So when EPA changes RIN demand, the effects do not stop at the refinery. When RIN prices change, the economics of producing ethanol, biodiesel, and renewable diesel change as well, which in turn affects demand for feedstocks such as corn and soybean oil. The RFS has therefore never been merely an environmental policy. It is simultaneously an energy policy and an agricultural policy.
Ethanol share of total U.S. corn use, 2010/11-2024/25 (Source: USDA Feed Grains Yearbook Tables, Tables 4 and 31. Denominator includes exports.)
RINs Are Not Environmental Points, but the Price of "Regulatory Scarcity"
Calling RINs a kind of "shadow currency" does not, of course, mean that they are literally equivalent to dollars. They cannot be used to buy coffee, nor do they possess purchasing power in the conventional sense. But the analogy captures the three most important characteristics of RINs.
First, the government creates demand. Obligated parties that produce and import gasoline and diesel generate RVOs based on their fuel volumes and are therefore legally required to obtain the corresponding number of RINs.
Second, renewable fuel creates supply. Renewable fuel producers that meet RFS requirements generate RINs. The RINs initially move together with the physical fuel in Attached form and, once the necessary conditions are satisfied, become independently tradable Separated RINs.
Third, the market determines the price. If the quantity of renewable fuel required by the government is easy to supply, RINs are cheap. If the requirement approaches the limit of what the existing U.S. fuel system can absorb at low cost, RIN prices rise. They will keep rising until some new marginal compliance pathway becomes economically viable.
What the U.S. Renewable Fuel Standard has therefore created is fundamentally a price-discovery mechanism. The government specifies the quantity, the market searches for the lowest-cost way to achieve it, and the RIN price continuously tells the market how difficult that target is to meet.
One economic interpretation of a RIN, therefore, is that it represents the price of regulatory scarcity, a price that simultaneously connects the U.S. energy industry with agriculture. Most American drivers may never personally buy or sell a RIN in their lives. But every time they fill up their tanks, this market is operating in the background. The violent price movement in August 2026 merely caused a machine that normally remains hidden behind gasoline prices to briefly reveal itself.
Disclaimer: The content is for informational purposes only. You should not construe any such information or other material as legal, tax, investment, financial, or other advice. Nothing contained in this article constitutes a solicitation, recommendation, endorsement, or offer by the author(s) or any third party service provider to buy or sell any securities or other financial instruments in your or in any other jurisdiction in which such solicitation or offer would be unlawful under the securities laws of such jurisdiction. The author(s) report(s) no conflict of interest.
The AfD finished three seats short of control. Its opponents can still keep it out of government but only by crossing some of their own political red lines.
The AfD won the election in Saxony-Anhalt. It did not win the government.
According to the provisional final result, the party received 43.8% of the vote and secured 39 of the state parliament’s 83 seats—three short of the 42 required for a majority. The CDU collapsed from 37.1% in 2021 to 17.2%, winning just 15 seats and losing every direct constituency. Turnout reached 77.8%.
That result confirms the central argument of our pre-election analysis: finishing first, winning a parliamentary majority and forming a government are three different outcomes.
It also confirms why the 5% threshold mattered. The Sahra Wagenknecht Alliance, or BSW, entered parliament with 5.3% and five seats. Instead of giving the AfD an automatic majority, the election produced a legislature in which every plausible government depends on a party crossing a line it previously said it would not cross.
These are mathematical possibilities, not likely coalition agreements.
BSW has expressed openness to working with the AfD on individual policies, but it has also said it would not vote for either Siegmund or CDU incumbent Sven Schulze as minister president. Meanwhile, Siegmund has rejected the idea of a nonpartisan government surviving through shifting parliamentary majorities. If no workable government emerges, he has raised the possibility of another election.
The anti-AfD parties face an equally difficult calculation. The CDU, SPD, Greens and Left together hold only 39 seats. Therefore, any straightforward non-AfD majority needs BSW as well. Yet the CDU has ruled out formal cooperation with the Left, while BSW has rejected Schulze.
Germany’s firewall has consequently passed only its first test. It prevented a large AfD plurality from turning automatically into power. The harder test is whether the parties defending that firewall can produce a government capable of surviving.
A prolonged stalemate would still benefit the AfD politically. Siegmund could argue that the largest party is being excluded while its opponents assemble an unstable arrangement simply to keep him out. Another election would then become more than a procedural possibility; it would become a new contest over who voters blame for the deadlock.
Three developments now matter most:
Whether BSW changes its position
Whether the CDU accepts some form of support from the Left
Whether the first minister-president ballots produce a government or deepen the stalemate
The election decided who won. It did not decide who will govern.
Will Ulrich Siegmund be elected Minister President of Saxony-Anhalt before January 1, 2027?
Örebropartiet (ÖP) is a local political party in Örebro, Sweden, led by Markus Allard. Historically, it has focused primarily on municipal and regional politics rather than national politics. In late 2025, ÖP announced that it would contest Sweden's 2026 parliamentary election for the first time. The election will be held on September 13.
Örebropartiet's biggest opportunity comes from a special feature of Sweden's electoral system: a party does not need to win 4% of the national vote to enter parliament if it can instead secure 12% of the vote in a single constituency. Örebro County happens to be one such constituency.
In late August, a Novus poll brought market attention to ÖP. The survey showed Örebropartiet polling at 15.1% in the Örebro County regional election, with a sample size of 1,088. If that figure translated directly into the Riksdag election, ÖP would win a parliamentary seat and make history.
The problem is that Swedish voters do not cast just one ballot. They vote separately in:
Municipal elections
Regional elections
Riksdag elections
A voter can therefore support different parties in different elections to express different preferences on local and national politics. The 12% threshold applies to the Riksdag election, not to the regional election measured in the Novus poll, so the two cannot be directly converted.
Now Infostat has provided data that are much closer to the actual underlying of the prediction market. It directly asked voters in Örebro County, "If a parliamentary election were held today, which party would you vote for?". A total of 1,136 people participated in the survey, with data collection continuing through September 3.
Metric
Support
ÖP regional election, Novus
15.10%
Riksdag “other parties”, Infostat
6.30%
Infostat estimate for ÖP
Slightly below 6%
Required in the Riksdag
12.00%
Even under the most favorable interpretation for Örebropartiet, if we assign the entire 6.3% "other parties" vote to ÖP, it would still be 5.7% short of the 12% threshold. In other words, with only 9 days remaining, its Riksdag support would need to increase by roughly 90%. If we instead use Infostat's estimate that ÖP itself is polling at slightly below 6%, the required increase would exceed 100%.
Infostat reported an uncertainty interval of ±1.53% around the 6.3% support for "other parties". Even if we move the entire uncertainty range in ÖP's favor, 6.3% + 1.53% = 7.83%, leaving the party still more than 4% short of 12%.
For a Yes outcome to occur, Örebropartiet would therefore need a very large final-week surge that has not yet appeared in parliamentary voting-intention polls.
If someone reads the methodology behind the Infostat survey, they might raise a reasonable objection: Infostat began collecting data in June, so the poll may underestimate the surge in media attention Örebropartiet has received over the past several days.
However, the timing of the interviews weakens this argument. Infostat states that three-quarters of the interviews were conducted after August 24, meaning that the overwhelming majority of responses were collected very close to the current electoral environment. When Infostat split the sample into earlier and later periods, support for "other parties" rose only from 5.5% to 6.6%. Infostat explicitly noted that this change remained entirely within the margin of statistical uncertainty and did not provide evidence of a clear late surge.
The 15.1% regional poll therefore demonstrates that Örebropartiet has a large pool of potential supporters. But the latest Riksdag poll suggests that many voters who are willing to support ÖP in local elections are still not prepared to give the party their national ballot.
To convert 15.1% regional support into the 12% Riksdag support required to enter parliament, ÖP would need to retain 12% / 15.1% = 79.5% of its local support on the national ballot.
If ÖP's current Riksdag support is around 6% while its regional support is around 15.1%, the orders of magnitude implied by these two separate surveys suggest that its national-ballot support is currently only around 40% of its regional support. Because the surveys use different methodologies and samples, this should not be treated as a precise voter-conversion estimate. But it is sufficient to show that the gap is substantial.
To enter parliament, ÖP would have to close almost all of that gap in roughly one week.
Why Can Local Support Be So High While Parliamentary Support Is So Low?
Örebropartiet is, first and foremost, a successful local political party. It has a clear brand in local politics, and voters can support Markus Allard with their regional or municipal ballot while reserving the more consequential Riksdag ballot for a national party.
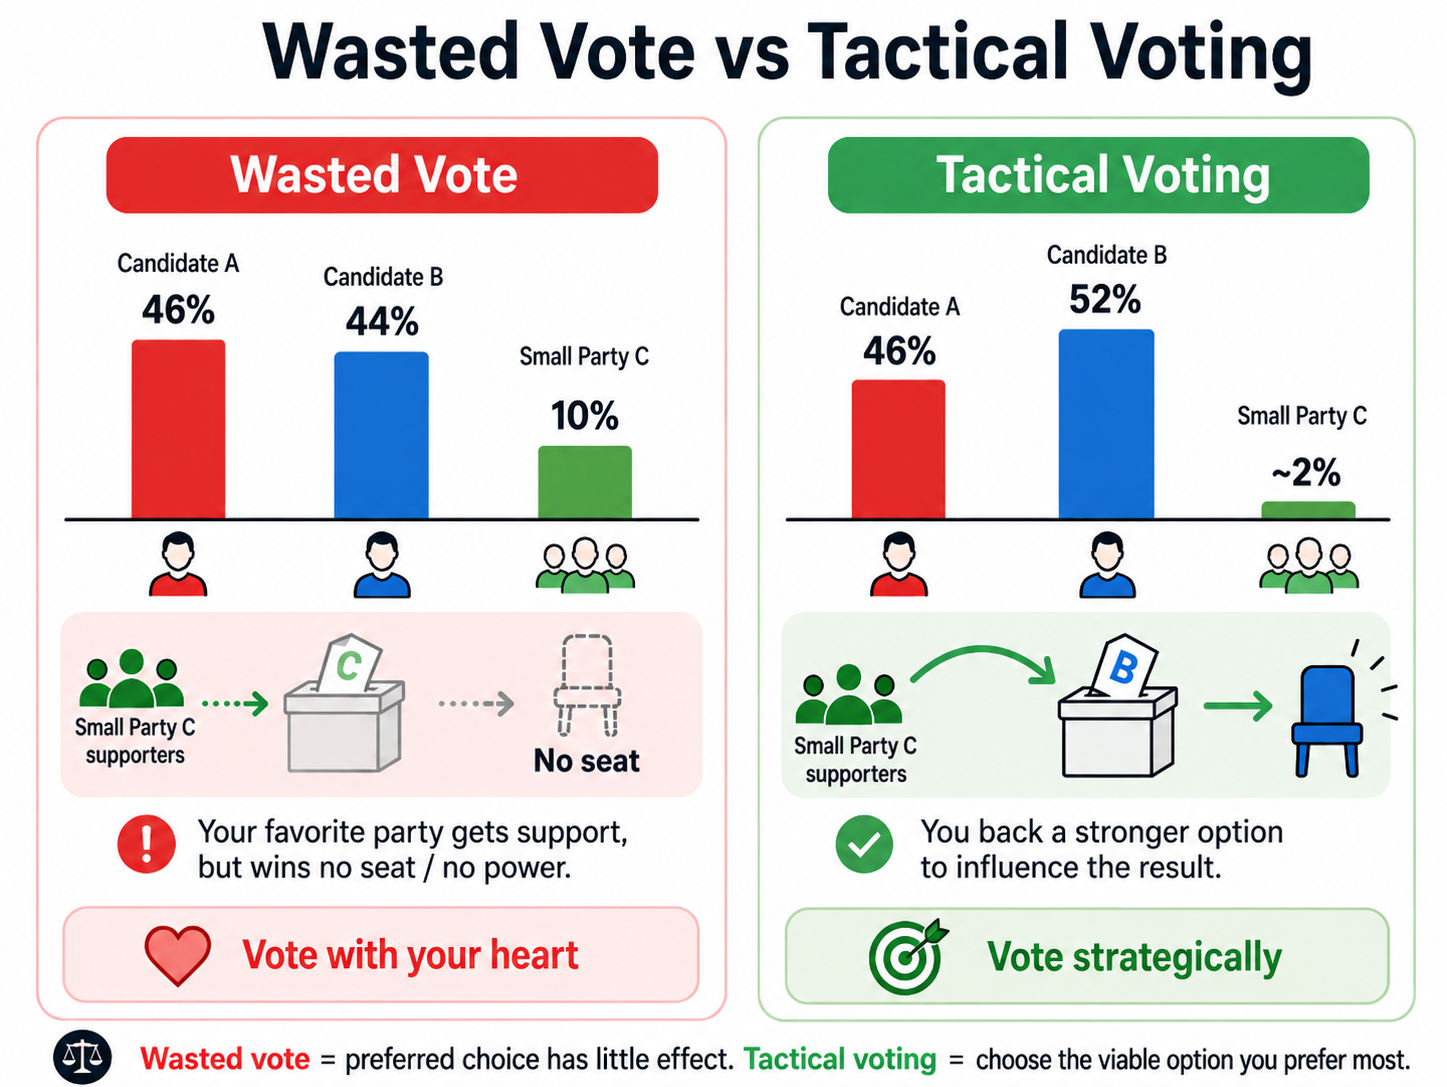
This is exactly how Infostat's Peter Santesson interprets the survey results. In local elections, voters are more willing to support smaller parties as a way of expressing a political preference or sending a signal. In parliamentary elections, where government formation is at stake and voters face the risk of "wasting" their vote, their willingness to experiment falls significantly.
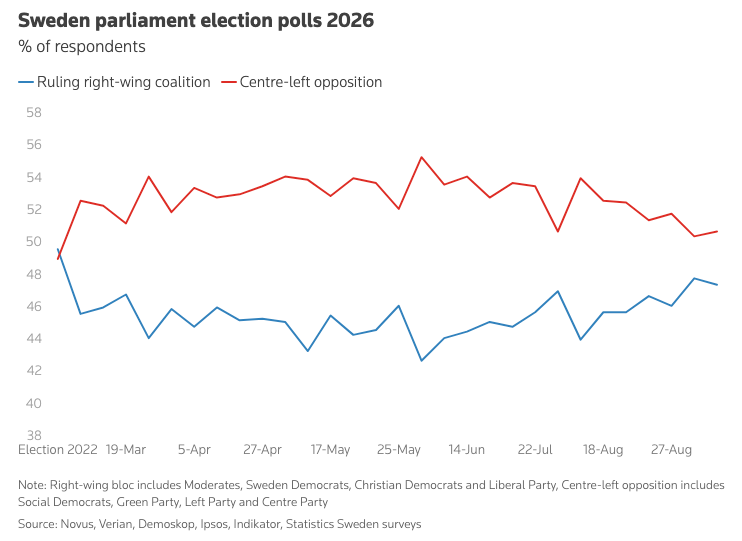
The latest nationwide Demoskop poll puts the centre-left bloc at 50.6% and the ruling right-wing coalition at 47.3%, a gap of only 3.3%. At the same time, the Liberals are polling at just 2.8%, below the national 4% Riksdag threshold, which further increases the importance of tactical voting and concerns about wasted votes.
For a voter who likes Örebropartiet locally but also cares deeply about which bloc forms Sweden's next government, voting for ÖP in the regional election while supporting another party in the Riksdag election is reasonable. That is precisely how a 15.1% regional figure and a sub-6% parliamentary figure can coexist.
A breakthrough coordination surge that carries ÖP into parliament is not impossible. The party already has a local support base of roughly 15.1%, media coverage of the 12% rule has only recently intensified, and the growing perception that "my vote may no longer be wasted" could itself encourage more supporters to cast their Riksdag ballot for ÖP.
But moving from roughly 6% national-ballot support to 12% in just 9 days would require an exceptionally strong political mobilization, and the latest data do not yet show that such a surge is underway. For that reason, the Yes price of 25c on Polymarket may be too high.
Disclaimer: The content is for informational purposes only. You should not construe any such information or other material as legal, tax, investment, financial, or other advice. Nothing contained in this article constitutes a solicitation, recommendation, endorsement, or offer by the author(s) or any third party service provider to buy or sell any securities or other financial instruments in your or in any other jurisdiction in which such solicitation or offer would be unlawful under the securities laws of such jurisdiction. The author(s) report(s) no conflict of interest.
The AfD holds a 20-point polling lead in Saxony-Anhalt. Yet the state’s next government may be decided by parties hovering around 5% and by what happens after the ballots are counted.
Will the AfD win an outright majority of seats in the Saxony-Anhalt Landtag?
YesResult
58.89%
NoResult
41.11%
90 Polls
EndedTBD
A party can finish first by 20 percentage points and still fail to take office. Saxony-Anhalt may soon show Germany how.
The eastern state votes on September 6. A late-August Infratest dimap survey puts the Alternative for Germany (AfD) at 42%, far ahead of the governing Christian Democratic Union at 22%. The Left follows on 11%, the Social Democrats on 8% and the Greens on 6%. The BSW and Free Democrats remain below the 5% threshold required to enter the state parliament.
That looks like an overwhelming AfD victory. It is not necessarily an AfD government.
The election contains three separate questions.
Which party receives the most votes?
Does any party control a majority of seats?
Can someone assemble enough parliamentary support to elect a minister-president?
The AfD is strongly favored on the first. The other two remain open.
The Number to Watch Is 5%, Not 42%
Votes cast for parties that fail to clear the 5% threshold are largely excluded when proportional seats are distributed. That can turn a large plurality into a parliamentary majority without the party winning half of the popular vote.
Using the latest poll as a simplified illustration, the five parties currently above the threshold account for 89% of the vote. The AfD’s 42% would therefore translate into roughly 47% of the votes represented in parliament not enough to govern alone.
However, if move the Greens from 6% to just below 5%, the represented vote will falls to roughly 83%. The AfD’s unchanged 42% would then amount to slightly more than half of that total.
Actual seat allocation will also depend on constituency results and the final distribution of votes. The calculation nevertheless explains why the parties near 5% may be more important to government formation than another one- or two-point change in the AfD’s headline number. Reuters (30 Aug.) similarly assessed that 42% would probably leave the party just short of a majority, with the smaller parties determining whether that remains true.
It has also produced an unusual tactical-voting campaign. Some anti-AfD groups are encouraging voters to support the SPD or Greens—not necessarily because they are their first choices, but because keeping those parties above 5% expands the non-AfD side of the parliament.
A Firewall Can Block Power Without Producing a Government
Every major party has ruled out a coalition with the AfD. That commitment, known as Germany’s political “firewall,” has kept the party out of every state and federal government despite its growing vote share.
A plurality would not break the firewall by itself. An outright majority would.
Anything between those outcomes creates a much less comfortable test. Under the latest poll, the CDU, SPD and Greens together have only 36%, which is six points less than the AfD. Add the Left and the anti-AfD side reaches 47% but Chancellor Friedrich Merz has repeatedly ruled out CDU cooperation with both the AfD and the Left.
The available options could therefore include a broad coalition that crosses old ideological boundaries, a CDU-led minority government relying on outside support, or a prolonged attempt to negotiate a workable arrangement. Each would preserve the firewall but none would look particularly stable.
Even falling short of a parliamentary majority would not make the minister-president vote irrelevant. Saxony-Anhalt initially requires a candidate to win the support of a majority of all Landtag members. If two ballots fail, parliament must consider an early election. Should it reject dissolution, a later ballot can be won with a majority of the votes actually cast. Absences, abstentions and coordination among AfD opponents could therefore become decisive.
The firewall is consequently more than a promise not to sign a coalition agreement. The other parties must cooperate sufficiently to elect and sustain an alternative government.
The AfD Is Selling More Than an Immigration Policy
It would be easy to explain the AfD’s lead entirely through immigration. That would miss much of what has made its campaign effective in Saxony-Anhalt.
The party has connected migration, energy prices and distrust of Berlin to a broader story about eastern German identity. At one rally, nearly 5,000 people attended an event centered on Simson motorcycles, a brand closely associated with life in the former East Germany. Among the state’s voters aged roughly 18 to 34, AfD support in the 2025 federal election reached about 40%, up from approximately 25% in 2021. Nostalgia is being passed to voters who did not personally live under the German Democratic Republic.
Material disparities reinforce that appeal. Unemployment in Saxony-Anhalt peaked at 22% in 2003 and is now around 8%, yet people in eastern Germany still hold only about one quarter of the wealth of western Germans. The economic upheaval following reunification remains part of the region’s political memory.
The AfD has folded Russia into the same argument. Its state program calls for better relations with Moscow, an end to sanctions and reduced German support for Ukraine. It also evokes the cheap Russian energy that once supported German industry.
Those promises collide with a new security dispute. Germany has blamed Russian state actors for an attempted drone attack at Leipzig/Halle Airport, close to Saxony-Anhalt, while Moscow has rejected the allegation. Berlin is now pushing for additional European sanctions just as the AfD campaigns for the opposite policy.
A state government cannot independently lift EU sanctions, restore national energy agreements or end Berlin’s support for Ukraine. The AfD is therefore asking voters to use a regional election to reject policies largely decided elsewhere—a strategy that can win votes even when the state itself lacks the authority to deliver the central promise.
The Candidate Makes the Experiment Look Less Experimental
Ulrich Siegmund, the AfD’s 35-year-old lead candidate, has presented a friendlier public image than some of the party’s better-known figures. He avoids much of their harsher rhetoric, campaigns heavily through social media and speaks about renewal, affordability and local pride.
That presentation sits alongside a more serious institutional dispute. Saxony-Anhalt’s domestic intelligence agency classifies the state AfD organization as belonging to the extremist far right and as hostile to Germany’s democratic order. Siegmund rejects both the label and the accusations behind it.
The contrast is central to his appeal: a radical change in government delivered through a candidate who does not look or sound especially disruptive.
Merz has tried to raise the cost of that choice. He warned that international companies could avoid investing in a state led by an AfD minister-president. For now, that is a political risk argument rather than a measured economic result. No AfD-led state government has existed to provide a German comparison.
Investors will nevertheless be watching how an AfD administration approaches public appointments, skilled immigration, education, energy policy and the state bureaucracy. The signal may reach beyond Saxony-Anhalt even before any policy changes.
A Victory With Three Different Meanings
The AfD already describes Saxony-Anhalt as the first step toward federal power in 2029. It was polling at 27% nationally in late August, five points ahead of the CDU/CSU in one Politbarometer survey, while Berlin and Mecklenburg-Western Pomerania are also due to hold state elections on September 20.
Yet September 6 may produce several kinds of victory.
Finishing first would confirm that the AfD can dominate an eastern German election. Winning a majority of seats would give it a direct path to Germany’s first far-right-led state government of the postwar era. Falling short but leaving its opponents dependent on a fragile minority arrangement would produce something less visible but still valuable to the party: evidence for its argument that the existing system can exclude it only by becoming harder to govern.
The largest number on election night will be 42%, or something close to it. The numbers that decide who takes office may be much smaller.
Will Ulrich Siegmund become Saxony-Anhalt’s next minister-president?
Open Google Maps in the United States and Lake Ontario now appears as “Lake America.” Cross the border into Canada and the old name remains. Look from most other countries and Google displays both.
The lake did not change. Its political geography did.
President Donald Trump signed an executive order on August 27 directing the U.S. government to adopt “Lake America” for federal purposes. Google updated its American maps because it follows the U.S. Geographic Names Information System, and Apple later made the same change for U.S. users.
The order has no authority over Canadian naming conventions or international usage. Roughly 52% of the lake lies on the Canadian side of the border, while the remainder borders New York.
Will Trump’s Reuters/Ipsos approval rating rise above 35% before the November 3 midterm elections?
YesResult
0.00%
NoResult
0.00%
0 Polls
EndedTBD
The political response is less divided than the maps.
Only 14% of Americans supported the renaming in a Reuters/Ipsos survey, while 63% opposed it. The same poll found that just 20% backed Trump’s higher tariffs on Canadian goods and 57% opposed them. It surveyed 1023 U.S. adults and carried a four-point margin of error.
A separate Reuters/Ipsos poll put Trump’s overall approval rating at 33% for the third consecutive survey. 71% disapproved of his handling of the cost of living. Democratic voters also reported greater enthusiasm about the November 3 midterms than Republicans, by 46% to 31%.
Those numbers should not be turned into a false causal story. There is no evidence that Trump renamed the lake because his approval rating fell, or that the name change itself caused the decline. The two surveys instead reveal the same political mismatch from different angles.
Trump is using an inexpensive symbolic action to keep control of the public conversation. Meanwhile, voters say their leading midterm concern is the cost of living. A renamed lake can generate headlines within hours, cannot lower a grocery bill, a gasoline price or an import cost.
The connection becomes harder to dismiss because the order arrived during an escalating trade dispute with Canada. A map label is symbolic. Tariffs are not. When both are packaged as demonstrations of strength, opponents can use the unpopular name change to draw more attention to the part of the confrontation that may affect household finances.
There is also a quieter lesson in the way technology companies responded. An executive order could alter a federal database, and the database then altered what millions of Americans saw on their phones. It could not produce agreement across the border. Instead of establishing one new name, the order created three digital versions of the same lake.
Trump’s 33% approval rating itself, is not a forecast of the congressional result. National surveys do not capture every competitive district and the midterms are still two months away. It is nonetheless a warning that political theater is failing to displace the economic question voters keep returning to.
The administration successfully changed the map. It has not yet changed what Americans say they care about.
Fed hike risk is back: Kevin Warsh’s Jackson Hole speech pushed the probability of a September hike from 35.4% to 55.7%, sending short-end Treasury yields higher - yet retail consensus may points the other way - per prediction markets data. The next major test comes on September 4, when nonfarm payrolls and the unemployment rate are released.
Washington is locking in Venezuelan oil: A new 25-year agreement could give US interests access to roughly one-fifth of Venezuela’s proven reserves, with some barrels potentially used to rebuild the SPR.
Hormuz risk is rising again: US strikes inside the Strait pushed Brent above $90/bbl, while visible shipping traffic fell sharply over the weekend.
What will the Fed do in September?
RaiseResult
0.00%
HoldResult
100.00%
CutResult
0.00%
1 Polls
EndedTBD
Fed Hike Risk Returns, All Eyes On Nonfarm Payrolls
“I stand here today committed to a discipline, not to a decision.”
Fed Chair Kevin Warsh used Jackson Hole to put another rate increase firmly back on the table, warning that “if underlying inflation does not move convincingly toward our 2% target, there will be more work to do.”
His broader message was less about promising the next move and more about changing how the Fed makes decisions:
Less forward guidance: Warsh warned of a “Hall of Mirrors” in which markets follow the Fed, while the Fed then reads those same market prices as economic signals. He pointed to 2021 as a lesson in the risks of overcommitting to a policy path.
A more restrained Fed: Policy should focus on underlying trends rather than individual data points, treat the 2% inflation target as a firm objective, rely mainly on short-term rates and reserve unconventional tools for genuine crises.
AI matters, but not yet for policy: Warsh sees AI as potentially transformative for productivity and the production function, but its effects on labor and capital remain too uncertain to shape current monetary policy.
The economy still looks resilient: Consumption is growing above 2%, private domestic final purchases near 3%, and unemployment is just 4.1%. Inflation remains the problem: 12-month PCE is 3.7%, six-month inflation 4.1%, and 54% of the PCE basket is rising faster than 3%, versus roughly 32% before the pandemic.
U.S. PCE Inflation
Headline and Core PCE inflation, February–July 2026
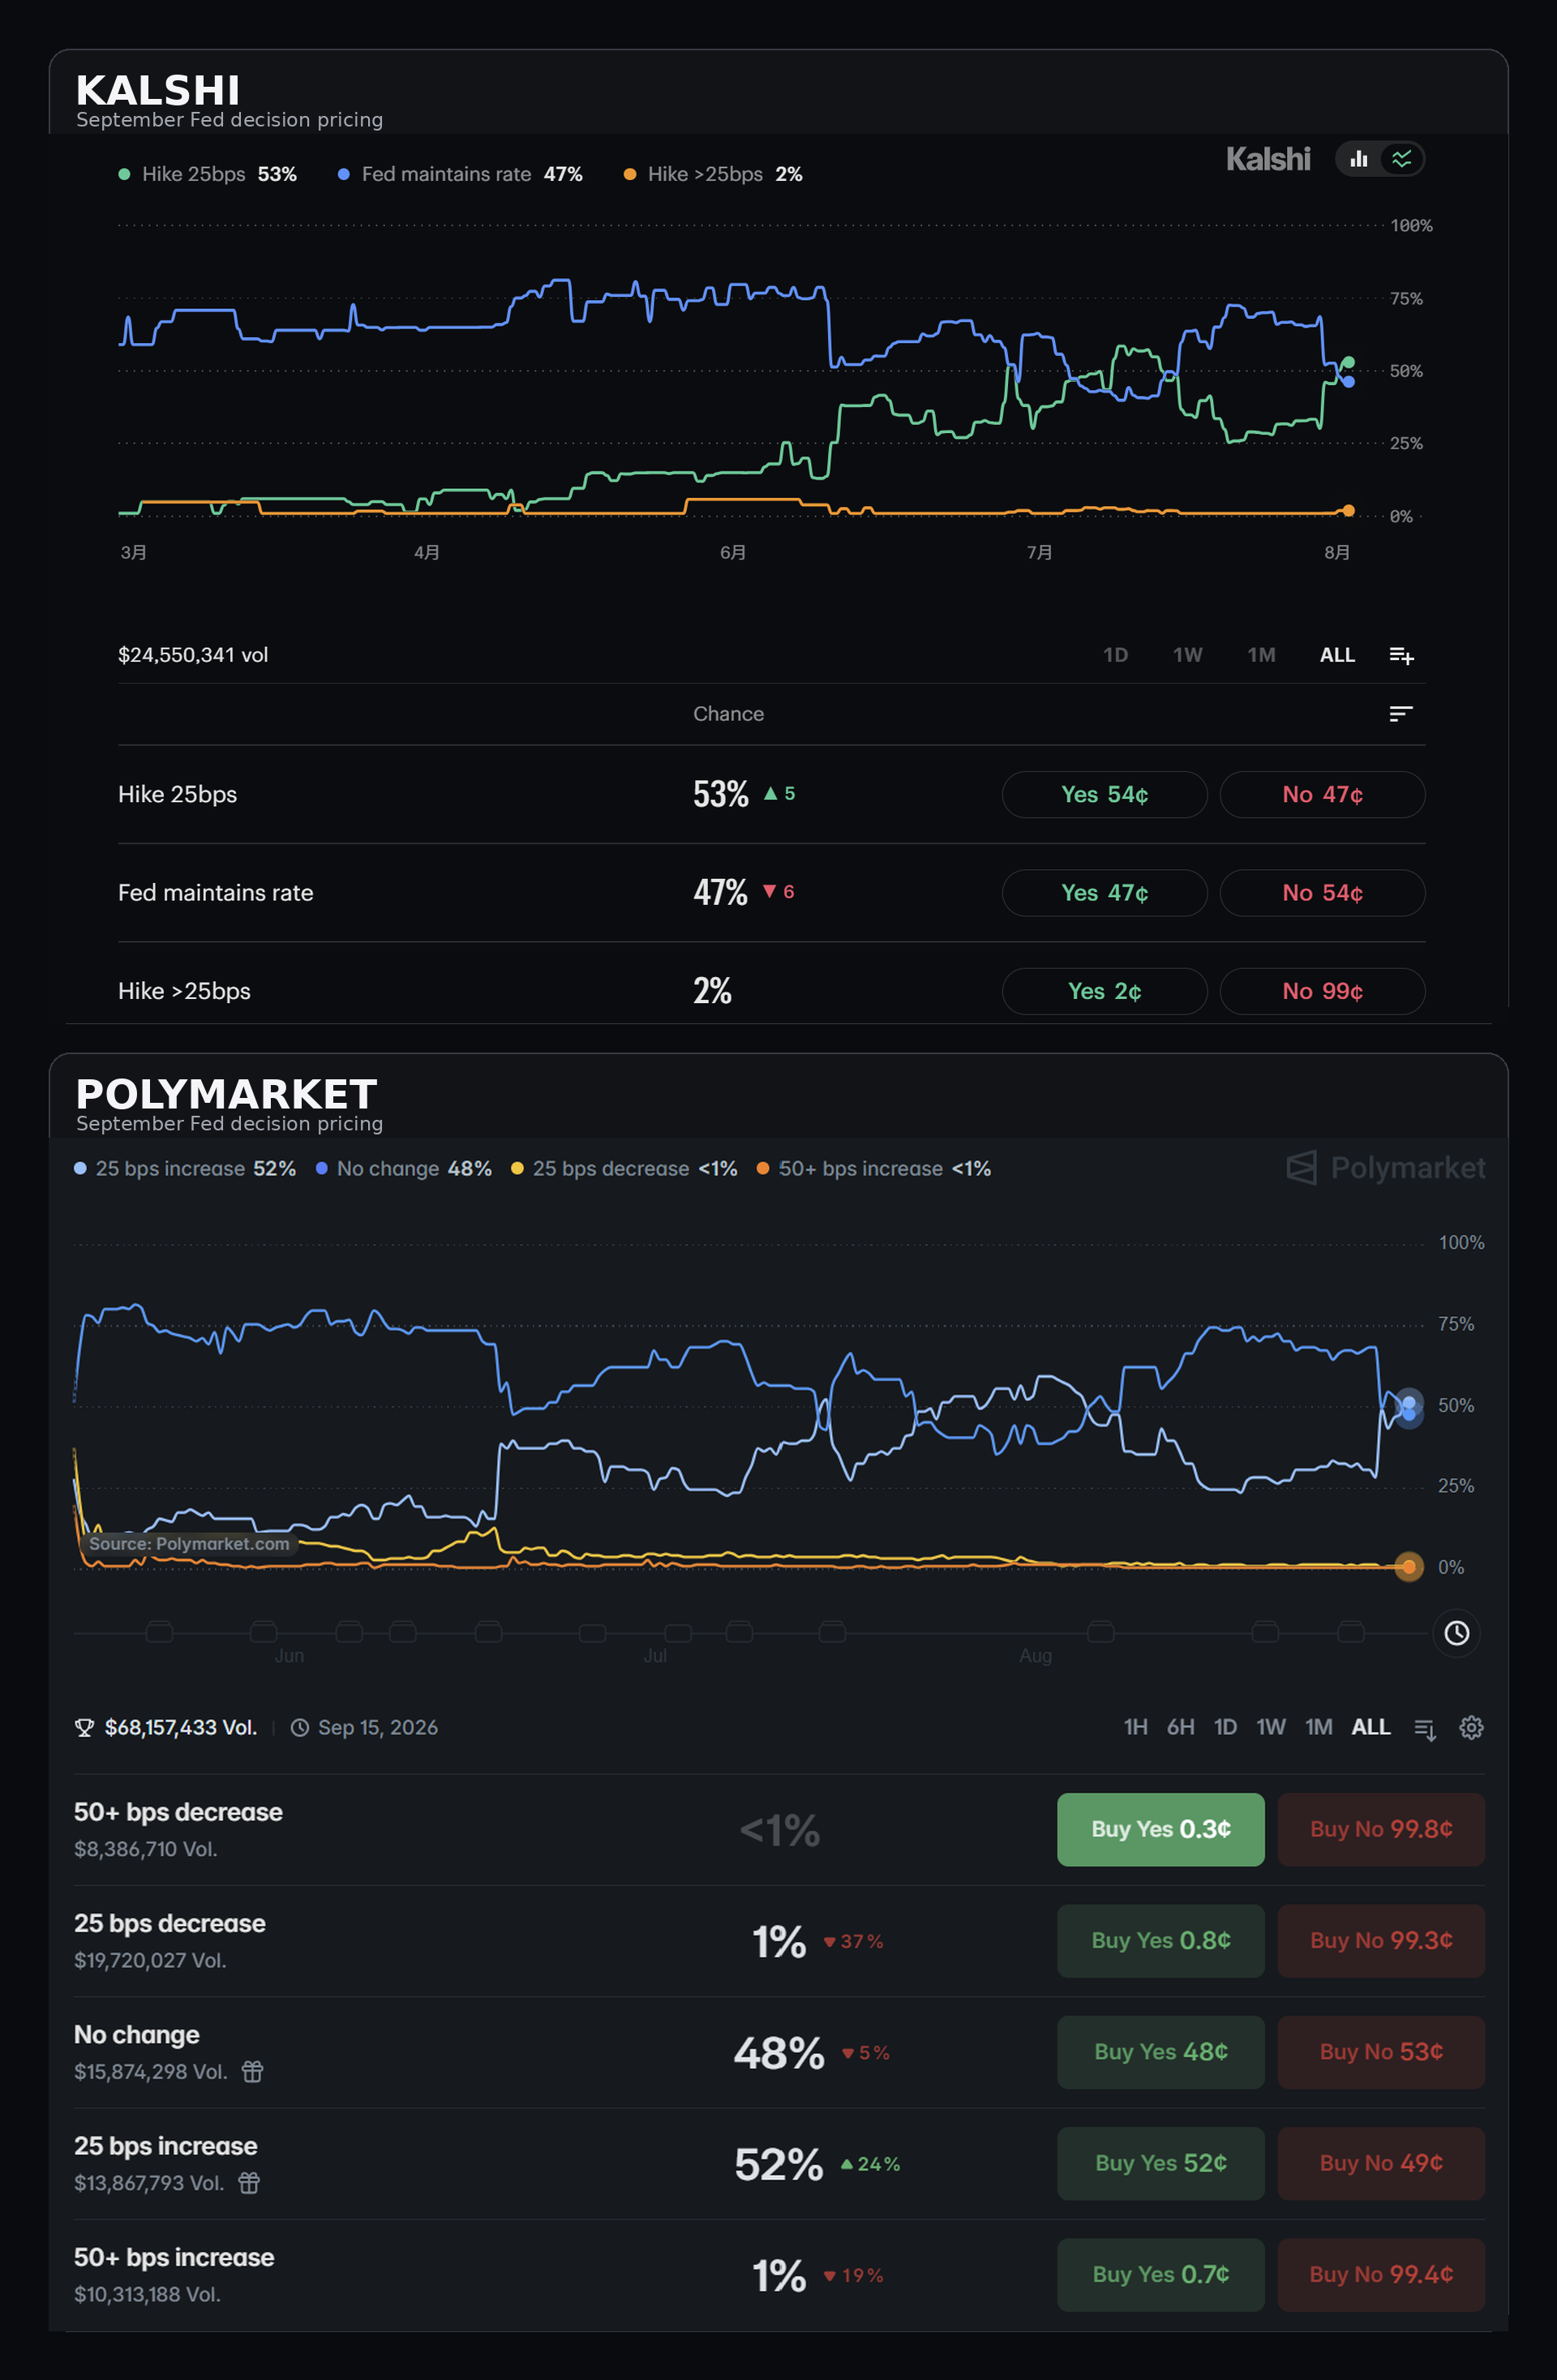
Markets took the message seriously. September hike odds moved above 50% across prediction markets, with Kalshi pricing a 25bp increase at 53% and Polymarket at 52%, while the 2-year Treasury yield rose about 13bp to 4.36%.
The long end remains a different problem. The 30-year yield recently hit 5.327%, its highest since 2007, as fiscal deficits, heavy Treasury issuance and higher term premiums keep borrowing costs elevated.
The next test comes on September 4 with the August Employment Situation report. Economists expect nonfarm payrolls to rise by 58,000 and unemployment to hold at 4.1%, after payrolls unexpectedly fell by 23,000 in July. A stronger jobs print — particularly alongside firm wage growth — could reinforce September hike bets, while another weak report could quickly push expectations back toward a hold.
Washington Secures Long-Term Access to Venezuelan Oil
The US and Venezuela agreed to a 25-year energy framework covering 17 strategic oilfields, with Venezuela targeting production of more than 1.5mn bpd.
Trump said US interests would gain majority control over more than 65bn barrels of proven reserves — roughly one-fifth of Venezuela’s total — although the exact legal and commercial structure is still unclear.
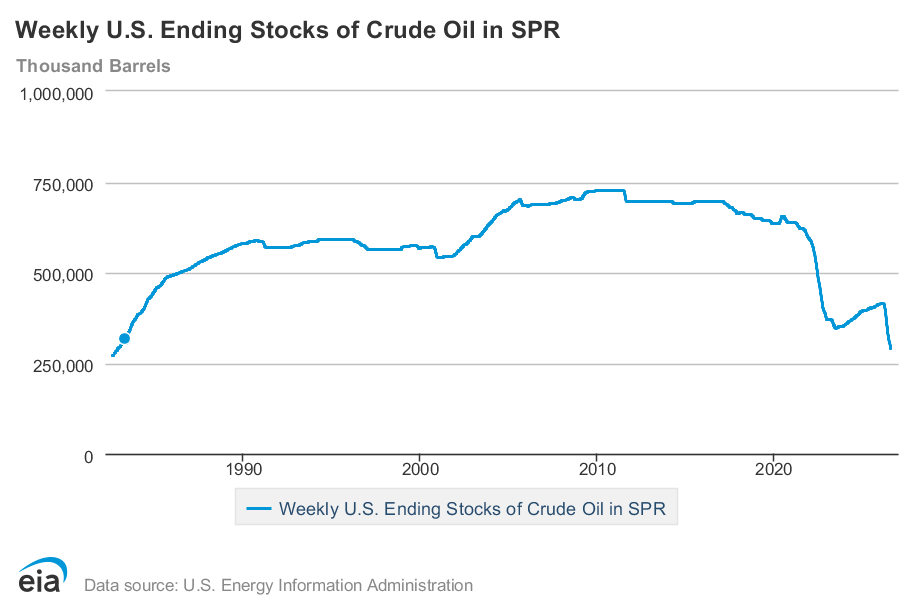
The near-term supply boost may be limited by years of underinvestment, but the agreement could give US refiners a long-term source of heavy crude. Trump also said Venezuelan barrels could be used to refill the Strategic Petroleum Reserve (SPR), now near a 44-year low at around 290mn barrels.
That may help secure supply over the longer term. The more immediate oil risk, however, is coming from Hormuz.
Hormuz Risk Moves Back Into Oil Prices
US forces struck Iranian launchers on Larak Island inside the Strait of Hormuz, bringing the conflict directly into the world’s most important oil chokepoint.
Visible commodity-vessel traffic fell to around five ships a day, from roughly 15 over the previous 10 days. Some of that decline may reflect vessels switching off AIS, rather than an equivalent fall in actual transits.
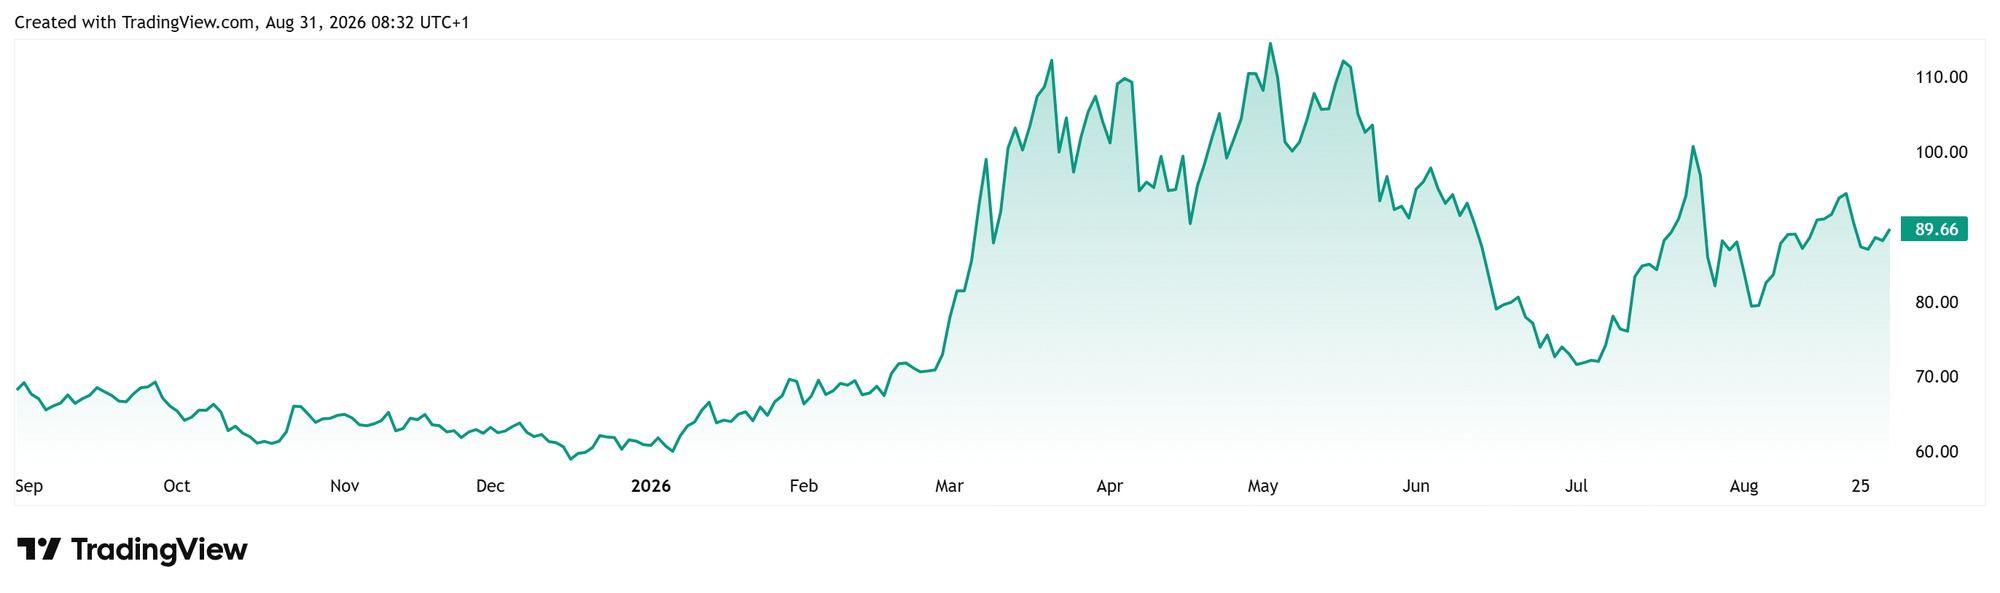
Oil reacted quickly: Brent futures climbed 2.7% to $90.51/bbl in early Monday trading, before later paring gains, while WTI gained 2.55% to $85.53/bbl.
Note: Brent Crude Futures. Source: TradingView
The timing is awkward for markets. Fed hike risk is rising just as geopolitical tensions are putting fresh upward pressure on oil — a combination that could keep both inflation and long-term yields in focus heading into September.
The Kansas City Fed's Jackson Hole symposium has a habit of turning dry policy papers into market-moving events. This year, it might not even need Warsh's help to do it.
The theme is "Financial Innovation: Implications for Payments and Policy." Quite a mouthful for a 49-year-old gathering that runs August 27 to 29 at Jackson Lake Lodge.
At first look, the conference will cover all sorts of plumbing, including instant payments, tokenized deposits, stablecoins, who settles what and how fast.
But this is Kevin Warsh's first Jackson Hole as Fed Chair, and his Friday keynote lands 19 days before a September 16 FOMC decision markets can’t call with any confidence.
There is quite a big question: what happens when digital tokens begin to compete with bank deposits, settlement systems and central-bank money?
Let's follow the dollar.
Do stablecoins matter outside crypto yet?
Not reallyResult
0.00%
They are beginning toResult
0.00%
Yes, they already affect traditional marketsResult
0.00%
I’m not sureResult
0.00%
0 Polls
EndedTBD
Stablecoins are crawling into the funding stack, and it’s bigger than just crypto
Stablecoins are the obvious front-end trade.
Stablecoin.com shows the stablecoin sector sits at $289.5 billion as of August 25, with USDT alone accounting for $183.2 billion, or 63.3% of the market. Together with USDC's $73.6 billion, these two issuers control 88.7% of the market, while the GENIUS Act shoved US payment stablecoins straight into a formal regulatory wrapper.
The first market question is simple: what happens if that number gets another zero?
At ten times the size, the money has to come from somewhere. Some of it will come out of bank deposits, leaving banks to replace cheap retail funding while issuers pile into Treasury bills, repo or bank claims.
Track the tape for discussion of deposit competition, bank funding costs, liquidity rules and redemption rights.
The T-Bill sink: The next macro trade?
Money leaving deposits does not disappear. Stablecoin issuers need somewhere to park reserves, and short-dated government paper is the natural home.
They are already measurable participants in the bill market. The BIS estimates that their combined assets exceeded $270 billion by December 2025 and that they bought nearly $35 billion of Treasury bills during 2025, a flow comparable with purchases by the largest U.S. government money-market funds. Its research finds that a $3.5 billion stablecoin inflow lowered three-month T-bill yields by 0.71 basis points immediately and by around four basis points within ten days, with larger effects when Treasury-market intermediation was strained.
The marginal flow, not the stock, could be the next trade. A burst of Treasury issuance could absorb new demand without much fuss, but if stablecoin buying picks up when the bill market is already strained, it is different, and the effect on yields can become more pronounced.
So stablecoins can pull cheap funding out of banks and recycle it into the front end. The size of the move depends on what Treasury supplies, how quickly issuers buy and how much capacity dealers have to stand in the middle.
But the mechanism can reverse during stress: large redemptions could force issuers to sell reserve assets quickly, transmitting volatility into money markets just when the liquidity is already thin.
Keep an eye on Jackson Hole language around reserve composition, redemption risk and who, if anyone, provides the backstop when the selling starts.
Tokenization turns settlement into a policy question
Tokenization promises to put cash, deposits, securities and collateral onto programmable networks where trade and settlement can happen almost simultaneously.
This seems operational, but it is deeply monetary: if tokenized markets scale, what asset sits at the center of settlement?
Project Agorá has demonstrated atomic cross-border settlement using tokenized deposits and central-bank reserves. Europe is moving further: the ECB's Pontes system is due to begin settling DLT-based transactions in central-bank money in September, with Appia aimed at a wider tokenized ecosystem.
Atomic settlement cuts the risk that one side of a trade goes through while the other does not. But if every trade settles immediately, firms have less room to net positions before cash changes hands. Faster settlement can be safer while also demanding more cash and collateral during the day.
The signal to watch is who policymakers think should own the settlement layer. Europe has explicitly placed central-bank money at the center of wholesale tokenized settlement. The US has so far concentrated more heavily on regulating privately issued payment stablecoins, but that does not yet amount to a settled choice over the architecture of wholesale tokenized markets.
Watch whether policymakers articulate a stronger view on which model they want to encourage, and how they plan to manage the trade-off between faster settlement and greater liquidity needs.
Warsh's speech is doing two jobs at once
Officially, Warsh speaks on payments and financial innovation on Friday, August 28, at 10 a.m. ET. Unofficially, every word gets parsed for rate guidance, because the backdrop he's speaking into is a mess.
As our analysis of the July minutes showed, the three formal dissents understated the committee’s broader conditional hawkishness. Warsh’s keynote is the first major opportunity to clarify what would convert those conditional hawks into votes for a September increase.
The latest data pull in opposite directions. Consumer prices rose 3.4% in the 12 months to July, while payrolls fell by 23,000 against a forecast of +85,000, the third-largest monthly drop since the pandemic and unemployment held at 4.1%. Inflation remains elevated, but the jobs market has lost momentum.
He was regarded as an inflation hawk during his earlier Fed tenure, but has more recently argued that AI-driven productivity could reduce inflationary pressure and leave room for lower rates. Jackson Hole may therefore provide the clearest evidence yet of how he weighs persistent inflation against weakening employment.
Deposit competition can change how banks respond to policy rates. Stablecoin reserves can feed into bill yields. Tokenized settlement can change how much liquidity markets need and where they get it.
Warsh's speech is therefore doing two jobs at once: signaling where rates may go next and setting out how the dollar's changing infrastructure could transmit those rates through the financial system.
What to watch next
Markets will still parse Fed Chair Kevin Warsh's Friday keynote for the usual rate signal. But the more durable tell may come from how policymakers define the boundary between innovation and money.
Three questions matter:
1. Do stablecoins become large enough to alter bank funding?
2. Do issuer reserve flows become large enough to move T-bill yields in normal markets or amplify stress when redemptions hit?
3. And what asset anchors tokenized settlement and does faster settlement change liquidity needs and the transmission of policy rates?
If Jackson Hole starts answering those questions, this year's symposium will be about far more than faster payments. It will be about who controls the financial system’s next operating layer and which assets become the new plumbing of global liquidity.
Which Jackson Hole signals will matter most to markets?
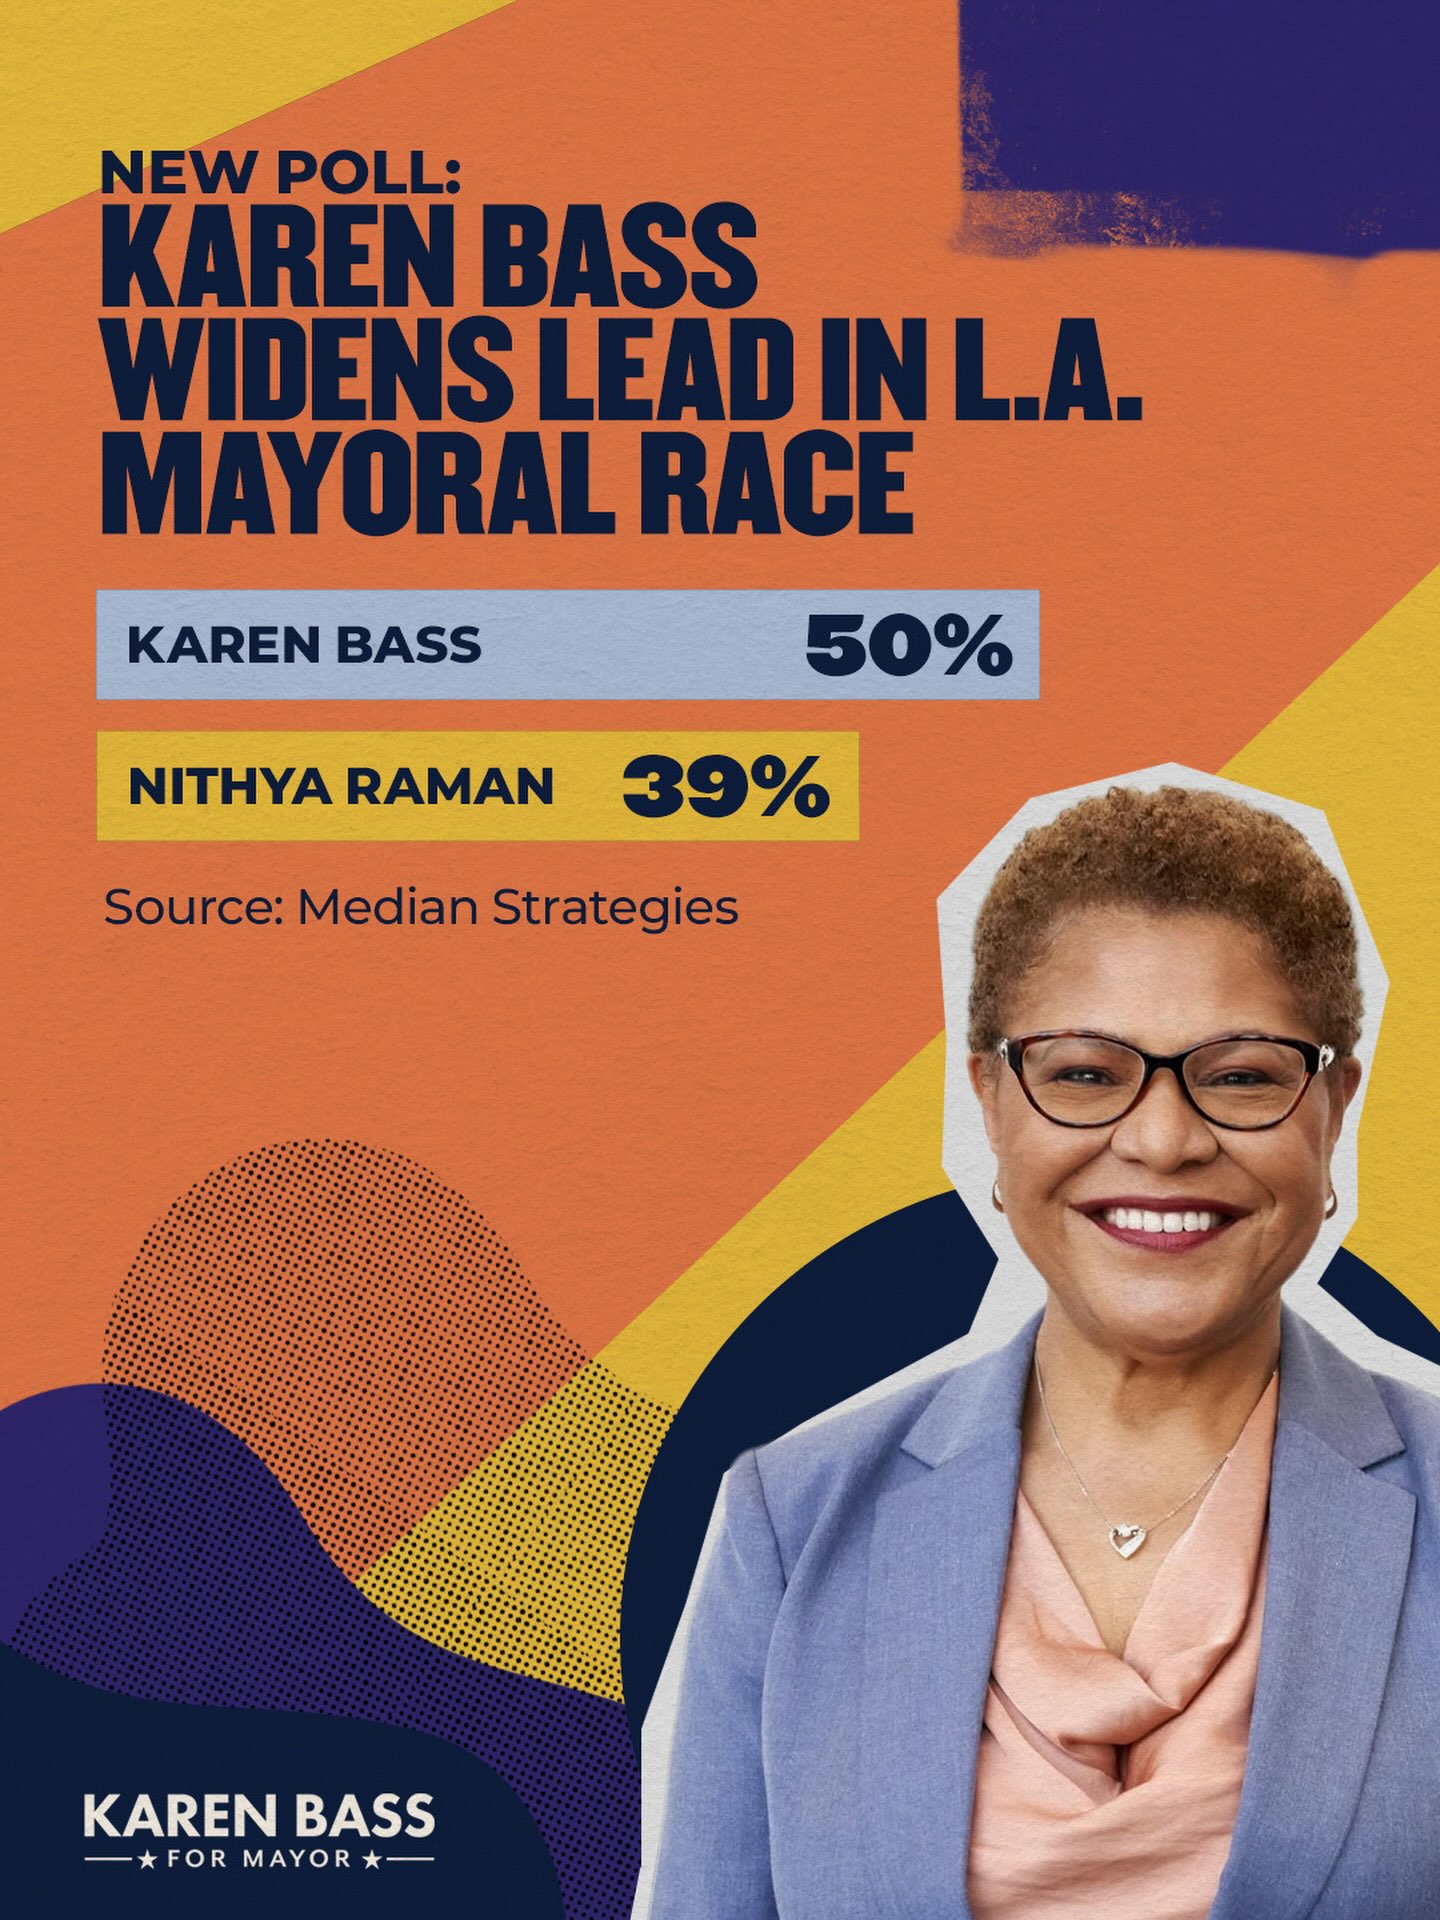
In August, a previously little-known polling firm called Median Strategies released a poll of the Los Angeles mayoral election. The result looked fairly clear: incumbent Mayor Karen Bass led challenger Nithya Raman by nearly 12 percentage points. Median claimed to have surveyed 560 voters and provided a methodology description that looked like something a legitimate polling organization would publish.
Bass's campaign quickly seized on the good news, saying on social media that it showed the campaign was "gaining momentum".
A few days later, people learned there was a problem: those 560 voters did not exist. The poll was fake.
Median Strategies subsequently withdrew all of its polls, saying that it had actually been a "short-term social experiment" designed to observe how easily unverified polling information could enter the political information ecosystem. On August 20, The Guardian went further and identified the person behind the website: Rahil Prakash, a 21-year-old recent college graduate. He said he had carried out the entire project by himself and had also used AI to build the website.
Median did not just fabricate a Los Angeles poll. It also published fake polls in Wisconsin and Nevada. One of them even claimed that Francesca Hong was leading the Wisconsin Democratic gubernatorial primary by more than 20 percentage points. Prediction market prices changed dramatically at the final moment and Hong ultimately lost the race by less than 1 percentage point.
But one important detail is that these fake polls did not automatically produce noticeable moves in prediction markets. The Associated Press tracked trading on Kalshi and Polymarket. After the fake Wisconsin and Nevada data were published, neither platform showed an identifiable market reaction.
Los Angeles was different. After Bass's campaign reposted Median's result, the YES contract on Kalshi for Bass to win the mayoral election rose from about 63 cents to 65 cents, a 2-cent increase in roughly 15 minutes. The reaction on Polymarket was more concentrated. AP found that about six minutes after the relevant post went out, roughly 20 different accounts began trading thousands of contracts favorable to Bass. By contrast, during the week before Bass shared the poll, the market had been extremely quiet, with a typical individual trade worth less than $10.
A previously thinly traded market suddenly saw a cluster of orders all pointing in the same direction after information that was later proven entirely false was amplified by the candidate herself.
The Market May Not Have Believed the Poll. It Believed Bass.
Median had almost no track record of credibility at the time. Its social media accounts had only recently been created, it had just a few dozen followers, and it did not publicly identify a lead pollster whose identity could be verified. The Guardian later found that Prakash himself also had no background at a traditional polling organization.
So if Median Strategies had simply published a "Bass +12" poll on its own, traders could have ignored it entirely. In fact, the Wisconsin and Nevada results suggest that this is largely what they did.
Professional data gatekeepers spotted problems as well. AP reported that The New York Times, RealClearPolitics, and FiftyPlusOne all declined to include Median's polls in their databases. The New York Times said it had not received basic information about the survey methodology or the people running the firm, while FiftyPlusOne found that the Wisconsin poll did not disclose the source of its voter file or the vendor responsible for collecting the sample.
So this is not a story about "nobody being able to identify a fake poll". What is more interesting is that when the Karen Bass campaign later reposted it, the information acquired a second layer of credibility. Traders saw an additional signal: Bass's campaign considered the poll credible enough to promote publicly.
The Advantage of Prediction Markets Also Creates a New Attack Surface
One of the most important theoretical advantages of prediction markets is that monetary incentives can rapidly aggregate dispersed information into prices. If a trader believes the public information is wrong, that trader can bet in the opposite direction. If the trader is right, the trader can make money. This is also why prediction markets are often described as a corrective mechanism for polling, analysts, and media narratives. But there is a mirror-image problem: if the market is willing to pay for new information, then creating new information may itself have economic value.
As early as 2020, legal scholar Tyler Yeargain published a paper that reads almost like a prediction of Median Strategies. The paper examined exactly the scenario in which someone fabricates political polls, moves betting-market prices, and then profits from trading, and argued that under certain factual circumstances, such conduct could constitute commodities fraud or wire fraud.
The CFTC had also described almost exactly the same risk in advance. In its 2024 proposed rule on event contracts, the CFTC specifically noted that inaccurate polling, voter surveys, and false news reporting could distort the price formation of political event contracts. It went on to raise a problem that is distinctive to prediction markets: traditional financial derivatives usually have an underlying cash market and other economic data that can provide a pricing anchor, but political event contracts have no equivalent underlying cash market. Their price formation depends heavily on polling and other informational sources. Those sources are often unregulated, operate through opaque processes, and may not even use reliable statistical methods.
In the stock market, if someone publishes a false rumor about a company, investors can at least check earnings, SEC filings, cash flow, and other asset prices. But "Will Bass win the November mayoral election?" has no corresponding balance sheet. Polls, endorsements, campaign news, fundraising, social media narratives, and insider information are themselves the "fundamentals" of the contract.
The "Social Experiment" Is Not the Most Important Issue
Prakash told The Guardian that he did not trade on prediction markets. Median had also stated that people involved in the project did not hold prediction-market positions related to the elections in question and did not receive any financial benefit. So far, there is no public evidence that he fabricated the polls in order to profit from Kalshi or Polymarket.
But a 21-year-old acting alone, without a large team, mature polling infrastructure, or an obvious financial motive, was still able to use nothing more than a website, some professional-looking methodological descriptions, and social-media distribution to push fabricated data into real political coverage, have it amplified by a candidate, and ultimately see it coincide with real financial trading. Markets can aggregate information very efficiently, but the aggregation mechanism itself does not verify whether that information is true or false. Traditional market surveillance is best at detecting abnormal behavior that occurs inside the market. The risk demonstrated by Median Strategies, however, may originate outside the market.
Disclaimer: The content is for informational purposes only. You should not construe any such information or other material as legal, tax, investment, financial, or other advice. Nothing contained in this article constitutes a solicitation, recommendation, endorsement, or offer by the author(s) or any third party service provider to buy or sell any securities or other financial instruments in your or in any other jurisdiction in which such solicitation or offer would be unlawful under the securities laws of such jurisdiction. The author(s) report(s) no conflict of interest.
TotalEnergies says Hormuz crude shipments remain profitable despite war-risk costs adding roughly $20mn per VLCC voyage, because Iraqi and Qatari barrels are being sold at steep discounts.
Iran has threatened 45 tankers with fines, detention and cargo confiscation, while also warning that vessels conducting STS transfers with blacklisted ships could face penalties.
VLCC rates have surged to record levels as crude increasingly moves through STS transfers, pipelines and longer detours, with benchmark TD3C earnings reaching about $624,000/day.
Will Iran add more tankers to its Hormuz blacklist by the end of October 2026?
YesResult
0.00%
NoResult
0.00%
0 Polls
EndedTBD
TotalEnergies Is Still Making Hormuz Work
TotalEnergies Chief Executive Patrick Pouyanné said the company is continuing to move heavily discounted crude from Iraq and Qatar through the Strait of Hormuz because the trade remains profitable despite sharply higher transport costs.
Iraqi Crude Discounts Widened Sharply in August
SOMO crude discounts by loading window
Loading window
Basrah Medium
Basrah Heavy
July loading
−$14/bbl
−$18.8/bbl
Aug 1–10
−$27/bbl
−$29.8/bbl
Aug 11–20
−$26/bbl
~−$28–29/bbl
Aug 21–31
−$25/bbl
−$27.8/bbl
Discounts widened sharply in August as higher Hormuz-related freight,
insurance and security costs increased the cost of lifting crude from inside the Gulf.
Source: Argus Media; SOMO
Crude oil are being offered at around $50–60 per barrel, compared with Brent above $90. Pouyanné estimated that moving a VLCC through Hormuz and back now adds roughly $20mn, about $10 per barrel for a 2mn-barrel cargo, largely reflecting war-related risks.
As long as the crude discount remains larger than the additional shipping cost, buyers still have an incentive to take the barrels.
That does not mean the current system is sustainable. TotalEnergies is also backing alternative export infrastructure, including the proposed Baghdad–Syria pipeline and an expansion of the Habshan–Fujairah pipeline, which currently has capacity of about 1.8mn bpd.
Iran Extends Pressure to Tankers and STS Transfers
At the same time, Iran is increasing the legal and operational risk around Hormuz traffic.
Authorities have threatened 45 tankers with fines, detention and potential cargo confiscation for alleged violations of transit rules. Iran has also warned that vessels conducting ship-to-ship transfers with blacklisted ships could face similar penalties.
That matters because STS has become an increasingly important part of the workaround for disrupted Gulf crude flows.
What initially functioned as an alternative logistics route is therefore becoming part of the enforcement perimeter itself. For shipowners and charterers, the issue is no longer only physical security in the strait, but also counterparty screening, insurance exposure and the risk attached to STS participation.
VLCC Rates Hit a Record High as Crude Routes Grow More Complex
The disruption is also showing up directly in tanker earnings.
Middle East crude is increasingly moving through combinations of STS transfers, pipeline movements, vessel repositioning and longer seaborne detours rather than straightforward Gulf-to-Asia voyages.
Those additional steps consume more vessel-days without requiring higher underlying crude volumes, tightening effective VLCC supply.
On August 24, Baltic Exchange benchmark TD3C Middle East Gulf–China VLCC earnings reached about $624,388 per day, or Worldscale 606, an all-time high.
MEG–China VLCC Earnings Surge to a Record High
Source: Baltic Exchange; Lloyd’s List
Lloyd’s List noted that strong refining economics and heavily discounted crude are allowing charterers to tolerate freight costs that would normally look prohibitive. The result is an unusual tanker market in which disrupted trade is not necessarily reducing demand for ships; instead, each barrel is becoming more shipping-intensive.
Hormuz is still moving crude, but through a much more expensive and complicated system.
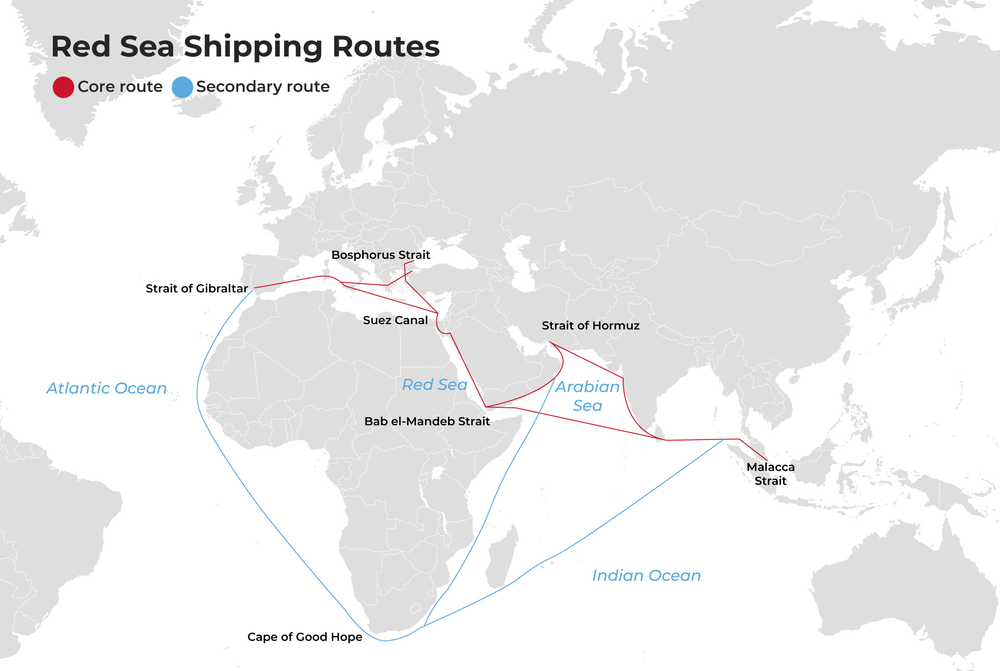
On August 10, 2026, Maersk and Hapag-Lloyd announced that another container service in the Gemini shipping network would resume transiting the Red Sea and the Suez Canal. The two companies had already begun restoring Suez transits on some Asia-Europe services in July. This suggests that global shipping companies are once again testing a route that they had largely abandoned over the previous two years.
But this is still far from a full return. As of August 13, Maersk had restored only about one-third of its normal Red Sea and Suez traffic, with just 4 of the 13 relevant services returning to the route. The company believes that conditions in 2026 are now sufficient for a full resumption, but it has nevertheless chosen to adjust its network gradually.
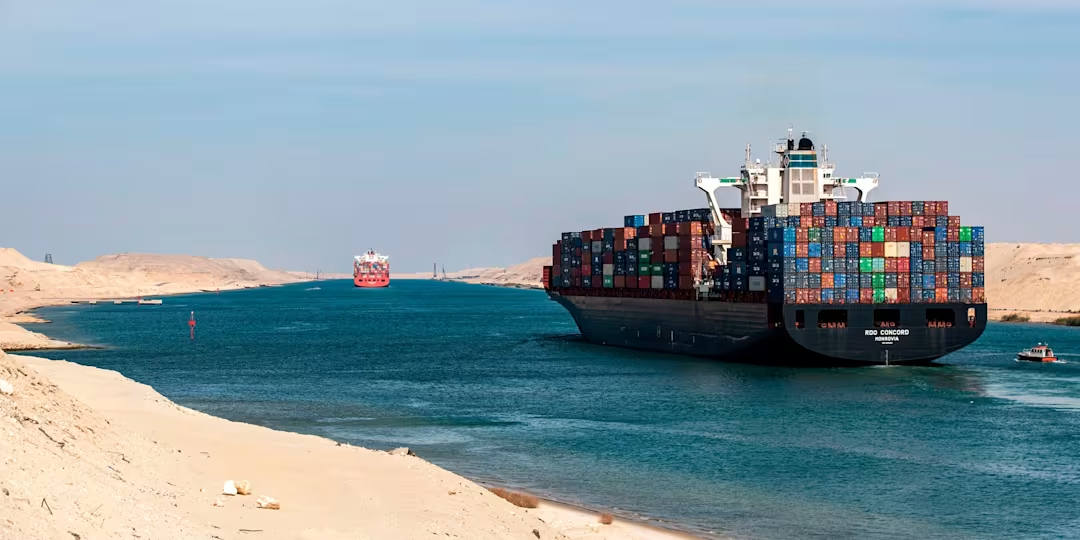
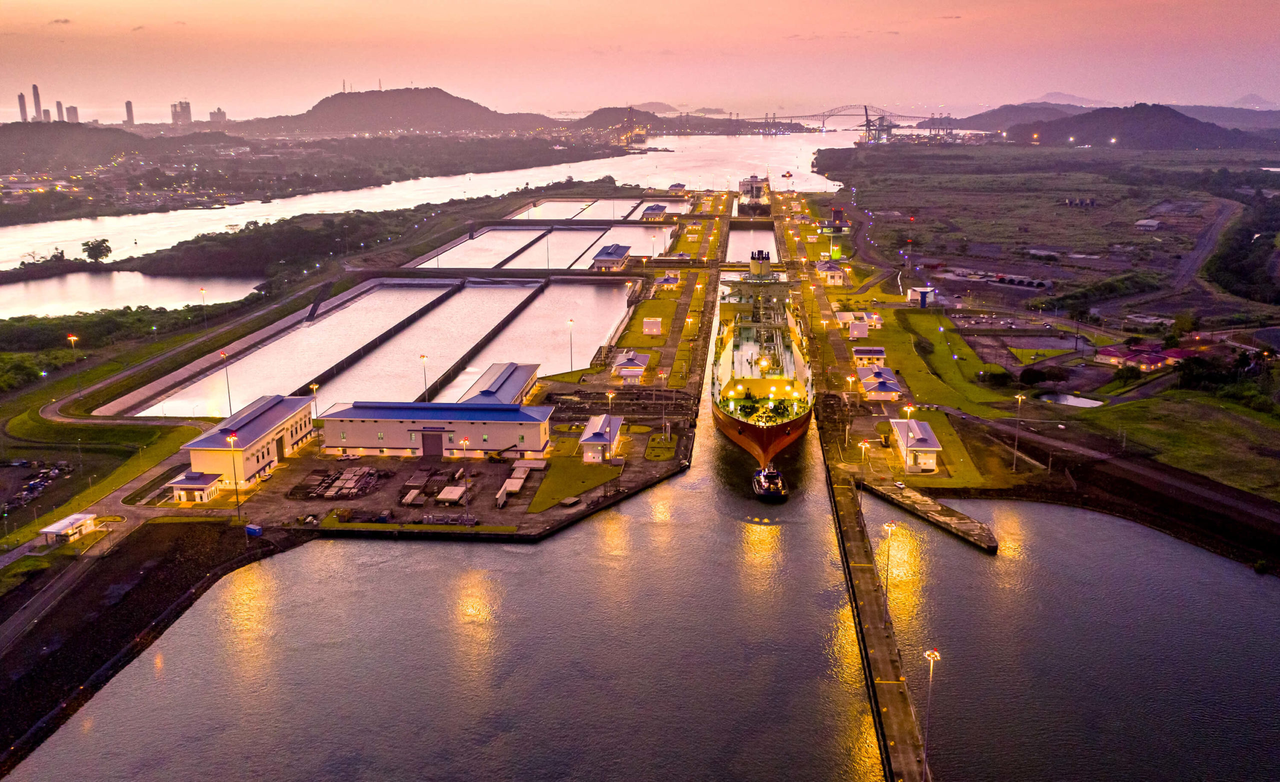
Unlike the Panama Canal, the Suez Canal did not impose draft restrictions because of water shortages, nor did infrastructure damage cause a prolonged reduction in transit capacity. The Suez Canal is a sea-level canal with no locks. Ships entering from the Mediterranean do not need to be raised to an artificial lake and then lowered back to sea level, as they do in the Panama Canal. The Suez Canal Authority explicitly describes it as the longest canal in the world without locks.
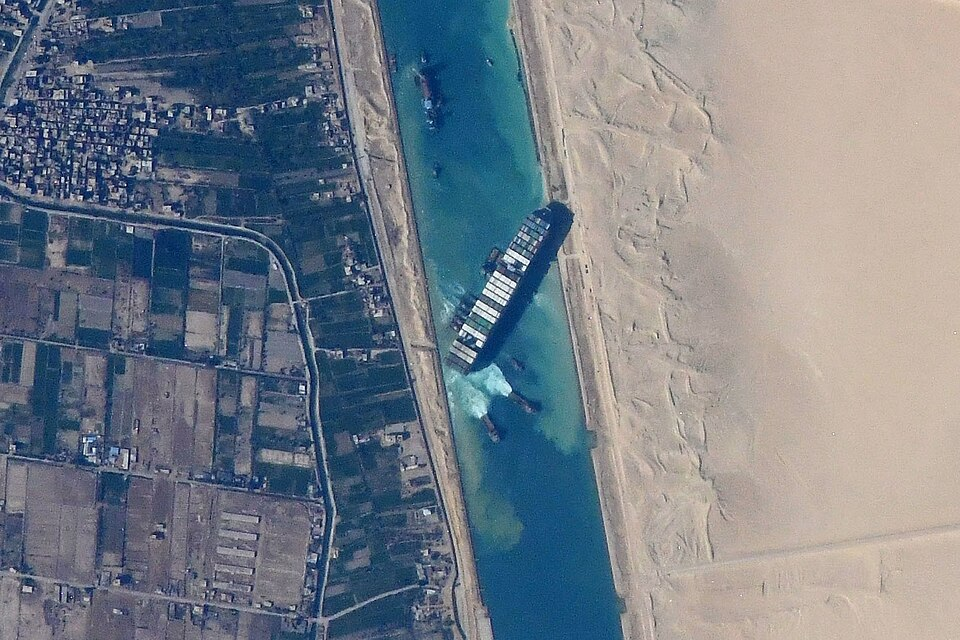
Of course, the Suez Canal is still subject to physical constraints such as channel depth, dredging requirements, windblown sand, accidents, and vessel size. The grounding of the Ever Given in 2021 demonstrated that an accident can temporarily shut down the entire waterway.
The container ship Ever Given stuck in the Suez Canal in Egypt, viewed from the International Space Station. (Image: NASA JSC ISS image library)
Yet traffic still largely disappeared. In 2023, 26,434 vessels transited the Suez Canal, representing 1.568 billion net tons. In 2024, that fell to just 13,213 vessels and 525 million net tons. In 2025, traffic remained at only 12,758 vessels and 522 million net tons. In other words, the number of vessels transiting the canal in 2025 was still less than half the 2023 level.
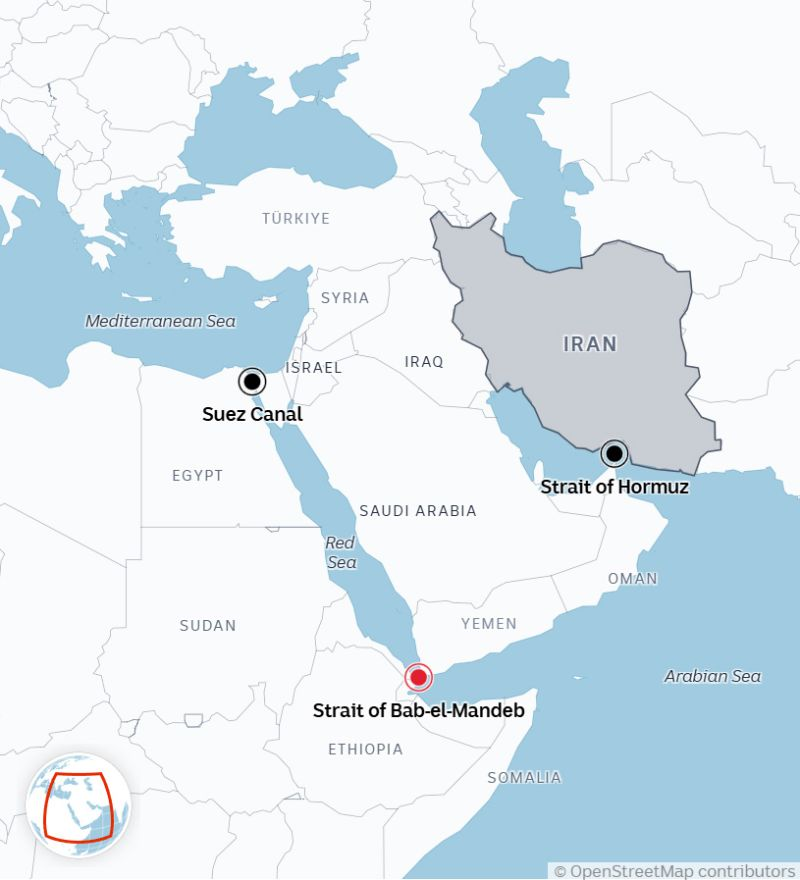
The Suez Canal's problem is primarily one of route substitution. The physical capacity is still there, but security risk determines whether shipowners are willing to use it. And to understand why, we need to look about 1,500 miles south, to the Bab el-Mandeb Strait between Yemen and Djibouti.
Suez and Bab el-Mandeb Are Effectively One Piece of Infrastructure
For a container ship sailing from Singapore to Rotterdam, the full route for “going through Suez” is: Indian Ocean -> Bab el-Mandeb -> Red Sea -> Suez Canal -> Mediterranean -> Europe.
Economically, this means Bab el-Mandeb and the Suez Canal function as two nodes in series. If the Suez Canal is closed, the Asia-Europe shortcut cannot be used. If Bab el-Mandeb becomes dangerous enough that shipowners are unwilling to transit it, the outcome is effectively the same.
That is what has happened since 2023. Houthi attacks from Yemen have been concentrated mainly in the southern Red Sea and around the Bab el-Mandeb Strait, yet Egypt, some 1,500 miles away, has suffered enormous economic losses. Before the crisis, UNCTAD estimated that the Suez Canal carried around 12% to 15% of global trade in 2023. After the Red Sea conflict began, Suez Canal transits had fallen by about 42% from their previous peak by early 2024, while weekly container ship transits at one point dropped by 67%.
This illustrates an important feature of chokepoints: they do not need to be physically blocked to lose their economic function. They only need to become sufficiently costly or sufficiently dangerous to use.
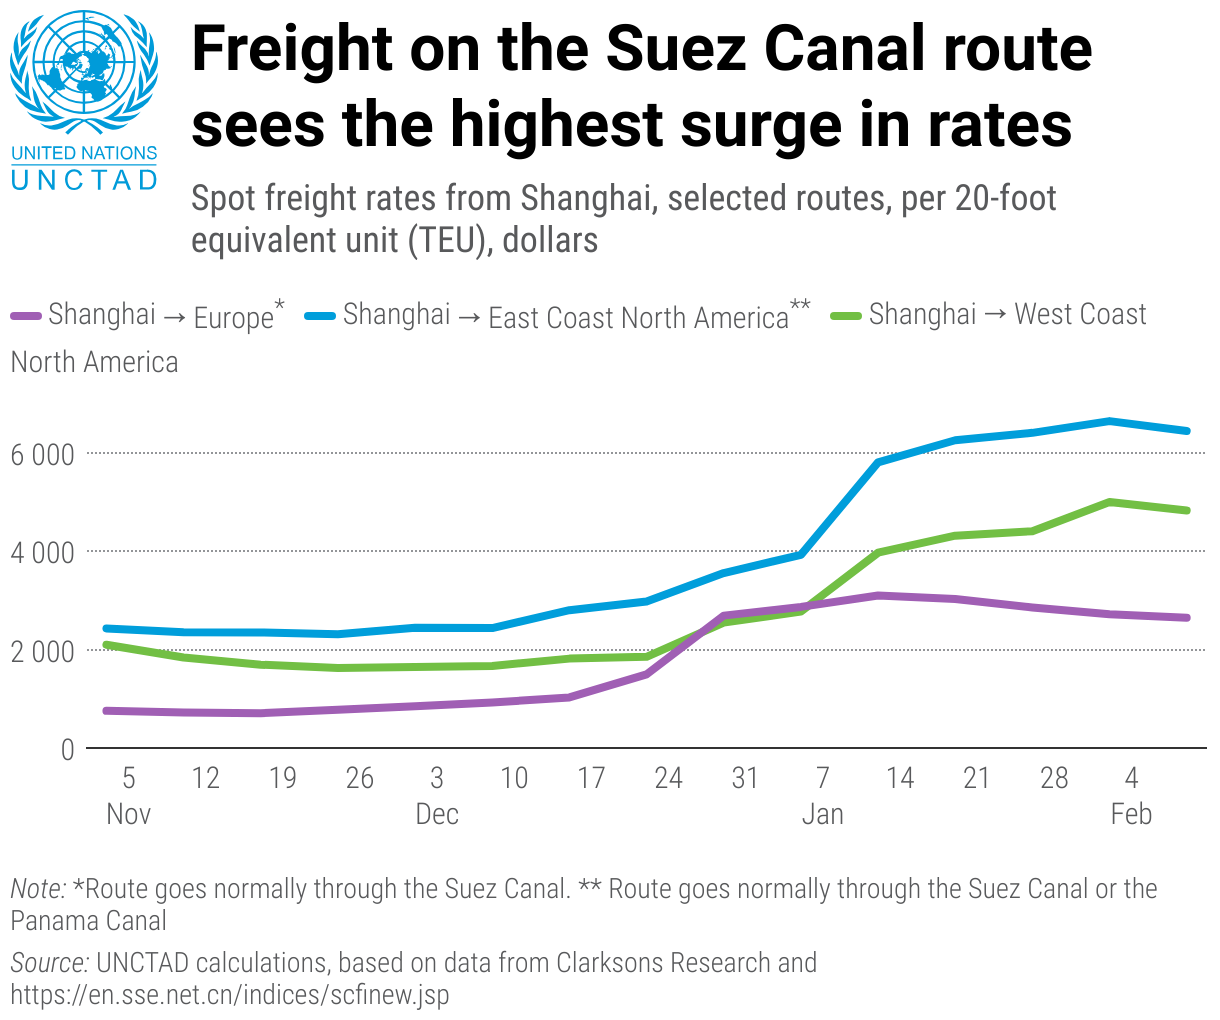
Data shown for Nov 2023 - Feb 2024
What Suez Really Sells Is “Not Having to Sail Around Half of Africa”
The economics of the Suez Canal do not require a complicated model. What it really sells is the convenience of not having to sail around Africa.
The official voyage-distance data from the Suez Canal Authority make this very clear. From Singapore to Rotterdam:
Via the Suez Canal: 8,288 nautical miles
Via the Cape of Good Hope: 11,755 nautical miles
Distance saved: 3,467 nautical miles (-29%)
At an average speed of 16 knots, 3,467 nautical miles translates into roughly nine additional days of pure sailing time. Actual commercial voyage times depend on factors such as slow steaming, weather, port schedules, and vessel speed, but freight companies typically estimate that rerouting Asia-Europe voyages around the Cape of Good Hope adds about 10 days.
As long as the cost of transiting Suez is lower than the cost of rerouting around the Cape of Good Hope, the canal remains attractive. If Red Sea security risks push the first option above the second, ships will sail around Africa instead.
The economic value of the Suez Canal can therefore be understood, in simplified form, as Avoided Cape Cost - Canal Toll - Red Sea Risk.
Source: seasonalliving
When it comes to canal tolls, the Suez Canal Authority does not charge a simple flat rate such as “$500,000 per ship.” Base transit dues are calculated according to Suez Canal Net Tonnage, vessel type, whether the vessel is laden or in ballast, and other conditions. Different vessel categories are subject to different rates, with various surcharges, rebates, and special-route discounts layered on top.
Economically, this makes sense. A large crude oil tanker, a 20,000 TEU container ship, and a small bulk carrier face very different costs if they have to reroute around the Cape of Good Hope, so their willingness to pay for the Suez shortcut naturally differs as well.
The SCA also actively adjusts prices in response to shipping-market conditions. At the height of the Red Sea crisis, Egypt needed to attract ships back.
In May 2025, the SCA offered a 15% rebate on transit dues to large container ships with a Suez Canal Net Tonnage of 130,000 tons or more. One of the direct objectives was to help shipping companies offset the higher insurance costs associated with operating through the high-risk Red Sea. But as shipping conditions changed, the SCA suspended the 15% rebate from April 7, 2026.
Then, from July 15, 2026, temporary surcharges for several vessel categories were raised again. Kuehne+Nagel summarized these adjustments. Laden crude oil tankers were required to pay a 37% surcharge on top of normal transit dues, compared with 27% for ballast tankers, 22% for dry bulk carriers, 19% for LNG carriers, and 12% for container ships.
This sequence of offering a rebate, withdrawing it, and then raising surcharges reveals the essence of Suez pricing quite clearly: the SCA is pricing the economic value created by allowing ships to avoid sailing several thousand extra nautical miles. But it cannot raise prices without limit. The Cape of Good Hope remains an open-access competing route outside the Suez Canal, placing a natural ceiling on the SCA’s pricing power. So although the Cape of Good Hope lies thousands of kilometers from Egypt, it effectively participates in the price discovery of Suez Canal transit fees.
The 2026 Hormuz Crisis Put the Entire System Through an Even Greater Stress Test
If Suez and Bab el-Mandeb were already complicated enough, the 2026 Hormuz crisis added another layer.
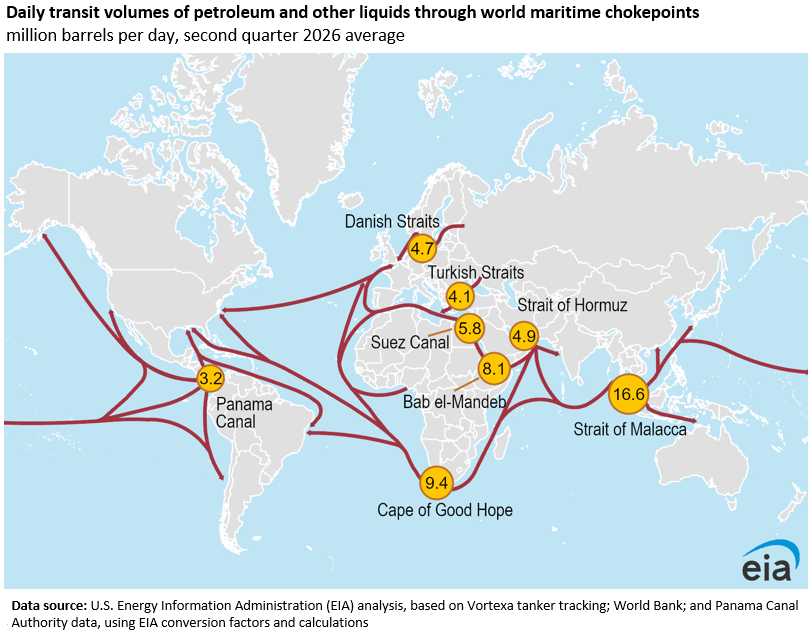
EIA data show that crude oil and petroleum products flow through the Strait of Hormuz averaged about 21.6 million barrels per day in the fourth quarter of 2025. By the second quarter of 2026, that had fallen to just 4.9 million bpd. At the same time, oil flows through Bab el-Mandeb increased from 5.4 million bpd in the fourth quarter of 2025 to 8.1 million bpd in the second quarter of 2026.
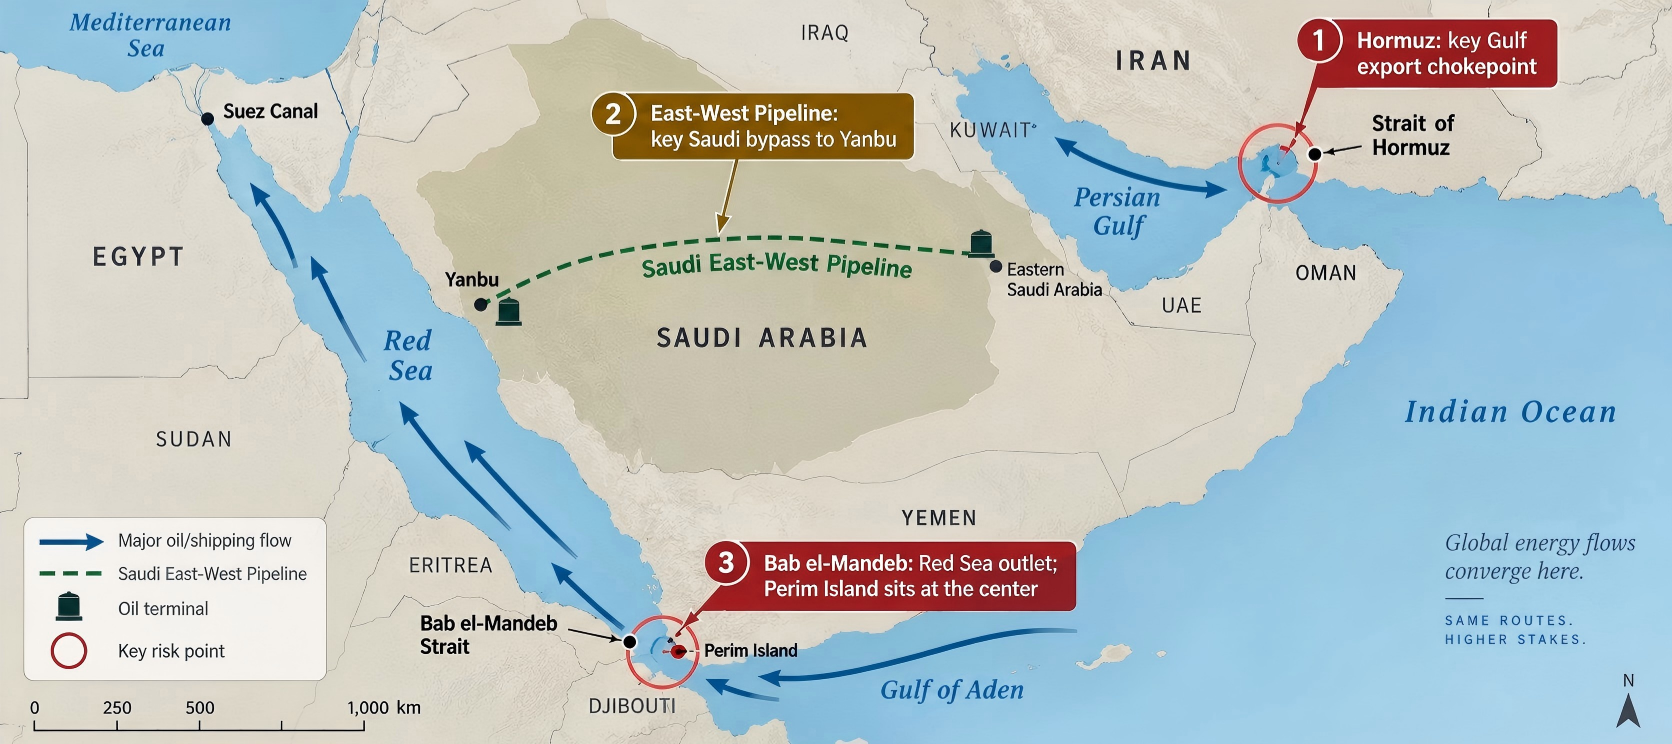
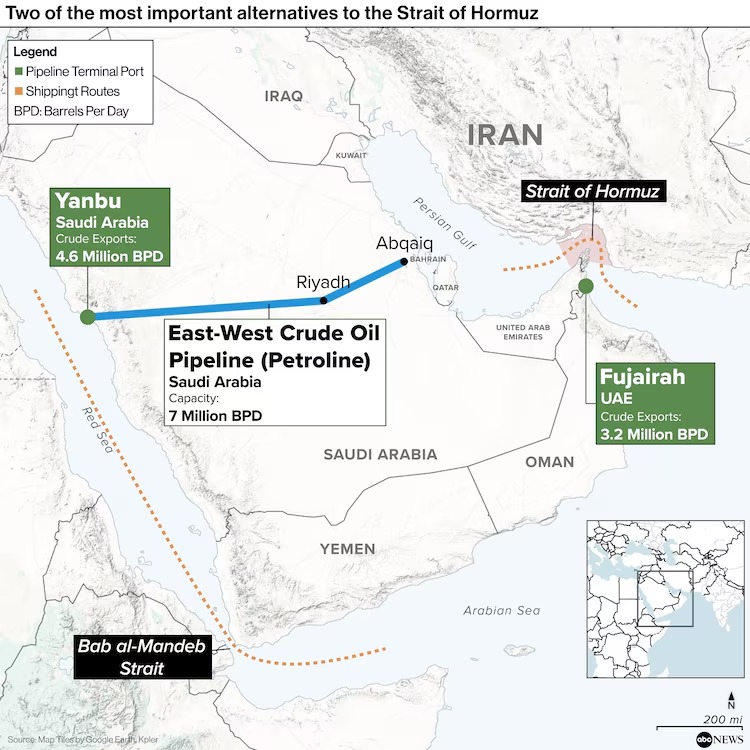
This is because Saudi Arabia has the East-West Pipeline, also known as Petroline, a strategic asset that many other Gulf oil producers do not have. The pipeline is about 1,200 kilometers long and connects Saudi Arabia's eastern oil fields with the Red Sea port of Yanbu. Its current maximum crude capacity is about 7 million barrels per day, of which roughly 2 million bpd supplies west coast refineries and about 5 million bpd can be used for exports. After Hormuz was severely disrupted, the pipeline quickly became one of Saudi Arabia's most important alternative export routes. Saudi Arabia could therefore send a barrel of crude that would otherwise have been exported from the Persian Gulf directly to the Red Sea. At that point, Hormuz had been successfully bypassed.
Image: abc News; Map Tiles by Google Earth, Kpler
From Yanbu, Saudi crude then faces two directions.
To Europe, it can head north: Yanbu → Red Sea → Suez/SUMED → Mediterranean → Europe
To Asia, it can head south: Yanbu → Bab el-Mandeb → Indian Ocean → Asia
This gives the East-West Pipeline enormous strategic value.
But in July 2026, risks around Bab el-Mandeb also rose rapidly. This produced an extremely counterintuitive route. A barrel of Saudi crude sold to Asia began by sailing in the direction of Europe. The tanker first headed north into the Mediterranean, then sailed west through the Strait of Gibraltar, around the entire African continent, and finally re-entered the Indian Ocean. The voyage increased from 19 days to 48 days, while fuel costs rose from about $1.26 million to around $2.87 million. On top of that, transiting Suez itself also requires paying canal tolls.
SUMED Means the “Suez” Corridor Is Not Actually a Single Route
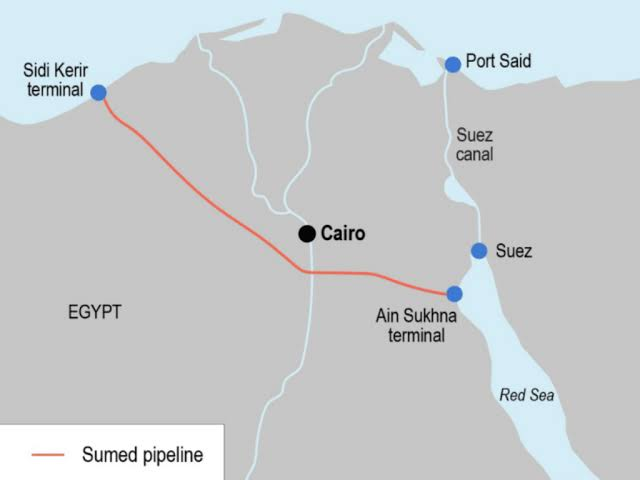
For oil, the Suez corridor consists not only of the Suez Canal, but also the SUMED Pipeline. SUMED connects Ain Sokhna on the Red Sea side with Sidi Kerir on the Mediterranean side and has a transport capacity of about 2.5 million barrels per day. When large VLCCs cannot transit the Suez Canal fully laden because of draft restrictions, they can discharge part of their crude into SUMED and have it handled or reloaded on the Mediterranean side.
In the second quarter of 2026, the Suez Canal and SUMED together transported about 5.8 million barrels per day of crude oil and petroleum products, including around 3.6 million bpd of crude and condensate. As risks around Bab el-Mandeb worsened, this northbound export route became even more important. In one week in early August, crude and condensate loadings at Sidi Kerir reached a record 2.17 million bpd, up about 50% from the previous week, with Saudi crude accounting for roughly 90%.
Image: Logistics Middle East
Saudi Arabia is now even considering expanding the East-West Pipeline by another 1 million to 2 million barrels per day. Reuters reported that such an expansion would require several years and billions of dollars in investment, and that Saudi Arabia has also discussed with some neighboring countries the possibility of using this export network in the future.
At the End of Every Escape Route May Lie the Next Chokepoint
If you look only at a map, Hormuz, Bab el-Mandeb, and Suez appear as three separate red dots. In reality, they are part of an interconnected transport network. When one node is disrupted, the cargo does not simply disappear. Some production may be forced to shut down, and some cargo may go into storage, but large volumes will still seek alternative routes. As a result, disruption at one chokepoint becomes additional traffic, congestion, risk, and price pressure at other chokepoints.
The Panama Canal shows us that a global shipping route can be constrained by something as seemingly local as freshwater. Suez and Bab el-Mandeb show us that a canal that remains completely open and has ample physical capacity can still lose more than half of its customers because of security risks 1,500 miles away. The 2026 Hormuz crisis goes one step further: even building a hugely valuable alternative oil pipeline and successfully moving oil away from one chokepoint does not mean escaping geography. Saudi Arabia's East-West Pipeline does bypass Hormuz. But once it delivers the oil to Yanbu, there are still only two choices: head north through Suez, or head south through Bab el-Mandeb. When the southern route also becomes dangerous, a barrel of Saudi crude that would normally take just 19 days to reach Asia may instead have to travel north through Suez, pay about $1 million in canal tolls, sail around the entire African continent, and take 48 days to reach Asia.
The real economics of global chokepoints is never just about how many ships a particular canal can handle. It is also about how much more the second route costs when the first route fails, how much more time it consumes, how much additional shipping capacity it ties up, and which chokepoint it must ultimately pass through. In the global shipping network, every escape route may end at the next bottleneck.
Disclaimer: The content is for informational purposes only. You should not construe any such information or other material as legal, tax, investment, financial, or other advice. Nothing contained in this article constitutes a solicitation, recommendation, endorsement, or offer by the author(s) or any third party service provider to buy or sell any securities or other financial instruments in your or in any other jurisdiction in which such solicitation or offer would be unlawful under the securities laws of such jurisdiction. The author(s) report(s) no conflict of interest.
On August 5, 2026, the Panama Canal Authority announced another tightening of draft restrictions for large vessels. Starting August 26, the maximum allowable draft for Neopanamax vessels will be reduced to 48 feet. From September 3, it will be lowered further to 47.5 feet and remain at that level until further notice.
Under normal conditions, when the water level of Gatún Lake reaches 85 feet, Neopanamax vessels can operate at a maximum draft of 50 feet. In other words, the fundamental problem is that there is simply not enough water in the lake. More interestingly, the Authority has not, for now, reduced the number of vessels allowed to transit the canal each day.
Source: the U.S. EIA
Meanwhile, another price at the canal is surging. According to the Financial Times, the average winning bid for the Panama Canal’s daily auctioned transit slots has reached about $1.1 million so far in August 2026, more than 16 times the level recorded during the same period last year. Slots for the larger locks have averaged about $2.5 million, with individual bids reaching as high as $3.78 million. On August 3, around 113 vessels were waiting to transit the canal, compared with just 40 on January 2.
These two seemingly different developments are actually pointing to the same underlying issue: the Panama Canal is not merely selling access to a waterway. What it is really selling is interoceanic transportation capacity created by freshwater. Once you understand this, the economics of the Panama Canal look completely different.
Average auction price for transit slots, late Jan 2024 - early Aug 2026
The Panama Canal Is Essentially a Giant "Freshwater Elevator"
Many people picture the Panama Canal as a waterway dug through the land to connect the Atlantic and Pacific Oceans. If that were really the case, water shortages should not be a major problem. The Suez Canal, for example, is a sea-level canal, where ships travel through at roughly the same elevation.
But the Panama Canal is different. After entering the canal from sea level, ships must be lifted step by step through a series of locks until they reach Gatún Lake, about 85 feet above sea level. They then sail across the isthmus before descending through another set of locks back to sea level on the other side. The process is powered not by giant pumps, but primarily by gravity and freshwater. In other words, every time a ship crosses the Isthmus of Panama, some of the freshwater stored in the lakes must be released.
Map of the Panama Canal (Image: Thomas Römer/OpenStreetMap data)
World Weather Attribution estimates that operating the Panama Canal’s locks requires about 7 billion liters of water per day from the rain-fed Gatún Lake.
Operational data from the Panama Canal’s 2025 fiscal year show that the average volume of water involved in each Panamax transit was about 0.194 hm³, while a Neopanamax transit involved about 0.4368 hm³, equivalent to 436,800 cubic meters. It is important to note that this official metric refers to average operational water use. It does not mean that all of this water is permanently "consumed", because the newer locks incorporate water-recycling systems.
The Panama Canal’s actual usable transportation capacity therefore depends on reservoir storage + rainfall replenishment + water-use efficiency per transit + lock operating capacity.
This is very different from an ordinary port. Expanding a conventional port usually means adding terminals, cranes, berths, and deeper navigation channels. The expansion of the Panama Canal, however, produced a much more unusual result: the physical capacity created by steel and concrete can exceed the capacity that the natural water cycle can sustainably support. The 2016 expansion solved the problem of ships being "too large", but it did not fundamentally solve the question of whether there would be enough water. That is why the marginal resource determining the Panama Canal’s effective transportation capacity today is not concrete, but rain.
Seasonality chart of water levels of the man-made Gatún Lake
Limiting Weight Before Limiting Ship Numbers
This time, the Panama Canal Authority has specifically emphasized that it is not currently reducing the number of vessels allowed to transit the Panamax or Neopanamax locks each day. That point is extremely important. If you look only at the headline figure for "how many ships transit each day", you might conclude that the canal is still operating normally and that the problem is not particularly serious.
But when measuring transportation capacity, the unit that really matters is cargo per day, not ships per day.
Draft is the depth to which a ship’s hull sits below the waterline. The heavier the ship is loaded, the more water it displaces and the deeper its draft becomes. When the water level in Gatún Lake falls, the navigation channel can safely accommodate less draft, meaning that a vessel that would normally transit at a 50-foot draft may have to reduce fuel, ballast water, or cargo.
In practice, the Authority therefore has two separate control valves: how many ships are allowed to transit each day + how heavily each ship is allowed to load. During the extreme drought of 2023, both valves were used. At the time, the maximum draft for Neopanamax vessels fell from the normal 50 feet to 44 feet, while daily transit capacity was also reduced from normal levels.
The approach in August 2026 is more subtle: keep the number of ships broadly unchanged at first, while lowering the maximum load each vessel can carry. This means that when assessing risks to the Panama Canal, focusing only on the number of daily transits is misleading. Even if 35 or 38 ships are still passing through each day, the canal’s actual daily cargo throughput can still decline if more vessels are forced to sail with reduced loads.
Moreover, because a ship’s own weight, equipment, fuel, and other fixed components do not change much, a draft restriction reduces the vessel’s total allowable displacement, while cargo capacity is only what remains after subtracting those fixed weights. For a vessel that would otherwise be fully loaded, even a reduction of only a few percentage points in allowable draft can therefore translate into a disproportionately large loss in the revenue-generating cargo payload. However, the exact relationship between the change in displacement and a given reduction in draft is not linear. It depends on factors such as the vessel’s hull form, dimensions, and actual loading condition.
How Does a Drop of Freshwater Turn Into a $1 Million Transit Right?
If water is scarce, the natural question is: who gets access to the limited supply?
The Panama Canal has developed a highly market-oriented answer. It does not simply charge tolls. It also operates reservation systems, long-term slot allocation, and auctions. Official 2026 tariff documents show that a standard Neopanamax reservation slot carries a booking fee of $100,000. These regular slots are requested ahead of arrival during designated booking periods. By contrast, an auction price applies when a vessel competes for one of the slots specifically released through the Canal’s auction mechanism, often because regular capacity is already allocated or the vessel operator needs a slot closer to the transit date. The auction starts from a minimum price set by the Canal, but the slot goes to the highest bidder. In 2026, the Canal said it typically makes three to five slots per day available through auction.
Even water itself has entered the pricing system. The Panama Canal currently imposes a Fresh Water Surcharge. Fixed portion of the surcharge is either $4,000 (for vessels > 125 feet and ≤ 300 feet) or $10,000 (for vessels > 300 feet). For vessels longer than 125 feet, an additional variable component is determined directly by the official water level of Gatún Lake on the day before transit, and can range from 0% to 10% of the vessel’s total canal toll. The scarcer the lake water becomes, the higher the price of water.
This is actually a remarkably clean economics case. Panama does not have a tradable "Gatún Lake freshwater futures" contract comparable to crude oil futures. But the scarcity value of water is already being expressed through at least three different prices:
Fresh Water Surcharge: directly maps the water level of Gatún Lake into the cost of transit.
Transit slot auction prices: as available capacity becomes scarcer relative to demand, shipowners bid up the price of securing timely passage.
Global shipping prices: if vessels cannot transit on time, they must wait, reduce their loads, or reroute through longer alternatives such as the Suez Canal or the Cape of Good Hope. The scarcity then feeds into fuel costs, vessel charter rates, inventory carrying costs, and ultimately the prices of goods.
This is why a transit right worth more than $1 million is economically meaningful. It can be understood as the market-implied shadow price of the service of "crossing the Isthmus of Panama immediately".
The maximum price a shipping company is willing to pay depends roughly on:
additional fuel costs from rerouting
additional sailing days × daily vessel cost
financing and carrying costs of the cargo
costs of delayed delivery and supply-chain disruption
expected cost of continuing to wait
So $1 million is not some absurd "queue-jumping fee". It is telling us that, for certain cargoes, the economic cost of not using the Panama Canal has already exceeded $1 million.
At the same time, ships themselves are a finite stock of transportation capacity. Suppose a given volume of LPG originally requires one vessel to complete a round trip in 40 days. If rerouting extends that journey to 50 days, the world’s "effective shipping capacity" available to transport LPG declines. This is why the EIA observed that delays at the Panama Canal during the drought in 2023 pushed up vessel freight rates even in other regions. The ships did not disappear. They were simply "locked up" for longer periods by longer voyages and waiting times. The economic impact of a chokepoint therefore extends beyond the cargo that directly passes through it. It can also propagate to other trade routes by reducing the effective supply of the global fleet and pushing up freight rates.
World Weather Attribution’s attribution study of the 2023 event found that El Niño played a clear role. Under the current climate, rainfall in El Niño years is expected to be about 8% lower than in ENSO-neutral years. An exceptionally dry year like 2023 has about a 5% chance of occurring in an El Niño year under today’s climate conditions. Taking into account how frequently El Niño itself occurs, the researchers estimated that an event of this kind has a return period of roughly once every 40 years.
In fiscal year 2024, deep-draft vessel transits through the Panama Canal fell to 9,944, down 21% year over year. Average daily vessel transits at one point declined from around 36 to 27.3. Yet the canal’s revenue did not collapse. Instead, fiscal year 2024 revenue reached about 4.99 billion balboas, around 18 million more than the previous fiscal year. Net income rose to about 3.45 billion. The Panama Canal Authority explicitly stated that improvements to the reservation system, auctions, the Fresh Water Surcharge, and new pricing strategies helped support revenue.
The drought reduced physical throughput, but at the same time made transit rights more scarce. Through auctions and pricing mechanisms, the Canal Authority was able to capture part of that scarcity in the form of additional revenue. This is a classic example of scarcity rent. If the Panama Canal is understood simply as "a highway that charges tolls", this outcome looks strange. But if it is understood as a transportation capacity marketplace with a limited number of slots and the ability to price them dynamically, the result makes much more sense.
But Today’s $1 Million Price Cannot Be Attributed Entirely to Drought
Part of the surge in transit slot prices in 2026 is also being driven by changes on the demand side.
Conflict in the Middle East and other disruptions to global shipping routes have increased demand for the Panama route for some trade flows between the U.S. Gulf Coast and Asia. In April, the Panama Canal Authority explained that after the conflict began, average auction prices had already risen from around $135,000-$140,000 to about $385,000, with some bids exceeding $1 million. The Authority emphasized that these prices reflected the urgency faced by particular vessels at particular moments, as well as broader shipping-market conditions and supply and demand. They did not mean that the canal had suddenly raised its official toll to $1 million. By August, this dynamic had intensified further. According to the Financial Times, the average auction price had reached about $1.1 million.
This points to a particularly important situation now confronting the Panama Canal: disruptions at other major nodes in the global shipping network are pushing more vessels toward the Panama route. At the same time, weather conditions are reducing the amount of transportation capacity the canal can reliably provide. The global shipping system can usually absorb the failure of a single chokepoint because cargo flows can be redirected to alternative routes. But when multiple chokepoints come under pressure at the same time, those so-called "alternative routes" themselves become congested and expensive.
Spend Millions of Dollars, or Take the Long Way Around?
Water shortages do not affect all commodities equally. Scarce transit capacity will be allocated through prices to the cargoes that can best afford to pay for it. Consider three types of cargo.
Containers
Container ships may carry electronics, auto parts, clothing, machinery, and retail goods.
The value of these goods per unit of weight is usually relatively high, spreading the transit cost across the value of the cargo is more justifiable. As a result, some container operators have a very high willingness to pay for timely transit. There was even a recent case in which a container ship reportedly paid about $4 million to secure an earlier passage. That figure should not be interpreted as a standard transit fee for ordinary vessels, but it shows that the value of time can become extremely high under certain circumstances.
Grain
In fiscal year 2025, about 25.1 million metric tons of grain passed through the Panama Canal. Grain, however, has a very different economic profile from containerized cargo. The value per unit of weight is much lower. Once the price of an auctioned transit slot rises above $1 million, spreading that cost across the value of the cargo may be much harder to justify than it would be for high-value containerized goods. Vessels carrying grain may therefore be more willing to wait or reroute and accept a longer voyage.
Liquefied Petroleum Gas (LPG)
The United States is an important supplier of propane to Asia, and the U.S. Gulf Coast to East Asia is a major export route.
The U.S. Energy Information Administration (EIA), notes that a voyage from Houston to Chiba, Japan via the Panama Canal typically takes close to half the time required to sail across the Atlantic and then through the Suez Canal. At the height of the Panama Canal drought in 2023, waiting times for Neopanamax vessels at one point reached at least 17 days, while VLGC freight rates from Houston to Chiba rose to $250 per metric ton in late September, the highest level since the data series began in 2016. By 2025, the Panama Canal was once again carrying more than 95% of U.S. LPG exports to Asia, up from around 80% during the 2023-2024 drought period. This means that water shortages in Panama can feed into the Asian petrochemical supply chain through freight costs, because propane is not only a fuel, but also a petrochemical feedstock.
U.S. LPG monthly exports by destination, Jan - May 2026 (Source: U.S. EIA Exports by Destination, released 31 Jul 2026. LPG = propane + normal butane + isobutane. Other Asia = Bangladesh, Malaysia, Maldives, Philippines, Singapore, Taiwan, Thailand and Vietnam. Values may not sum exactly because EIA rounds each series independently.)
These three examples show that drought does not simply make "all goods a little more expensive". It can also change the composition of cargo moving through the canal. High-time-value, high-unit-value cargoes can bid low-value, less time-sensitive cargoes out of scarce transit capacity. In economic terms, this is a form of capacity rationing by willingness to pay. So if severe water shortages return in the future, the first thing to watch may not be a collapse in the total number of ships transiting the canal, but which types of cargo are still willing to stay.
Cumulative Panama Canal ocean-going transits by market segment and lock type, October 2025 through July 2026. (Source: Panama Canal Authority)
Should the Water Go to Ships, or to People?
If the Panama Canal used seawater, the issue would be primarily a commercial one. But it uses freshwater. Gatún and Alhajuela Lakes are also important sources of drinking water for Panama’s residents. The Panama Canal Authority states that more than 50% of Panama’s population depends on this lake system for water supply.
Every severe drought therefore forces the government to confront a fundamental resource-allocation question: what is the best use of one cubic meter of freshwater? Should it be used to let a ship carrying tens of millions of dollars’ worth of cargo pass through the canal, or should it be stored for residents to drink?
This is one of the most fundamental differences between the Panama Canal and the Suez Canal. In Panama, the marginal water resource that supports transportation capacity is drawn from the same natural resource pool that supplies water for local residents.
As the population of Panama City grows, along with industrial and household water demand, the issue is no longer simply about whether rainfall is high or low. World Weather Attribution specifically notes that population growth, urban expansion, and aging water infrastructure with significant leakage are all adding pressure to the country’s water resources.
So, more precisely, the Panama Canal is not facing simply a drought problem. It is also facing a water balance problem.
Panama’s Solution Is a $1.6 Billion Reservoir
If water is the binding constraint, the most intuitive solution is to increase the amount of water that can be stored.
That is the idea behind Panama’s Río Indio reservoir project. In 2024, the Panama Canal Authority estimated that the core project would cost about $1.2 billion, with another roughly $400 million allocated to surrounding communities, bringing the total investment to about $1.6 billion. The Authority hopes the new reservoir will improve water-supply reliability and give the canal greater confidence in maintaining around 36 transits per day. In 2025, the Panama Canal Board formally designated the Río Indio Lake Project as one of the country’s top priorities for national water security. Its objective is not only to support canal operations, but also to secure water supply for more than half of Panama’s population.
But this raises another economically important point: there is no free resilience. A new reservoir means flooded land, community displacement, and changes to the local ecosystem. In 2025, affected communities filed a lawsuit with Panama’s Supreme Court challenging the project’s constitutionality. Reuters, citing Panama Canal Authority data, reported that around 2,500 people could be affected by the project.
So "solving the Panama Canal’s water shortage" is not simply a matter of spending $1.6 billion on an infrastructure project. The "resilience" demanded by global supply chains may ultimately require a farmer living in a Panamanian river valley to give up his land. That is a very real externality, but one that is often hidden from view when we talk about globalization.
Disclaimer: The content is for informational purposes only. You should not construe any such information or other material as legal, tax, investment, financial, or other advice. Nothing contained in this article constitutes a solicitation, recommendation, endorsement, or offer by the author(s) or any third party service provider to buy or sell any securities or other financial instruments in your or in any other jurisdiction in which such solicitation or offer would be unlawful under the securities laws of such jurisdiction. The author(s) report(s) no conflict of interest.