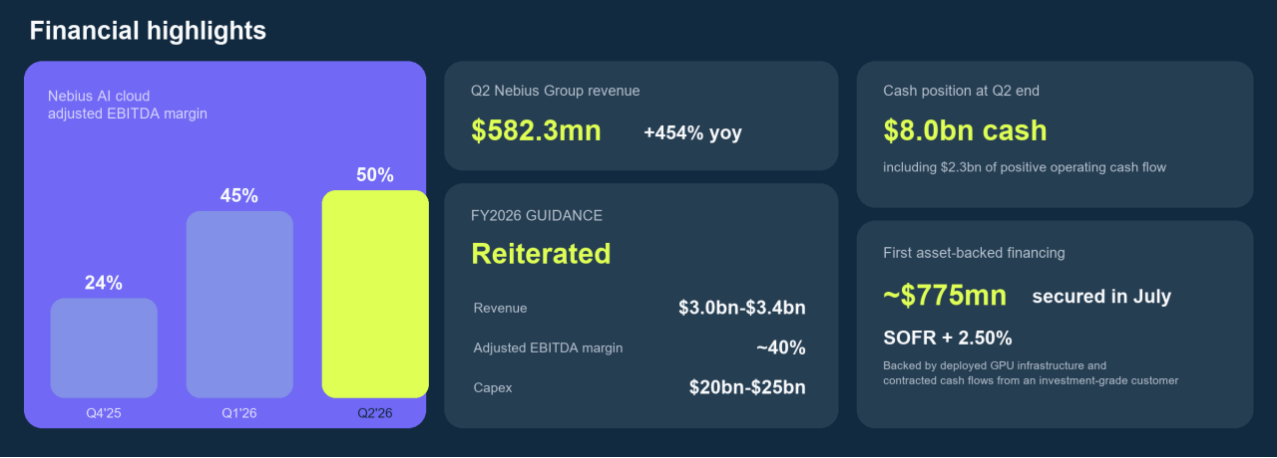
Nebius delivered a clear Q2 beat: revenue reached $582.3mn, up 454% yoy and 46% qoq, versus roughly $510mn-$534mn expected. Nebius AI contributed $574.9mn, while group adjusted EBITDA reached $236.2mn and operating loss narrowed to $175.9mn.
Management said every capacity tranche brought online can be sold, making deployment speed the near-term constraint. The shares rose more than 16% pre-market as the results combined a revenue beat, better profitability and confidence in the 2026 outlook.
Will Nebius AI Cloud maintain an adjusted EBITDA margin of at least 50% in Q3 FY2026?
Key Takeaways
- Financial growth is exceptional, but cluster profitability is not yet corporate profitability. Nebius AI supplied $574.9mn, or 98.7% of group revenue, and its June revenue annualized to $3.0bn, 58% above March. AI adjusted EBITDA margin rose to 49.7% from 45% in Q1 and 24% in Q4 2025 as cost of revenue and SG&A fell sharply as a percentage of sales.
That validates operating leverage in commissioned clusters. It does not yet establish full corporate profitability: the group still reported a $175.9mn GAAP operating loss and a $190.4mn net loss from continuing operations after depreciation, share-based compensation and financing costs.
- Three transaction models form the commercial core.
Nebius is managing capacity as a portfolio rather than selling every future MW under one contract type:
3-6 month contracts and auctions monetize urgent, time-sensitive demand at a premium. The first Blackwell auction cleared 15% above the company's previous peak and 20% above standard Blackwell pricing.
1-3 year mid-term contracts remain the core model for leading AI companies. Four Q2 flagship deals averaged more than $1bn of total contract value, with annual contract value of $20mn-$25mn per MW.
Long-term agreements with investment-grade customers trade some pricing optionality for visibility and financing capacity; one contract supported the $775mn asset-backed facility priced at SOFR + 2.50%.
Why it matters: The mix balances utilization, pricing and funding. Reserving capacity for short-duration demand can raise revenue per MW, but also increases renewal and idle-capacity risk.
Related read: Nebius is not the only AI cloud provider facing the scale-to-returns test. This CoreWeave deep dive examines operating leverage, financing costs and the lifetime economics of older GPUs.
 Jiayi ZHANG
- Power access is both the bottleneck and a potential competitive asset. Nebius raised its year-end contracted-power target to 5GW from just over 1GW a year earlier, but connected-power guidance remains 0.8GW-1.0GW - only 16%-20% of the contracted figure.
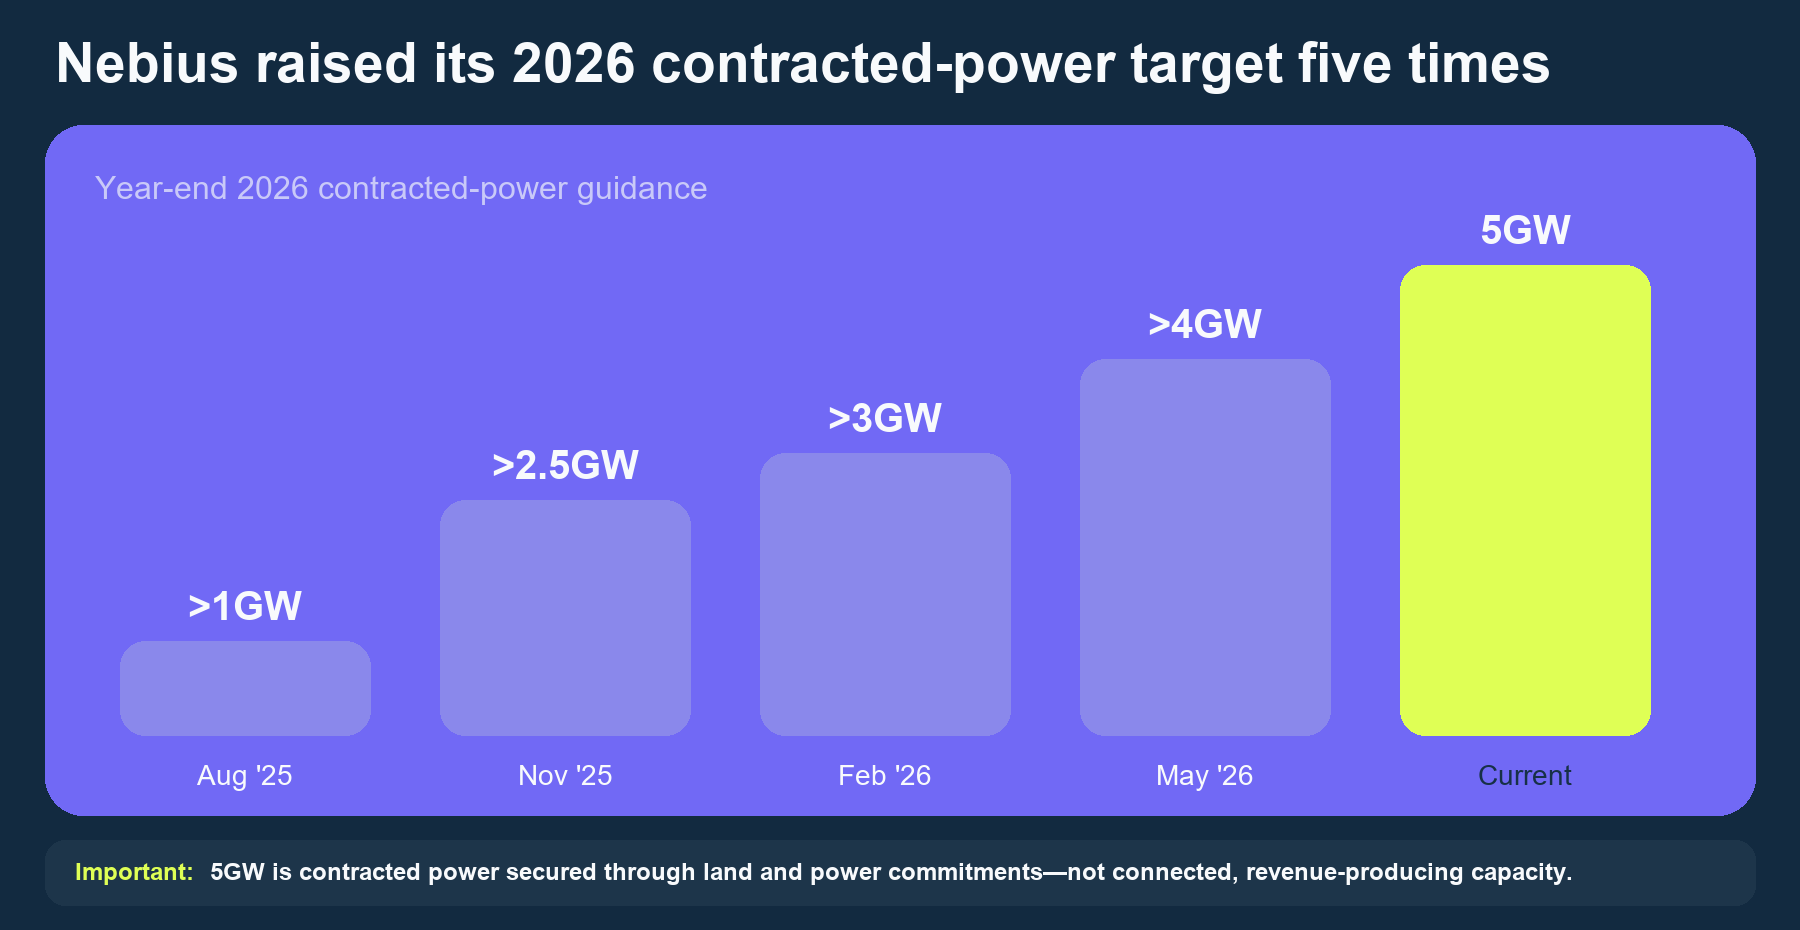
The gap is analytically important: contracted land and power secure a future pipeline, while revenue requires energized sites, delivered GPUs and networks, tested clusters and customer acceptance. Behind-the-meter generation and geographic flexibility may reduce dependence on individual grids, but the key KPI is how quickly and economically signed power becomes billable capacity.
- Capital innovation improves funding efficiency, but not the underlying capital intensity. In July, Nebius secured its first ~$775mn asset-backed financing at SOFR plus 2.50%, backed by deployed GPUs and contracted cash flows from an investment-grade customer. Together with prepayments covering an estimated 50%–60% of related capex and its asset-light partnership model, this creates a potentially repeatable funding framework that reduces reliance on corporate cash and equity. However, Q2 capex of ~$5.7bn—almost 10 times quarterly revenue—shows that returns still depend on utilization, financing costs, depreciation and GPU residual value.
- The open ecosystem and Token Factory raise the potential revenue density of the platform. Token Factory inference workloads more than tripled in Q2 as Nebius expanded day-zero support for open-weight models, while the platform added open-weight models including Kimi K3, GLM 5.2 and Nemotron Ultra.
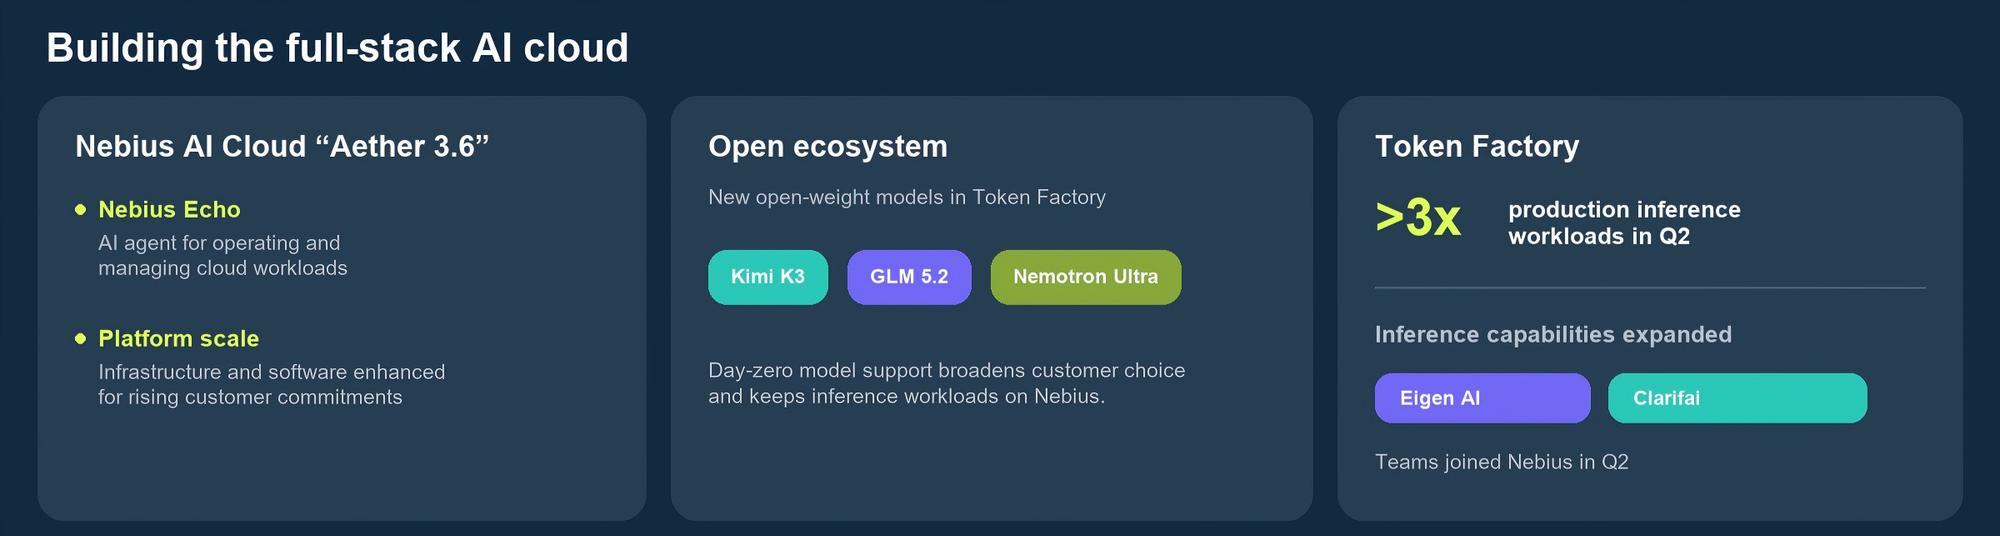
The integration of Eigen AI and Clarifai adds inference-optimization capabilities, while Aether 3.6 and Nebius Echo broaden workload management as customer volumes scale. These developments may increase platform usage, compute utilization and revenue per unit of infrastructure.
Market Reaction
Nebius shares rose more than 16% pre-market as Q2 results improved both the scale and quality of its growth outlook.
Revenue beat expectations, while Nebius AI delivered an adjusted EBITDA margin of about 50%, suggesting new capacity is translating into strong operating leverage. Forward visibility also improved after the company signed four major AI cloud contracts with average total contract value above $1bn and annual contract value of $20mn–$25mn per MW.
Pricing remained strong: Nebius’s first Blackwell auction cleared 15% above its previous peak price and 20% above standard pricing, supporting the value of keeping some capacity available for short-duration demand.
Financing concerns also eased after a ~$775mn asset-backed facility priced at SOFR +2.50%, alongside customer prepayments, expanded funding options beyond cash and equity.
Overall, the rally reflected stronger revenue, margins, pricing and financing flexibility, though depreciation, interest costs, dilution and future GPU capex remain key risks.
Key Debates
- Can commissioned capacity keep selling at current prices?
- Can 5GW of contracted power become connected capacity on schedule?
- Do the three transaction models produce comparable lifetime returns?
- Does financing innovation improve returns or mainly accelerate deployment?
- When will Token Factory become financially measurable?
Source:
- Company press release; https://nebius.com/newsroom/nebius-reports-second-quarter-2026-financial-results