The starting point of prediction markets.

Teach-in Series 5 - Foundries

The contract chip manufacturers — and TSMC’s extraordinary dominance

Teach-in Series 5 - Foundries
Teach In
Share

The contract chip manufacturers — and TSMC’s extraordinary dominance.

Executive summary

Foundries are pure-play contract chip manufacturers: they fabricate chips designed by others and own no end-product IP. Their existence is what makes the fabless model possible. The segment is defined by one company’s dominance — TSMC, with roughly 70% of global foundry revenue and an even larger share at the leading edge — arguably the single most strategically important company in technology. TSMC’s 2025 revenue reached $122.4 billion (+36%) at a 59.9% gross margin, and it guided 2026 capital spending of $52–56 billion.

Behind TSMC, Samsung Foundry (a distant second, hampered by yield issues), China’s SMIC (growing despite export controls), and the mature-node specialists UMC and GlobalFoundries compete in a far less profitable tier. Intel Foundry is a heavily funded but still nascent challenger. The economics at the leading edge are brutal in capital but, for TSMC, exceptional in pricing power — its 2nm wafers reportedly price around $30,000 each.

1. Defining the sector and its strategic importance

A foundry sells manufacturing capacity and process technology, not products. Customers — fabless firms, IDMs, and system companies — send designs to be fabricated at an agreed price per wafer. Because virtually all advanced chips in the world are made by a handful of foundries (and overwhelmingly by TSMC), the segment is the physical chokepoint of the entire digital economy and the focal point of industrial policy.

2. Position in the value chain
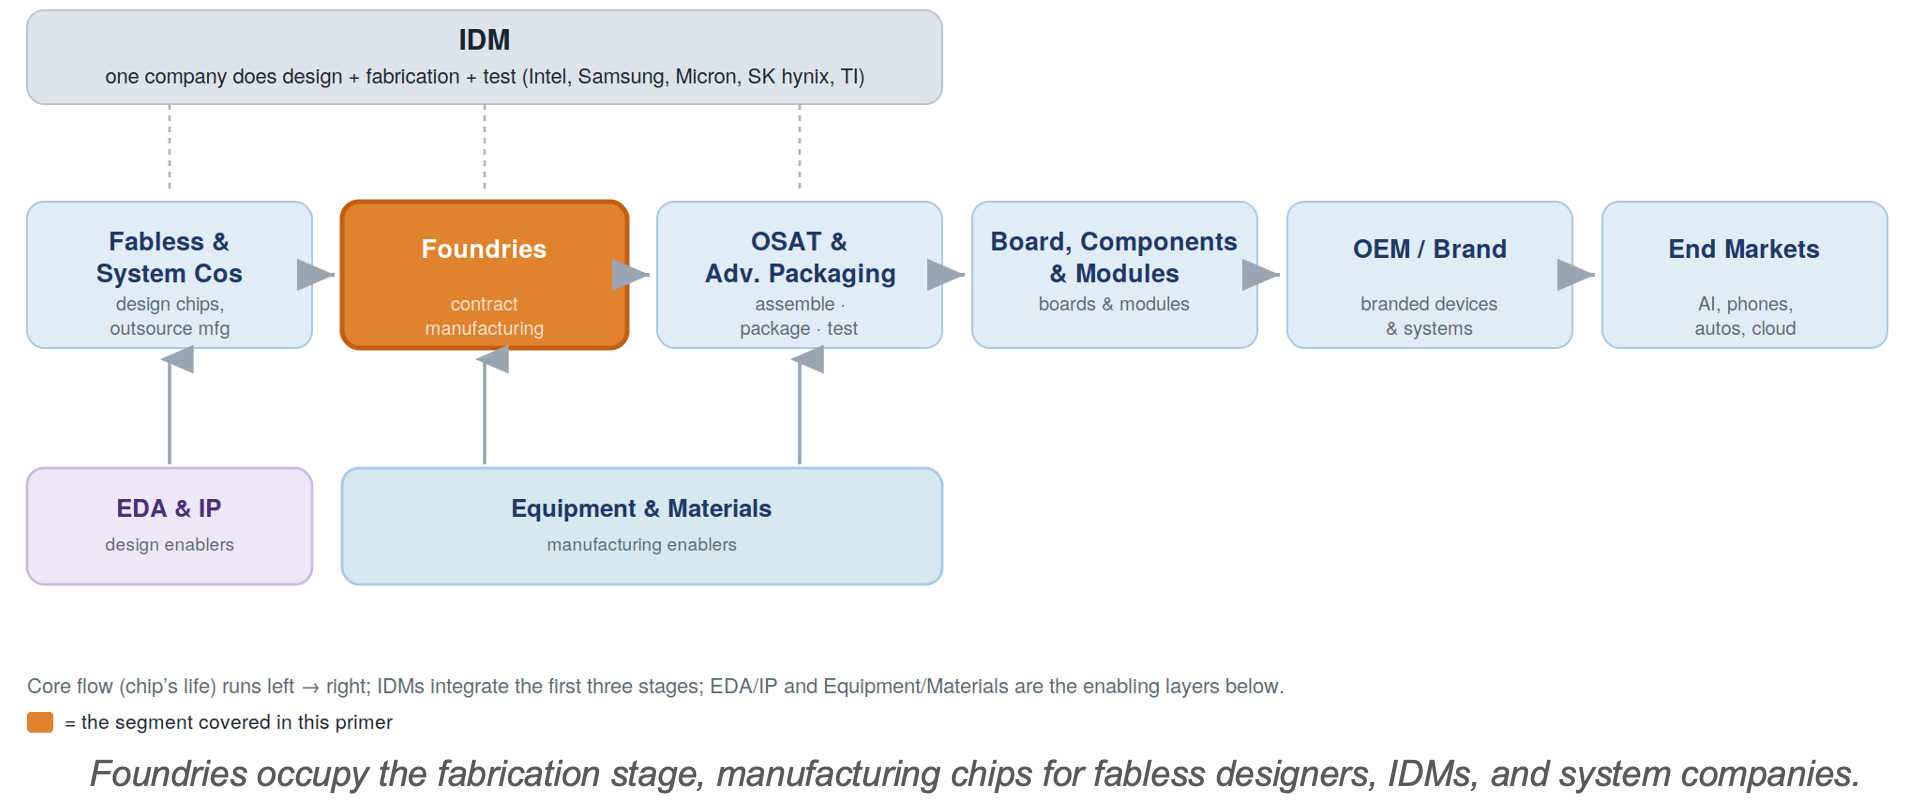
TSMC’s moat is built from process leadership, manufacturing yield, the breadth of its design ecosystem (IP, EDA support, and advanced packaging), and sheer scale — each reinforcing the others. Leading customers co-develop on its newest node, which funds the next node, which attracts the next generation of customers.

3. Structure: leading-edge versus mature nodes

Leading edge (2nm/3nm). Only TSMC, Samsung, and Intel can build the most advanced nodes. TSMC dominates; Samsung and Intel are fighting yield and adoption battles. This is where AI chips (Nvidia, AMD, Broadcom, Apple) are made and where pricing power is greatest — advanced nodes (7nm and below) were 74% of TSMC’s wafer revenue in 2025.

Mature and specialty nodes. UMC, GlobalFoundries, SMIC, HuaHong, Tower, and others serve the large market for chips that do not need the latest node — power management, microcontrollers, RF, displays, automotive. Competition here is on cost, capacity, and specialty processes.

China and Intel. SMIC has grown to roughly 5% global share and reached 7nm-class production using older DUV tools and multipatterning, despite being cut off from EUV. Intel Foundry, backed by the US government’s ~10% stake, is trying to win external customers but remains small and lossmaking.

4. Market size and segmentation

Global foundry revenue reached record levels in 2025 (around $45 billion per quarter by Q3), but the distribution is extraordinarily skewed toward TSMC.

5. Competitive structure and company financials

TSMC’s financial profile — rising revenue and expanding margins — is the clearest evidence of its pricing power: each node transition lets it charge materially more per wafer.

Company

Position

Q3 2025 share

Note

TSMC

Leading-edge leader

~71%

$122.4B FY25 revenue; 59.9% gross margin; 2nm ramping; 2026 capex $52–56B

Samsung Foundry

#2

~7%

2nm yields still maturing; makes HBM4 logic dies

SMIC

China #1

~5%

Export-constrained; 7nm via DUV multipatterning

UMC

Mature nodes

~4%

Specialty and legacy processes

GlobalFoundries

Mature / specialty

~4%

Automotive, RF, power; US-listed

Intel Foundry

Nascent challenger

<2%

Lossmaking; US ~10% equity stake (Aug 2025)

6. Business model and economics

Foundry economics are a study in extremes. Capital intensity is enormous — TSMC’s 2026 capex budget alone ($52–56 billion) exceeds the annual revenue of most chip companies. But at the leading edge, scarcity confers pricing power: TSMC’s wafer average selling price has risen sharply since 2019 and its gross margin reached ~60% in 2025, climbing further into 2026. Mature-node foundries earn far thinner margins, competing on cost and utilization.

7. Demand drivers

•     AI and leading-edge logic. AI accelerators consume TSMC’s most advanced capacity; 2nm pricing carries a premium customers are absorbing.

•     Advanced packaging (CoWoS). TSMC’s packaging capacity is itself a bottleneck and growth driver, tightly coupled to AI-GPU demand.

•     Mature-node demand. Automotive, industrial, and consumer chips sustain the UMC/GF/SMIC tier through steadier cycles.

8. Geopolitics and strategic dimension

The segment is the epicentre of semiconductor geopolitics. The world’s most advanced chips are overwhelmingly made in Taiwan, a systemic single-point-of-failure that drives reshoring (TSMC’s fabs in Arizona, Japan, and Germany) and intense policy attention. China’s leading edge (SMIC) is constrained by equipment export controls — notably the EUV denial discussed in the Equipment primer — while Intel Foundry is backed by direct US government investment. Foundry capacity has become an instrument of national security.

9. A framework for financial analysis

•     Watch node mix and ASP. Revenue from advanced nodes and wafer pricing drive TSMC’s margin expansion; node leadership is the whole thesis.

•     Track capex and utilization. Capital budgets signal confidence; utilization rates (especially at mature nodes) signal the cycle.

•     Mind customer concentration. AI customers (Nvidia, AMD, Broadcom, Apple) drive leading-edge demand; their capex is the swing factor.

•     Price in Taiwan risk. Geographic concentration is the structural risk that no financial metric fully captures.

10. Key debates

•     Can anyone challenge TSMC? Whether Samsung or Intel can close the yield and ecosystem gap at the leading edge.

•     How far does reshoring go? Whether overseas fabs (Arizona, Japan) can match Taiwan’s cost and yield, and how fast.

•     2nm economics. Whether premium 2nm pricing holds as volumes ramp.

11. Risk summary

•     Taiwan concentration — the industry’s defining systemic risk.

•     Extreme capital intensity — tens of billions in annual capex; over-build risk if AI demand cools.

•     Export controls — constrain China’s leading edge and could shift with policy.

•     Customer concentration — leading-edge demand rests on a few AI customers.