Premier info portal for prediction markets. The start point of information market.
Results Deep Dive - Hapag-Lloyd Returns to Profit in Q2 and Raises 2026 Outlook
Analysis
MaritimeContainer ShippingEarnings & OperationsSupply Chain Semi Analysis

Results Deep Dive - Hapag-Lloyd Returns to Profit in Q2 and Raises 2026 Outlook

Hapag-Lloyd’s H1 2026 results were mixed. The company returned to profit in Q2 as stronger demand and spot freight rates lifted transport volumes and average pricing, producing a clear recovery from a loss-making Q1.

Economics & Finance

Hapag-Lloyd’s H1 2026 results were mixed. The company returned to profit in Q2 as stronger demand and spot freight rates lifted transport volumes and average pricing, producing a clear recovery from a loss-making Q1.

Will Hapag-Lloyd transport more than 3.5mn TEU in Q3 2026? (3.481mn TEU in Q2 2026, up 3.5% yoy)

Yes
61.27%
No
38.73%
142 Polls

Q2 revenue rose 10.8% yoy to $5.84bn, while EBITDA increased 1.1% to $829mn and EBIT declined 6.9% to $176mn. Net profit fell 72.9% to $83mn. The sequential improvement was much stronger: revenue rose 19% qoq, EBITDA increased 68%, and EBIT swung from a $157mn loss. However, the weak first quarter and substantial disruption costs left H1 EBITDA down 31.2% and EBIT at only $18mn. Hapag-Lloyd raised its FY2026 outlook following the Q2 recovery, but the wide range continues to reflect considerable uncertainty around freight rates, energy costs and the Middle East conflict.

Q2 2026 Group Key Figures
Liner Shipping
Transport Volume
3.5 M TEU
PY: 3.4 M TEU
Terminal & Infrastructure
Throughput
3.6 M TEU
PY: 3.3 M TEU
Revenue
USD 5.8 bn
PY: USD 5.3 bn
EBITDA
USD 0.8 bn
PY: USD 0.8 bn
EBIT
USD 0.2 bn
PY: USD 0.2 bn
Group Profit
USD 0.1 bn
PY: USD 0.3 bn
Free Cash Flow
USD 0.6 bn
PY: USD 0.2 bn
Net Debt
USD 2.0 bn
PY: USD 1.2 bn

Key Takeaways
  • Ocean was the main earnings driver, supported by both pricing and execution. Q2 marked a clear turnaround from a loss-making Q1. The most important development was not the modest yoy change in EBITDA, but the scale of the sequential recovery. Q2 revenue reached $5.84bn versus $4.92bn in Q1, while EBITDA rose to $829mn from $494mn. EBIT improved to $176mn from a $157mn loss, and the net result swung to an $83mn profit from a $256mn loss.

This shows that Hapag-Lloyd retained significant operating leverage when freight markets improved. Nevertheless, Q2 EBIT remained below the prior-year period even with substantially higher revenue, indicating that the rebound in commercial conditions did not fully reach the bottom line.

Revenue [USD m]
+19%
5,272
4,918
5,840
Q2 2025
Q1 2026
Q2 2026
EBITDA [USD m]
15.6%
10.0%
14.2%
+68%
820
494
829
Q2 2025
Q1 2026
Q2 2026
EBIT1 [USD m]
3.6%
-3.2%
3.0%
189
-157
176
Q2 2025
Q1 2026
Q2 2026
Group Profit1 [USD m]
3.3%
-3.2%
2.7%
306
-256
83
Q2 2025
Q1 2026
Q2 2026

Recovery of Hapag-Lloyd earnings in Q2 due to improved market conditions in the Liner Shipping business. Source: Hapag-Lloyd

  • Higher volumes and freight rates drove the recovery, but H1 pricing remained broadly flat. Q2 transport volume increased 3.5% yoy to 3.481mn TEU, while the average freight rate rose 8.9% to $1,475/TEU. Management attributed the improvement mainly to strong exports from Asia and better US demand.

The Gemini network also remained resilient, with schedule reliability returning to ~90% after disruption. The first-half picture was less pronounced: volume rose 1.5% to 6.684mn TEU and the average freight rate declined 0.4% to $1,406/TEU.

Network schedule reliability
Gemini Cooperation
Competitor Range
100%
90%
80%
70%
60%
50%
Feb-
25
Mar-
25
Apr-
25
May-
25
Jun-
25
Jul-
25
Aug-
25
Sep-
25
Oct-
25
Nov-
25
Dec-
25
Jan-
26
Feb-
26
Mar-
26
Apr-
26
May-
26
Jun-
26

Gemini reliability back at 90%. Source: SeaIntel

H1 revenue increased 1.6% in US dollars, although it fell 4.8% in euros because of currency translation. Q2 therefore represented a meaningful market improvement, but one quarter of stronger spot pricing does not yet establish a sustained change in the annual rate environment.

  • Middle East disruption absorbed much of the commercial improvement. The conflict generated ~ $600mn of additional cash costs, including ~ $400mn realized in Q2 and ~ $200mn associated with bunker inventory build-up.

Alternative routings, elevated fuel prices, storage expenses and higher hinterland transportation costs all contributed. H1 transport and terminal expenses increased 8.6% to $8.41bn, despite only 1.5% volume growth.

  • Raised guidance reflects stronger H2 conditions, while the range remains wide. On July 13, Hapag-Lloyd raised FY2026 EBITDA guidance to $2.7-3.7bn from $1.1-3.1bn and EBIT guidance to $0.1-1.1bn from -$1.5bn to $0.5bn.

The revision reflects the recent increase in spot freight rates and resilient demand, partly offset by energy costs and continuing operational disruption. Cash generation was materially stronger than net income, partly because depreciation is significant in this asset-heavy model and some Middle East-related cash outlays were reflected in bunker inventory. The wide $1bn guidance ranges show that management visibility remains limited.

The proposed $4.2bn acquisition of ZIM is an additional strategic variable: ZIM shareholders have approved the transaction, but regulatory approvals remain outstanding, and Hapag-Lloyd’s guidance excludes any consolidation effects.

Timeline
16 February
Signing
30 April
ZIM Extraordinary
General Meeting
Golden
Share approval
Discussions with relevant
stakeholders and key decision
makers ongoing
Antitrust clearance
All filings submitted, first approvals received
end of 2026
C
Closing

Merger agreement approved by ZIM shareholders; regulatory approvals are still pending amid mounting obstacles. Source: Hapag-Lloyd

Key Debates
  • Can the Q2 freight-rate recovery persist into Q4 2026?
  • How much of the ~$600mn Middle East cost impact will prove temporary?
  • Can cost savings restore Liner Shipping margins if freight rates normalize?
  • Will Terminal & Infrastructure become large enough to reduce group earnings volatility?

Source:

  1. Company press release; https://www.hapag-lloyd.com/en/company/ir.html
Results Deep Dive - Maersk Raises 2026 Guidance Again as Ocean Rates Drive a Strong Q2
Analysis
MaritimeEarnings & OperationsContainer ShippingSupply Chain Semi Analysis

Results Deep Dive - Maersk Raises 2026 Guidance Again as Ocean Rates Drive a Strong Q2

Maersk delivered a strong Q2 2026, as higher Ocean freight rates, volume growth and lower unit costs drove a sharp recovery in earnings. The most important was another substantial increase in Maersk’s FY2026 guidance, just weeks after the company upgraded its outlook in late June.

Economics & Finance

Maersk delivered a strong Q2 2026, as higher Ocean freight rates, volume growth and lower unit costs drove a sharp recovery in earnings. Revenue rose 20.0% yoy to $15.76bn, while reported EBITDA increased 30.2% to $2.99bn. Reported EBIT climbed 85.9% to $1.57bn, taking the EBIT margin to 10.0%, and net profit more than doubled to $1.31bn.

USD
P&L
Revenue
15.8bn
(13.1bn)
EBITDA
3.0bn
(2.3bn)
EBIT
1.6bn
(0.8bn)
Profit
for period
1.3bn
(0.6bn)
Cash
and
returns
FCF
0.5bn
(-0.4bn)
Cash and
deposits
18.5bn
(19.9bn)
NIBD
-1.5bn
(-2.5bn)
ROIC
(LTM)
5.0%
(13.7%)

Note: Prior corresponding period figures in brackets. Source: Maersk

The most important incremental information was another substantial increase in Maersk’s FY2026 guidance, just weeks after the company upgraded its outlook in late June. The new guidance suggests that management expects the stronger rate environment and operating performance to remain supportive through H2, although the durability of current freight rates remains the central debate.

Will Maersk’s average Ocean freight rate remain above $2,700/FFE in Q3 2026? (Q2 2026 Avg: $2,746/FFE)

Yes
61.64%
No
38.36%
232 Polls

Key Takeaways

  • Ocean was the main earnings driver, supported by both pricing and execution. Ocean revenue reached $10.53bn, with EBITDA of $2.04bn and EBIT of $940mn. Loaded volumes increased 4.1% yoy to 3.36mn FFE, while the average freight rate rose 21.6% to $2,746/FFE. At the same time, unit costs declined 2.2% to $2,355/FFE. The combination of higher rates, growing volumes and lower costs produced significant operating leverage.
USDm
Q2’26
Q1’26
Q2’25
Revenue
10,526
8,178
8,572
EBITDA
2,041
903
1,443
EBITDA margin
19.4%
11.0%
16.8%
EBIT
935
(192)
229
EBIT margin
8.9%
(2.3)%
2.7%
Gross CAPEX
663
716
964
Rate product share
Q2’26
2026e
Long-term (> 3 months)
44%
46%

Note: Maersk's Ocean Segment Earning. Source: Maersk

  • Q2 represented a clear acceleration from a weak start to the year. H1 revenue increased 8.6% yoy to $28.73bn, but EBITDA declined 5.3% to $4.74bn and EBIT fell 8.9% to $1.91bn. Net profit decreased 23.5% to $1.41bn. The contrast between the strong Q2 performance and declining H1 earnings shows how quickly Maersk’s profitability improved as freight rates recovered.

  • Logistics continued to improve, although margins remain modest. Logistics revenue reached $4.22bn, with EBITDA of $470mn and EBIT of $220mn. The EBIT margin increased 50bps qoq to 5.1%, supported by Landside services, air freight, project logistics and a better contract mix. Further margin expansion would reduce the group’s reliance on volatile Ocean earnings.
USDm
Q2’26
Q1’26
Q2’25
Segment revenue
Forwarding
839
739
636
Solutions
1,233
1,222
1,107
Landside
2,301
2,004
2,022
Total revenue(1)
4,222
3,793
3,668
EBITDA
468
433
419
EBITDA margin
11.1%
11.4%
11.4%
EBIT
217
173
175
EBIT margin
5.1%
4.6%
4.8%
Gross CAPEX
116
84
139

Note: Maersk's Logisticcs Segment Earning. Source: Maersk

  • Terminals remained a stable source of profit. Revenue reached $1.45bn, EBITDA was $520mn and EBIT was $460mn, while volumes grew 2.2% yoy. The strong profitability on relatively modest volume growth highlights the segment’s role as a more predictable earnings contributor.
USDm
35.3%
39.4%
23.7%
33.2%
31.6%
461
571
321
436
458
Q2 ’25
Q3 ’25
Q4 ’25
Q1 ’26
Q2 ’26
EBIT
EBIT margin

Note: Maersk's Terminal Segment Earning. Source: Maersk

  • Guidance was raised by an unusually wide margin. Maersk now expects FY2026 underlying EBITDA of $10.5–12.5bn, up from $8–10bn, and underlying EBIT of $4.5–6.5bn, up from $2–4bn. The midpoint of both ranges increased by $2.5bn. Free-cash-flow guidance improved to above zero from at least negative $1.5bn. As the global container-market growth assumption remained unchanged at ~4%, the upgrade appears to reflect stronger rates, business mix and execution rather than a higher industry volume forecast.

Key Debates

  1. Can elevated Ocean rates persist beyond the peak shipping season?
  2. How much demand was brought forward?
  3. Can free cash flow remain positive despite heavy investment?
  4. Can Logistics sustain its margin improvement?

Source:

  1. Company press release; https://www.maersk.com/news/articles/2026/08/13/maersk-delivers-strong-q2-and-raises-full-year-guidance
Result Review - Coherent Beats, Sees Bigger Growth as AI Networking Shifts From Copper to Optics
Quick Take
AI InfrastructureData CenterEarnings & Operations Semi Analysis

Result Review - Coherent Beats, Sees Bigger Growth as AI Networking Shifts From Copper to Optics

Coherent’s Q4 revenue reached $2.05bn as Data Center & Communications sales rose 59% yoy. Q1 guidance beat expectations, but a modest gross-margin step-up, heavy capacity investment and weaker cash conversion remain the key tests for FY2027.

Economics & FinanceTech

Coherent delivered a broad Q4 FY2026 beat, with revenue, margins and earnings all improving. The more important update was management’s roadmap for another leg of AI-related growth: InP capacity is expanding rapidly, while CPO, PhotonLink, Multi-Rail and thermal-management products are expected to begin contributing over the next several quarters. The shares nevertheless fell after hours as strong execution met an already elevated expectations bar.

Will Coherent’s non-GAAP gross margin > 42% in FY2027 Q1?

Yes
0.00%
No
0.00%
0 Polls

Key Takeaways

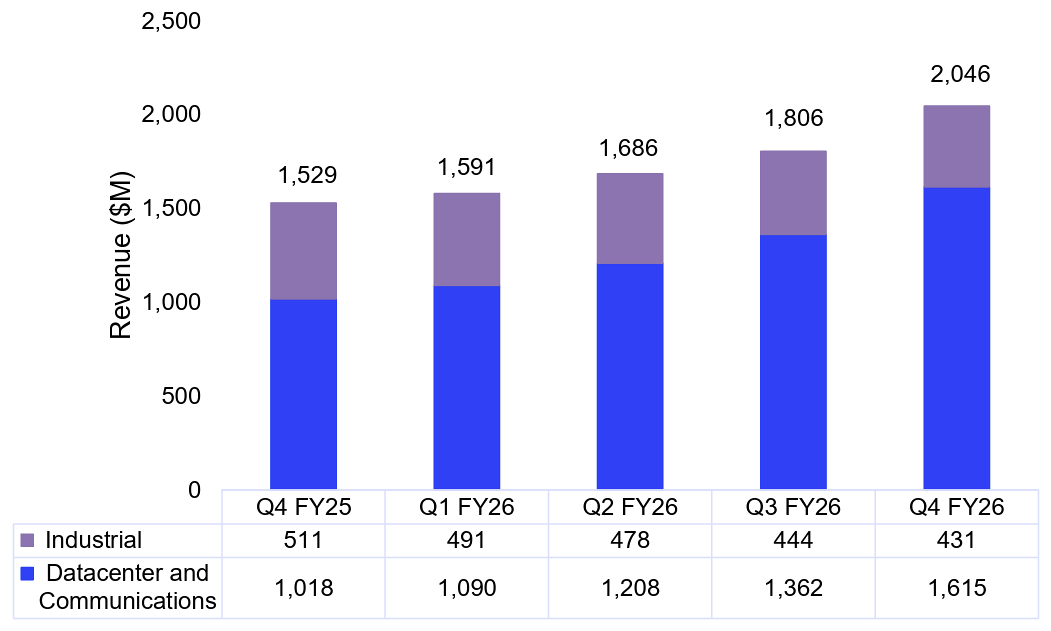
· Results and guidance were stronger than expected. Q4 revenue reached $2.05bn, up 34% yoy and 13% qoq, while non-GAAP EPS rose 74% yoy to $1.74. Non-GAAP gross margin increased 215bps yoy to 40.2%, and operating margin reached 21.8%. Q1 FY2027 guidance calls for revenue of $2.2bn–$2.4bn and non-GAAP EPS of $1.85–$2.05, both above the consensus figures cited in the supplied market review.

· AI optical connectivity is driving an increasingly concentrated growth profile. Data Center & Communications revenue rose 59% yoy to $1.62bn and represented 79% of sales. Industrial revenue fell 16% on a reported basis to $431m. The quarterly trend shows that all net revenue growth over the past year came from the data-center and communications segment, increasing Coherent’s exposure to AI infrastructure spending and execution at major customers.

Quarterly revenue by segment ($m). Source: Coherent investor presentation

· InP capacity is still the central constraint. Internal InP output doubled yoy in Q4, while 6-inch laser output rose ~80%. Management expects internal InP capacity to double by calendar year-end and more than double again by end-2027. The 6-inch line produces CW lasers, EMLs and photodiodes, with management citing better yields and economics than 3-inch production. Backlog extends through FY2027, customer forecasts reach 2028, and many LTAs run three to ten years with pricing and minimum-volume provisions.

· Several new platforms now have specific revenue windows. CPO-related revenue and the PhotonLink integrated optical platform are expected to start increasing in Q2 FY2027. Multi-Rail should begin contributing in the first half, while Thermadite thermal-management revenue is expected in the second half. OCS revenue is already growing, and management raised its estimated 2030 addressable market to more than $4bn. These remain management timelines rather than realized sales.

Source: Coherent investor presentation

· Earnings growth was strong, but cash conversion weakened. FY2026 non-GAAP EPS increased 59% as gross margin and operating leverage improved. However, operating cash flow fell to $80m from $634m, reflecting the working-capital and investment demands of the capacity build. Coherent ended the year with about $2.0bn of cash and short-term investments, while long-term debt declined to $3.21bn, limiting immediate liquidity concerns.

Market Reaction

Coherent rose ~2.8% in regular trading before the release, then fell ~3.5% initially and more than 6% at one point after hours, according to the supplied market review. Lumentum had rallied about 8% after its own stronger-than-expected report one day earlier, creating a demanding peer benchmark.

Related read:

Results Deep Dive - Lumentum Revenue Doubles And 1Q2027 Guidance Soars; All Concerns Lifted?
Lumentum delivered a broad Q4 FY2026 beat and issued Q1 guidance substantially above expectations, as AI-driven data-center demand lifted both optical components and systems revenue.

Coherent had also gained more than 200% over the prior 12 months and traded at roughly 42x forward earnings versus an industry average near 22x in that review. The decline therefore may reflect relative surprise, valuation and the modest near-term margin step-up rather than weaker reported demand.

Key Debates

· Can non-GAAP gross margin exceed 42% by Q4 FY2027?

· Will CPO and PhotonLink generate meaningful revenue in Q2 FY2027?

· Can inventory and capacity investment translate into stronger operating cash flow?

· Will Industrial return to yoy growth within the next two quarters?

Source:

  1. Company press release; https://www.coherent.com/news/press-releases/fourth-quarter-and-fiscal-year-2026-results
Results Deep Dive - Nebius Posts 454% Revenue Growth and a 50% Cloud Margin, Capacity Sells Faster Than It Can Be Built
Analysis
AI InfrastructureEarnings & OperationsData CenterCloud Computing Semi Analysis

Results Deep Dive - Nebius Posts 454% Revenue Growth and a 50% Cloud Margin, Capacity Sells Faster Than It Can Be Built

Nebius delivered 454% revenue growth and a 50% AI cloud margin as demand outpaced capacity. The next test is converting power into billable compute while using prepayments, asset-backed debt and an open AI stack to finance expansion.

Economics & FinanceTech

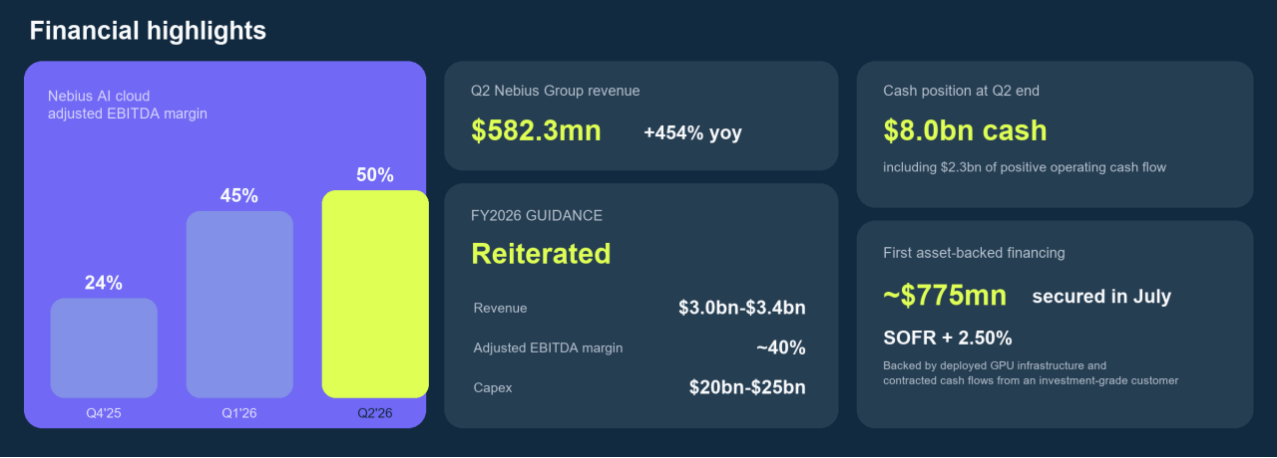
Nebius delivered a clear Q2 beat: revenue reached $582.3mn, up 454% yoy and 46% qoq, versus roughly $510mn-$534mn expected. Nebius AI contributed $574.9mn, while group adjusted EBITDA reached $236.2mn and operating loss narrowed to $175.9mn.

Management said every capacity tranche brought online can be sold, making deployment speed the near-term constraint. The shares rose more than 16% pre-market as the results combined a revenue beat, better profitability and confidence in the 2026 outlook.

Source: Nebius Q2 FY2026 earnings release. Adjusted EBITDA is non-GAAP.

Will Nebius AI Cloud maintain an adjusted EBITDA margin of at least 50% in Q3 FY2026?

Yes
0.00%
No
0.00%
0 Polls

Key Takeaways

  • Financial growth is exceptional, but cluster profitability is not yet corporate profitability. Nebius AI supplied $574.9mn, or 98.7% of group revenue, and its June revenue annualized to $3.0bn, 58% above March. AI adjusted EBITDA margin rose to 49.7% from 45% in Q1 and 24% in Q4 2025 as cost of revenue and SG&A fell sharply as a percentage of sales.

That validates operating leverage in commissioned clusters. It does not yet establish full corporate profitability: the group still reported a $175.9mn GAAP operating loss and a $190.4mn net loss from continuing operations after depreciation, share-based compensation and financing costs.

  • Three transaction models form the commercial core.

Nebius is managing capacity as a portfolio rather than selling every future MW under one contract type:

3-6 month contracts and auctions monetize urgent, time-sensitive demand at a premium. The first Blackwell auction cleared 15% above the company's previous peak and 20% above standard Blackwell pricing.

1-3 year mid-term contracts remain the core model for leading AI companies. Four Q2 flagship deals averaged more than $1bn of total contract value, with annual contract value of $20mn-$25mn per MW.

Long-term agreements with investment-grade customers trade some pricing optionality for visibility and financing capacity; one contract supported the $775mn asset-backed facility priced at SOFR + 2.50%.

Why it matters: The mix balances utilization, pricing and funding. Reserving capacity for short-duration demand can raise revenue per MW, but also increases renewal and idle-capacity risk.

Related read: Nebius is not the only AI cloud provider facing the scale-to-returns test. This CoreWeave deep dive examines operating leverage, financing costs and the lifetime economics of older GPUs.

Results Deep Dive - Is CoreWeave Starting to Turn Scale Into Profit? Operating Margin Rebounds; 2020-Era A100 Capacity Is Renewed Through 2029
CoreWeave’s Q2 showed early operating leverage as adjusted operating margin rebounded to 5%. An A100 renewal through 2029 supports longer asset lives, but rising capex, interest expense and execution risk leave the profit model unproven.
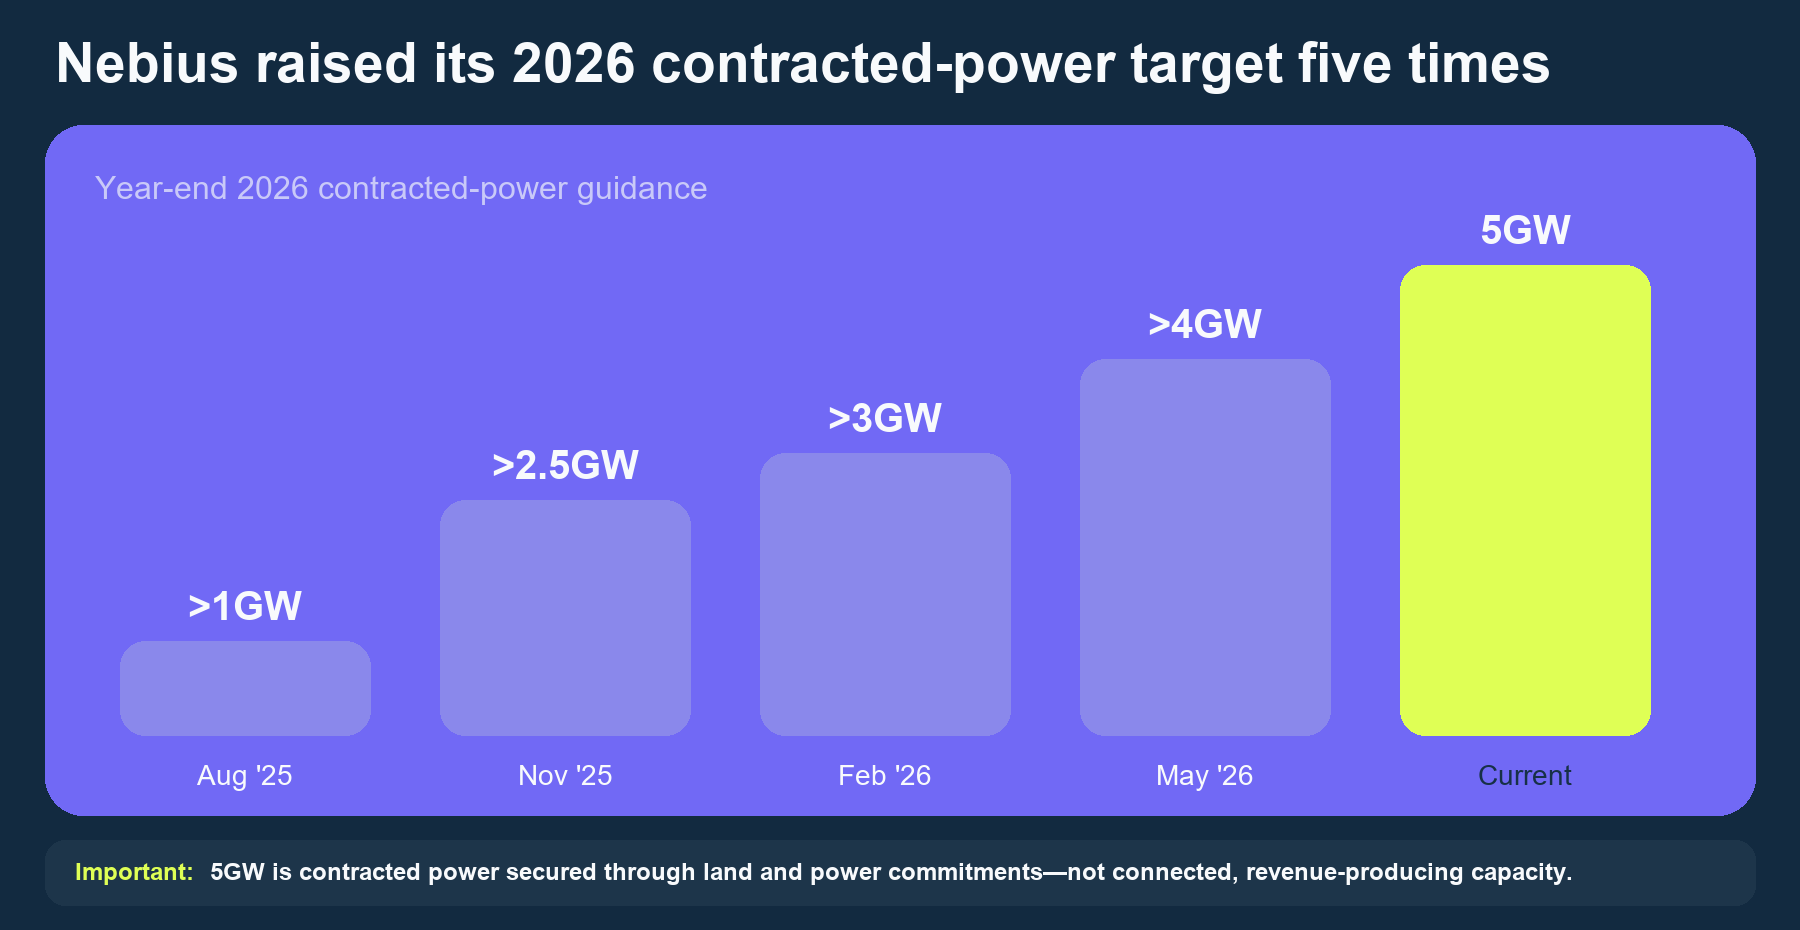
  • Power access is both the bottleneck and a potential competitive asset. Nebius raised its year-end contracted-power target to 5GW from just over 1GW a year earlier, but connected-power guidance remains 0.8GW-1.0GW - only 16%-20% of the contracted figure.
Source: Nebius

The gap is analytically important: contracted land and power secure a future pipeline, while revenue requires energized sites, delivered GPUs and networks, tested clusters and customer acceptance. Behind-the-meter generation and geographic flexibility may reduce dependence on individual grids, but the key KPI is how quickly and economically signed power becomes billable capacity.

  • Capital innovation improves funding efficiency, but not the underlying capital intensity. In July, Nebius secured its first ~$775mn asset-backed financing at SOFR plus 2.50%, backed by deployed GPUs and contracted cash flows from an investment-grade customer. Together with prepayments covering an estimated 50%–60% of related capex and its asset-light partnership model, this creates a potentially repeatable funding framework that reduces reliance on corporate cash and equity. However, Q2 capex of ~$5.7bn—almost 10 times quarterly revenue—shows that returns still depend on utilization, financing costs, depreciation and GPU residual value.

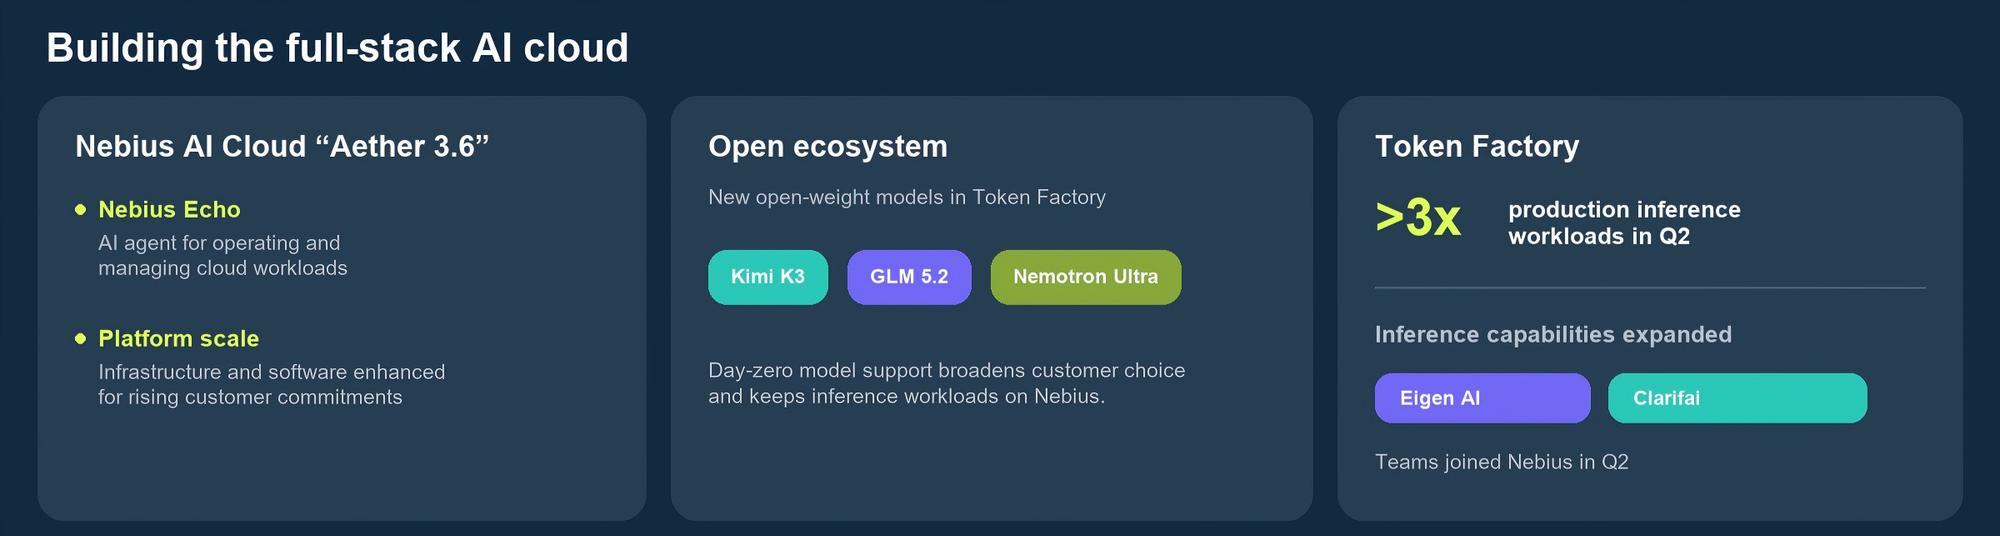
  • The open ecosystem and Token Factory raise the potential revenue density of the platform. Token Factory inference workloads more than tripled in Q2 as Nebius expanded day-zero support for open-weight models, while the platform added open-weight models including Kimi K3, GLM 5.2 and Nemotron Ultra.
Source: Nebius Q2 FY2026 shareholder letter

The integration of Eigen AI and Clarifai adds inference-optimization capabilities, while Aether 3.6 and Nebius Echo broaden workload management as customer volumes scale. These developments may increase platform usage, compute utilization and revenue per unit of infrastructure.

Market Reaction

Nebius shares rose more than 16% pre-market as Q2 results improved both the scale and quality of its growth outlook.

Revenue beat expectations, while Nebius AI delivered an adjusted EBITDA margin of about 50%, suggesting new capacity is translating into strong operating leverage. Forward visibility also improved after the company signed four major AI cloud contracts with average total contract value above $1bn and annual contract value of $20mn–$25mn per MW.

Pricing remained strong: Nebius’s first Blackwell auction cleared 15% above its previous peak price and 20% above standard pricing, supporting the value of keeping some capacity available for short-duration demand.

Financing concerns also eased after a ~$775mn asset-backed facility priced at SOFR +2.50%, alongside customer prepayments, expanded funding options beyond cash and equity.

Overall, the rally reflected stronger revenue, margins, pricing and financing flexibility, though depreciation, interest costs, dilution and future GPU capex remain key risks.

Key Debates

  • Can commissioned capacity keep selling at current prices?
  • Can 5GW of contracted power become connected capacity on schedule?
  • Do the three transaction models produce comparable lifetime returns?
  • Does financing innovation improve returns or mainly accelerate deployment?
  • When will Token Factory become financially measurable?

Source:

  1. Company press release; https://nebius.com/newsroom/nebius-reports-second-quarter-2026-financial-results
Operational Update - Taiwan AI Hardware Supply Chain July Momentum Extends; TSMC’s advanced-node growth, UMC’s mature-process recovery and Hon Hai’s AI-server expansion
Analysis
AI InfrastructureMemory ChipData CenterEarnings & OperationsSemiconductorSupply Chain Semi Analysis

Operational Update - Taiwan AI Hardware Supply Chain July Momentum Extends; TSMC’s advanced-node growth, UMC’s mature-process recovery and Hon Hai’s AI-server expansion

July 2026 revenue at TSMC, UMC and Hon Hai traces AI demand across advanced chipmaking, mature-node semiconductors and server systems—highlighting growth momentum, profit conversion and key operational risks.

Economics & FinanceTech

Taiwan’s latest disclosures point to sustained demand across three layers of the AI infrastructure stack: TSMC’s and UMC’s July 2026 revenue updates, and Hon Hai’s second-quarter operating results.

Together, the companies span distinct segments of Taiwan’s technology supply chain — advanced semiconductor manufacturing, mature and specialty foundry services, and AI server-system production. While all three are benefiting from the broader AI infrastructure buildout, the underlying growth drivers and the implications for margins differ significantly across companies.

Company

Latest revenue

MoM

YoY

AI supply-chain role

TSMC

US$14.61bn (Jul)

+5.6%

+44.7%

Advanced nodes / AI chips

UMC

US$745.1mn (Jul)

+3.1%

+19.0%

Mature and peripheral chips

Hon Hai

US$29.58bn (Jul)

+15.18%

+54.19%

AI servers and rack systems

TSMC: advanced manufacturing remains the primary growth engine

TSMC reported July revenue of approximately US$14.61bn, up 5.6% MoM and 44.7% YoY. Revenue for the first seven months reached approximately US$89.75bn, an increase of 37.0% YoY.

July was about 9% above the Q2 monthly average, indicating that third-quarter growth was not dependent solely on a late-quarter shipment increase. Leading-edge nodes used in AI accelerators and high-performance computing, together with advanced packaging, remained the main drivers.

In Q2, 7nm and more advanced processes represented 77% of wafer revenue, including 30% from 3nm and an initial 3% from 2nm. Management expects a steep 2nm ramp during Q3 and guided to quarterly revenue of US$44.6-45.8 billion. AI accelerators, custom processors and high-performance computing are supporting demand for both leading-edge wafers and advanced packaging.

Will TSMC's Aug 2026 revenue exceed that of July?

Yes
0.00%
No
0.00%
0 Polls

UMC: mature-node utilization and product mix continue to improve

UMC reported July revenue of approximately US$745.1mn, up 3.1% MoM and 19.0% YoY. Seven-month revenue was approximately US$4.80bn, representing 12.4% YoY growth.

The improvement is not equivalent to TSMC's direct exposure to advanced AI processors. UMC supplies connectivity, display, power-management, consumer and networking applications. Q2 utilization rose to 85% from 79%, while 22/28nm increased to 37% of revenue and gross margin reached 32.5%.

July's performance is therefore consistent with higher utilization, a better product mix and more stable pricing, with AI infrastructure providing an indirect rather than exclusive demand channel.

Hon Hai: Q2 results underscore growth in AI server systems

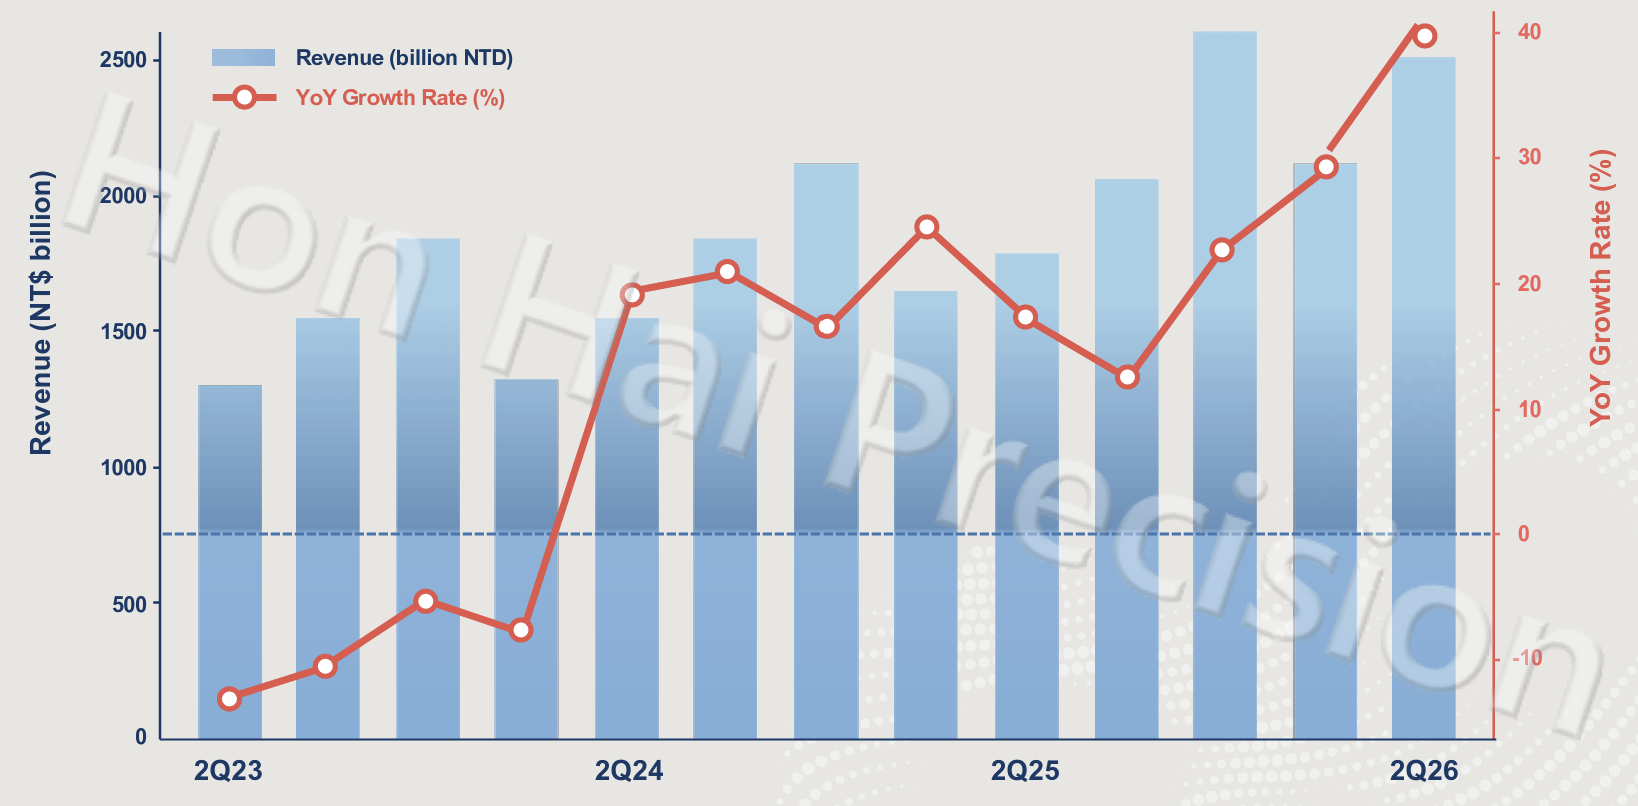
Hon Hai reported July revenue of approximately US$29.58bn, up 15.18% MoM and 54.19% YoY. The sharp sequential rise shows momentum continuing after an already strong Q2, when revenue reached approximately US$78.54bn, increasing 18.0% QoQ and 39.8% YoY.

AI infrastructure is driving revenue growth. Source: Hon Hai

The figures show AI demand reaching the system-production layer as Hon Hai expands from server assembly into integrated racks incorporating computing, networking, cooling, power and interconnect systems. Traditional second-half ICT seasonality also supported the July acceleration.

Will Hon Hai’s August revenue exceed July’s US$29.58bn?

Yes
50.00%
No
50.00%
2 Polls

Cloud and networking products were the main growth driver, supported by AI servers and rack-scale systems. Company disclosures indicated that the segment accounted for close to half of group revenue, while industry research pointed to higher shipments of GPU-based racks and custom-ASIC systems for large cloud customers. Hon Hai is also extending its participation into networking, power, cooling and rack integration.

Revenue growth should nevertheless be considered separately from profitability. High-value accelerators can increase reported server revenue substantially, while component-procurement and consignment arrangements affect both revenue recognition and margins. Gross profit, operating margin and the mix between GPU and custom-ASIC programmes therefore remain important indicators of earnings conversion.

Operating read-through: the same AI cycle, different economics

The data support a three-layer transmission of AI capital expenditure through Taiwan: advanced chips at TSMC, peripheral and mature-node content at UMC, and server-system integration at Hon Hai.

The strongest combination of growth and profit conversion is currently at the advanced-chip layer. UMC provides evidence that demand is broadening but remains more exposed to the conventional semiconductor cycle. Hon Hai demonstrates the scale of AI deployment, while the central question is whether exceptional revenue growth produces durable margin and cash-flow improvement.

Source:

  1. TSMC; https://investor.tsmc.com/english/monthly-revenue/2026
  2. UMC; https://www.umc.com/en/IR_Financial/monthly_sales_revenue
  3. FOXCONN; https://www.honhai.com.tw/en-us/investor-relations/financial-information/reports?category=monthly
Results Deep Dive - Is CoreWeave Starting to Turn Scale Into Profit? Operating Margin Rebounds; 2020-Era A100 Capacity Is Renewed Through 2029
Analysis
Earnings & OperationsAI InfrastructureData CenterCloud Computing Semi Analysis

Results Deep Dive - Is CoreWeave Starting to Turn Scale Into Profit? Operating Margin Rebounds; 2020-Era A100 Capacity Is Renewed Through 2029

CoreWeave’s Q2 showed early operating leverage as adjusted operating margin rebounded to 5%. An A100 renewal through 2029 supports longer asset lives, but rising capex, interest expense and execution risk leave the profit model unproven.

Economics & FinanceTech

CoreWeave's Q2 was less about another quarter of exceptional AI demand than about the first credible signs that demand is converting into operating leverage. Revenue rose 112% yoy to $2.575bn, near the top of guidance and slightly above the ~$2.56bn consensus, while adjusted operating income of $128mn exceeded management's $30mn-$90mn range and lifted margin to 5% from 1% in Q1.

Will CoreWeave report >7% adjusted operating margin in 3Q2026?

Yes
0.00%
No
0.00%
0 Polls

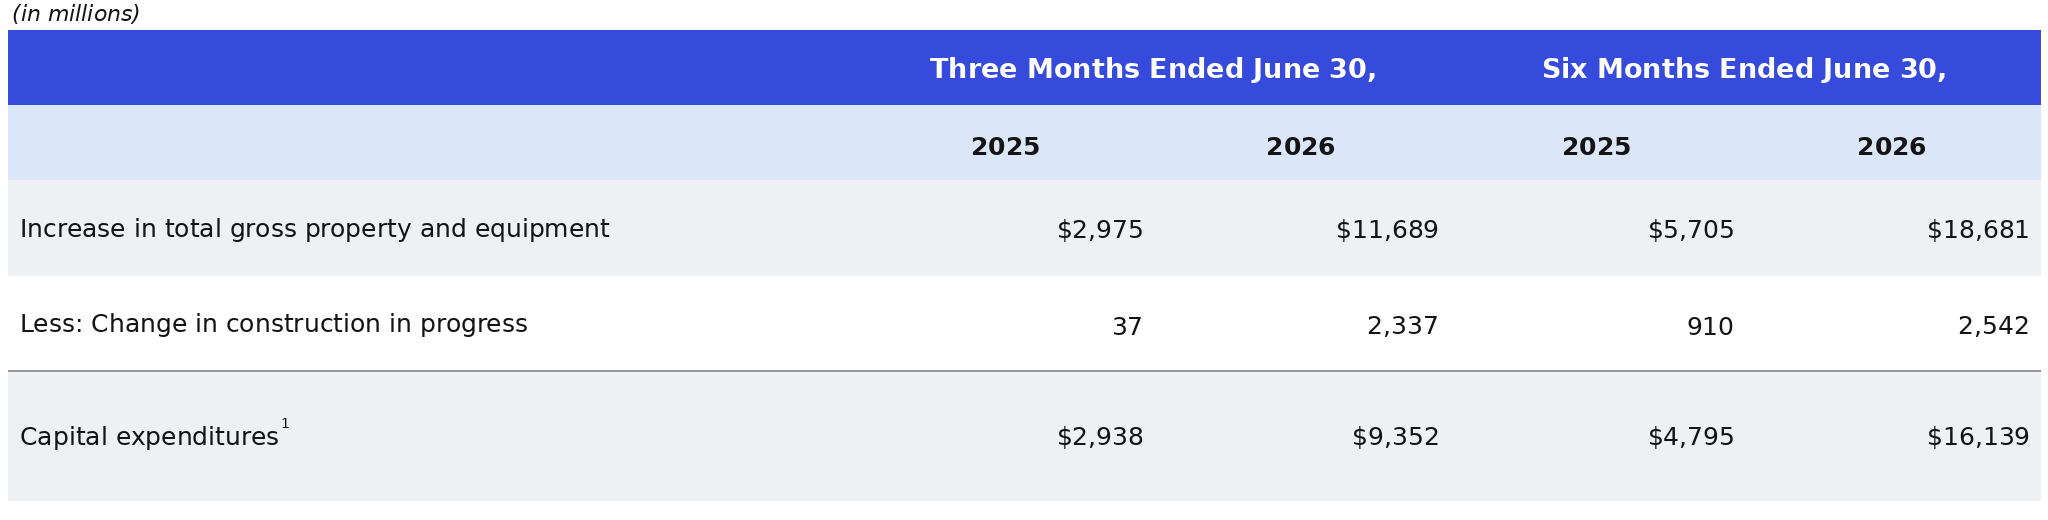
The inflection matters because it arrived before a roughly 25% July price increase cited on the call. But it is not yet proof of attractive corporate economics: adjusted operating margin remained far below 16% a year earlier, net loss was $626mn and quarterly capex reached $9.35bn.

The central question is no longer whether CoreWeave can sell scarce AI capacity; it is whether each new cluster can earn enough over its life to outrun depreciation, interest and technological obsolescence.

TL;DR: Key takeaways

  • The quarter strengthens the operating-leverage case, but does not complete it. Adjusted operating income rose by $107mn qoq on $497mn of incremental revenue, suggesting that already-built infrastructure is absorbing fixed costs more effectively as utilization increases. Q3 adjusted operating-income guide of $200mn-$260mn and low-double-digit Q4 margin target imply that this conversion should accelerate.

The caveat is the yoy comparison: adjusted operating income fell 36% and adjusted EBITDA margin slipped to 59% from 62%, reflecting depreciation and commissioning costs from the buildout. CoreWeave has shown a sequential turn, not yet a normalized margin.

  • Pricing and product mix provide a plausible route to the Q4 target.

Management said new contracts carry contribution margins 5-10 percentage points above those signed in recent quarters, reflecting pricing, newer systems and more storage, CPU, networking and software content.

Managed inference ARR increased from about $1mn at launch to more than $100mn, with at least $250mn targeted by year-end; non-GPU ARR exceeded $400mn.

These services can broaden the customer funnel and raise revenue per cluster, but remain small beside the core infrastructure business and are management-reported operating indicators rather than GAAP revenue categories.

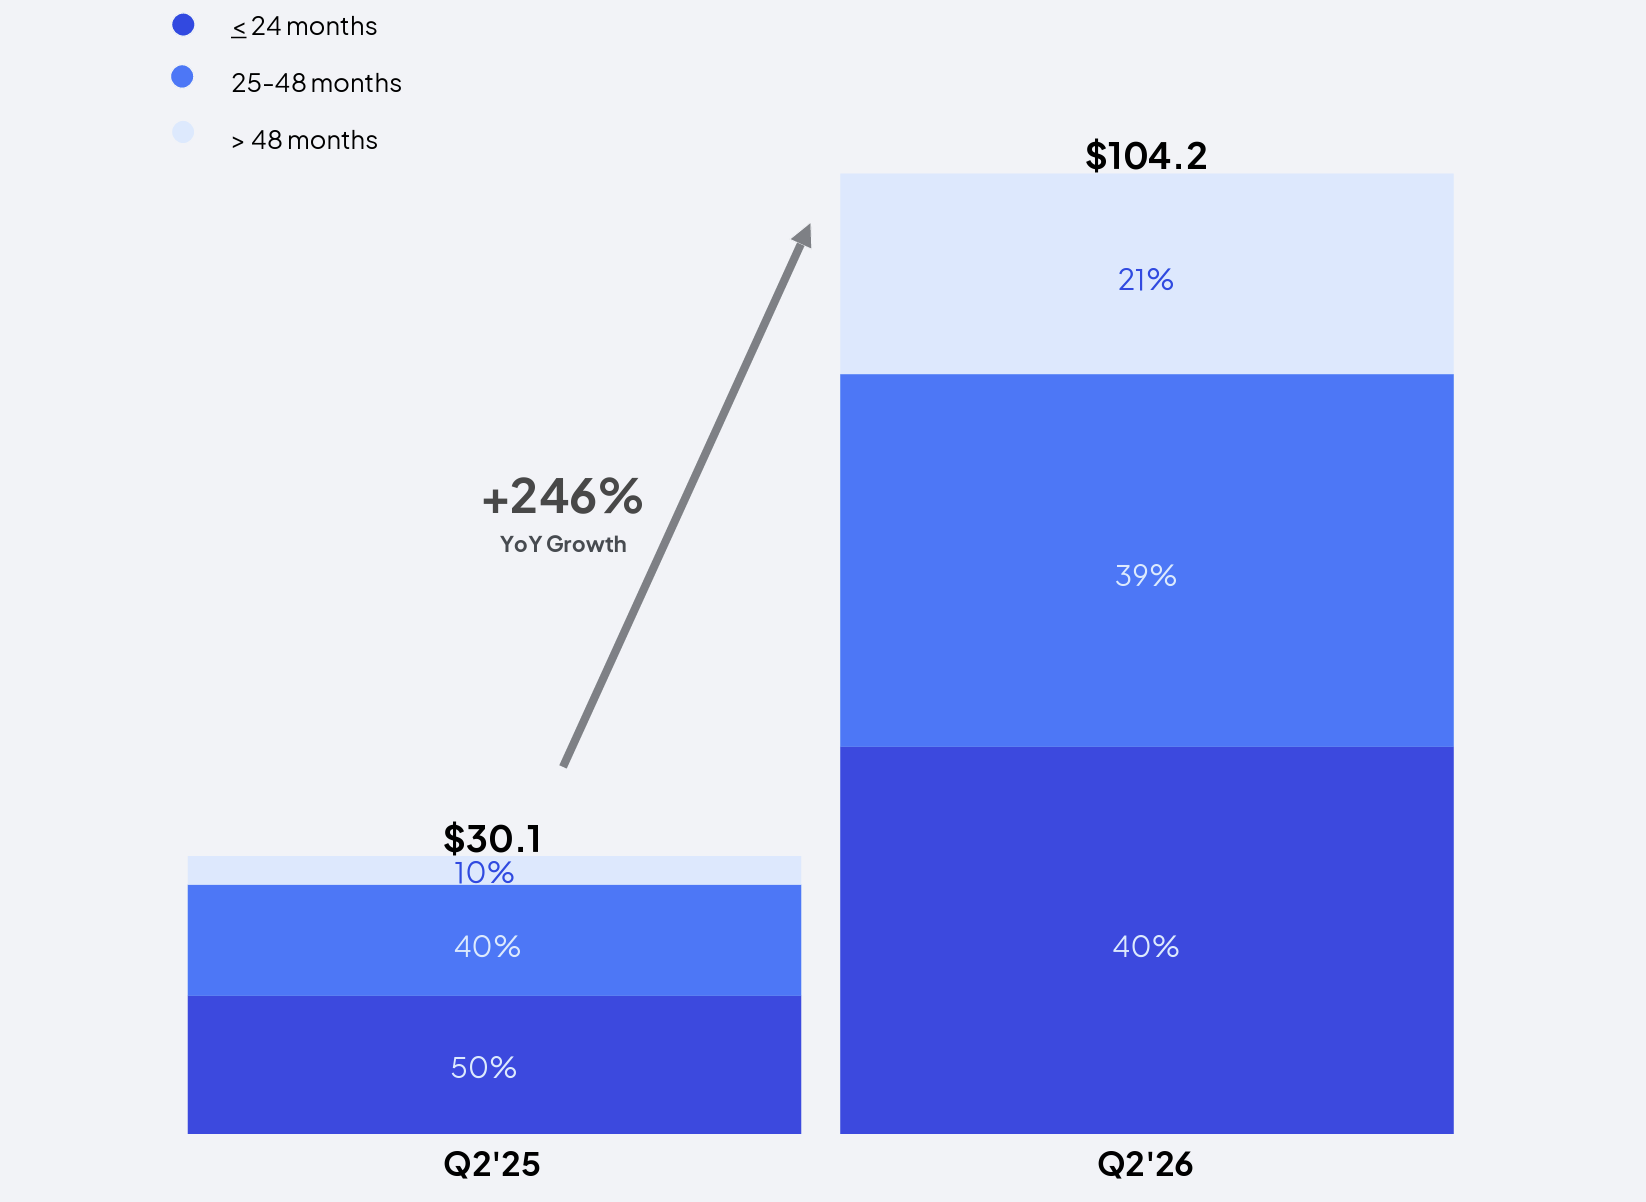
  • Backlog is becoming an execution schedule rather than a demand indicator. The $104.2bn balance was up 246% yoy and was followed by more than $25bn of early-Q3 commitments, leaving little doubt about customer appetite. What matters now is conversion: 40% is expected within 24 months, and recognition depends on delivery and service availability.

CoreWeave's 1.5 GW of active power and 4.2 GW contracted after quarter-end support future scale, but also expose the model to permitting, construction and supply-chain timing. Backlog has value only when powered capacity reaches customers at the underwritten return.

Q2 FY2026 Revenue Backlog. Source: CoreWeave
  • The A100 renewal is the call's most important evidence - and its easiest point to overstate. A customer extended use of the 2020-era GPU through 2029 at what management called attractive pricing. If the initial contract has repaid the associated debt, a second term could materially raise lifetime returns without another GPU purchase.

That suggests obsolescence may be slower than feared during a supply-constrained cycle. It does not make old hardware costless or appreciating: power, space and maintenance remain, and one renewal cannot establish fleet-wide residual value.

  • Financing innovation widens the market, while increasing the importance of discipline. Management said DDTL 5.5 can finance shorter-duration contracts preferred by enterprises, potentially opening a 2-3 year market that previously did not fit five-year asset-backed structures. Shorter contracts may command higher pricing, but leave more renewal risk. With FY2026 capex raised to $35bn-$39bn and interest expense already $640mn in Q2, cheaper or more flexible debt helps only if contract-level returns remain above the cost of capital.
Source: CoreWeave

Key debates

  • Will $104.2bn of backlog convert on schedule and at attractive returns?
  • Is the A100 renewal representative of the wider fleet?
  • Can financing costs fall faster than the asset base expands?

Source:

  1. Company press release; https://investors.coreweave.com/financials/quarterly-results/default.aspx
Results Deep Dive - Lumentum Revenue Doubles And 1Q2027 Guidance Soars; All Concerns Lifted?
Analysis
HyperscalersAI InfrastructureData CenterEarnings & Operations Semi Analysis

Results Deep Dive - Lumentum Revenue Doubles And 1Q2027 Guidance Soars; All Concerns Lifted?

Lumentum delivered a broad Q4 FY2026 beat and issued Q1 guidance substantially above expectations, as AI-driven data-center demand lifted both optical components and systems revenue.

Economics & FinanceTech

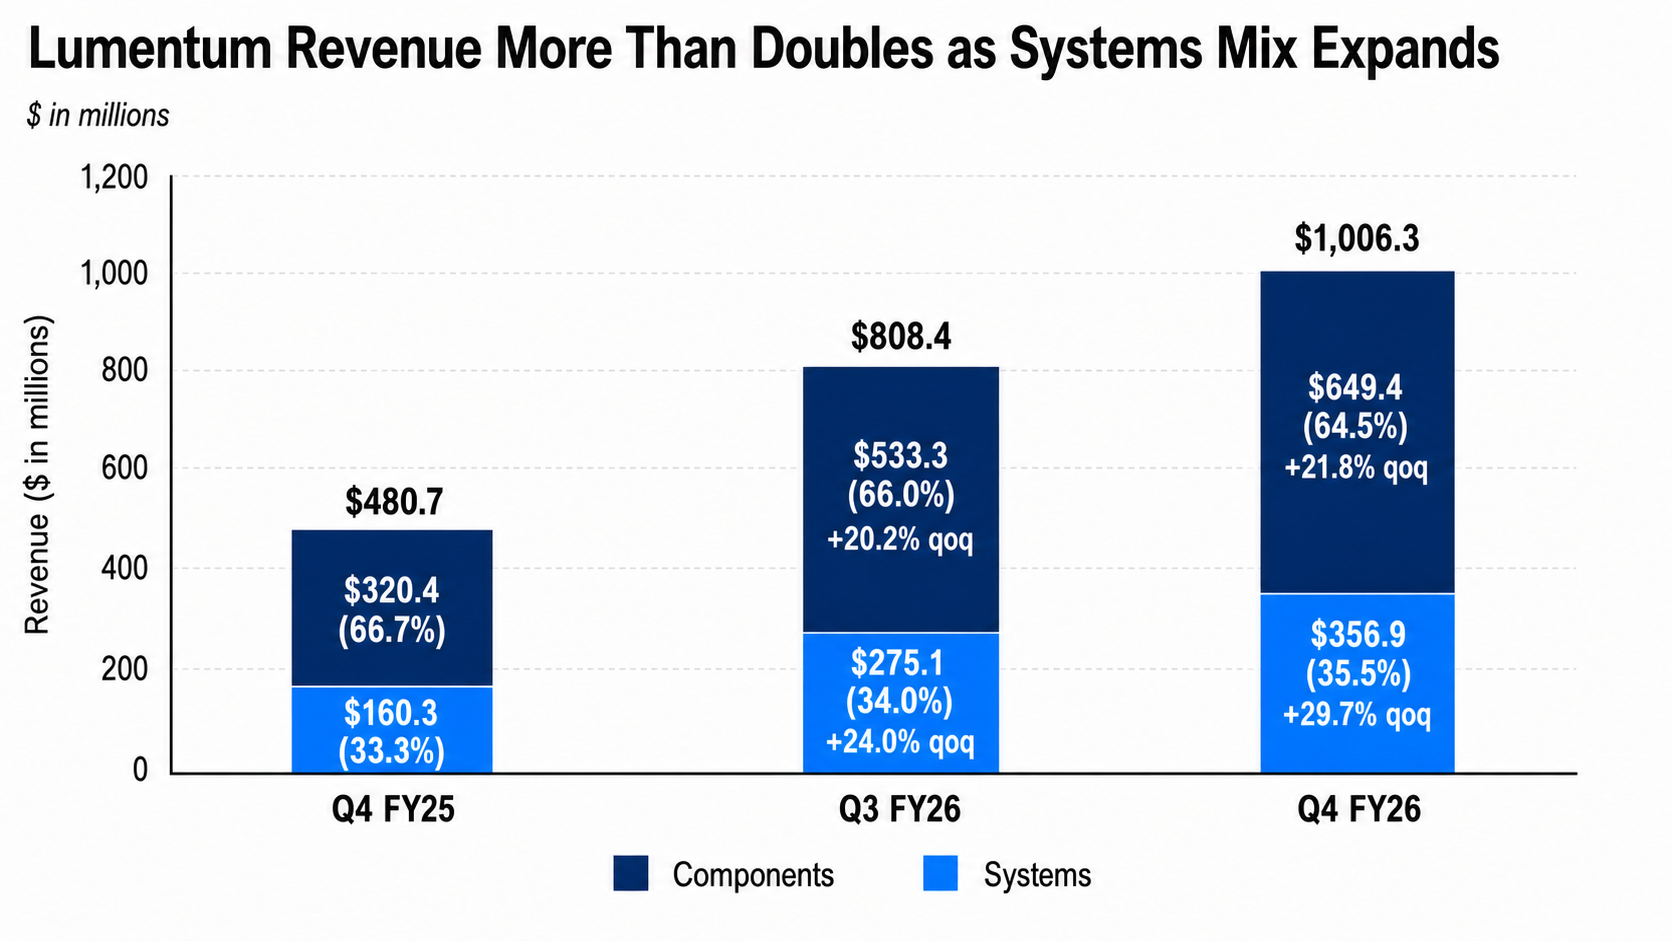
Lumentum delivered a broad Q4 FY2026 beat and issued Q1 guidance substantially above expectations, as AI-driven data-center demand lifted both optical components and systems revenue. Q4 revenue rose 109% yoy and 25% qoq to $1.01bn, ahead of consensus of ~$985mn, while non-GAAP EPS of $3.23 exceeded the $2.95 estimate.

Will Lumentum achieve Q1 FY2027 revenue above $1.25bn?

Yes
0.00%
No
0.00%
0 Polls

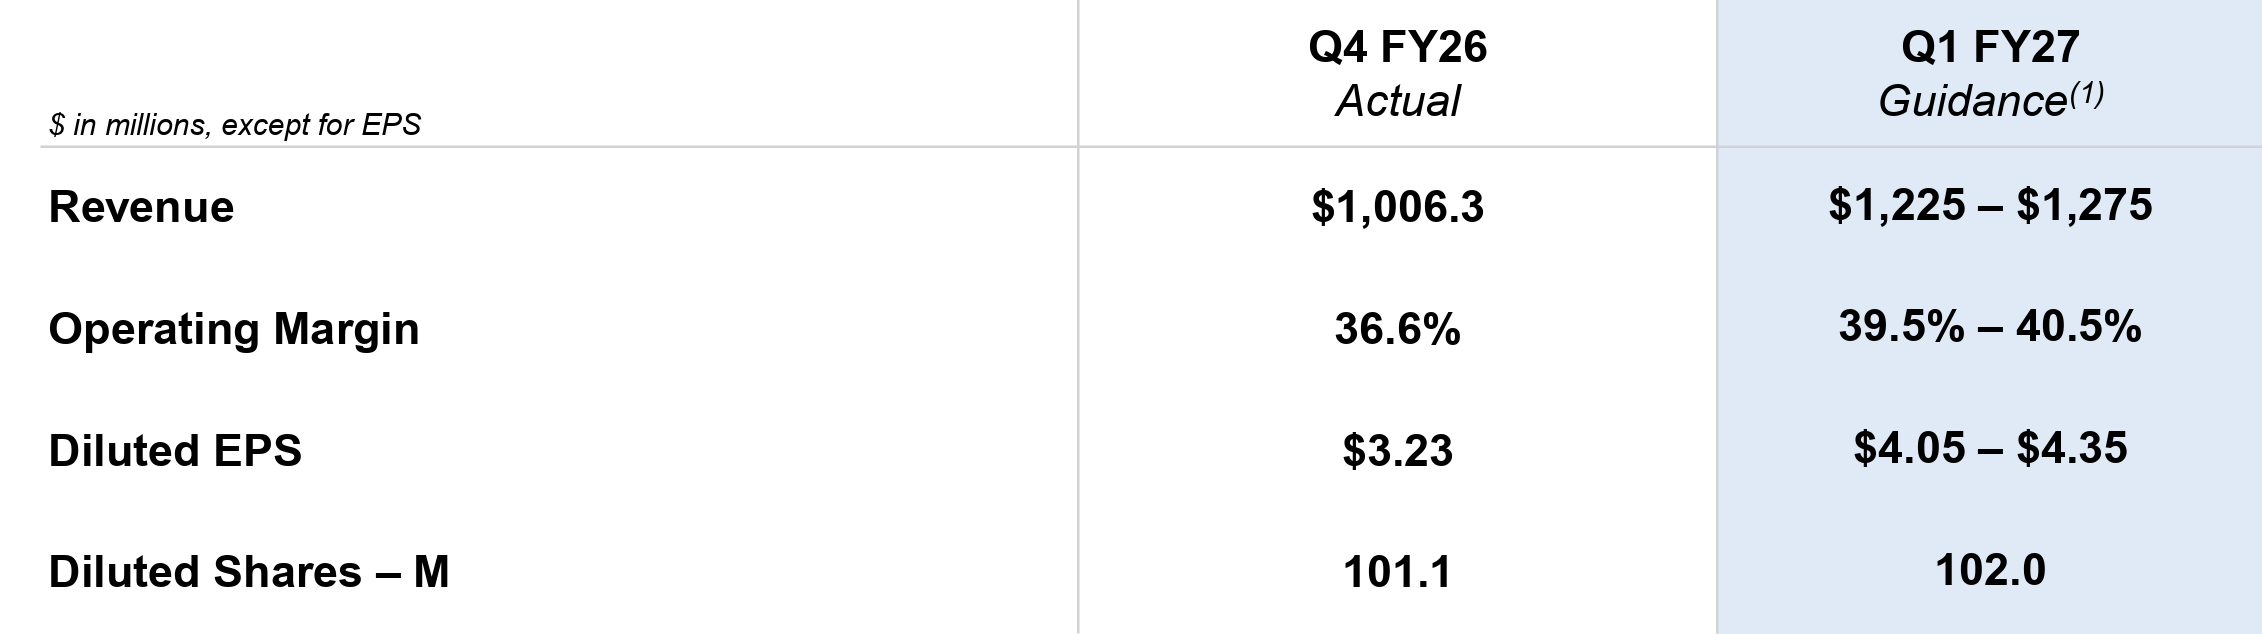
The headline GAAP net loss of $7.2bn primarily reflected a ~$7.8bn non-cash loss related to the conversion of convertible notes, rather than a deterioration in operating performance. The more consequential incremental information was management’s Q1 outlook: revenue guidance of $1.225bn-$1.275bn was well above consensus of ~$1.16bn, while the non-GAAP operating-margin outlook reached 39.5%-40.5%.

TL; DR: Key Takeaways

Revenue growth broadened across both reporting segments. Components revenue increased 103% yoy to $649mn, above consensus of ~$637mn, while systems revenue rose 123% to $357mn, also exceeding expectations. The faster systems growth suggests demand is extending beyond individual optical components toward more integrated connectivity products.

Source: Lumentum

Margins expanded faster than revenue. Non-GAAP gross margin reached 50.4%, versus 37.8% a year earlier and consensus of 48.8%. Non-GAAP operating margin rose to 36.6% from 15.0%, supporting non-GAAP net income of $326mn, up 416% yoy. The improvement may reflect a richer AI-related product mix, stronger utilization and operating leverage.

Q1 guidance reached the company’s target model more than one quarter ahead of schedule. Revenue guidance of $1.225bn-$1.275bn was substantially above consensus of ~$1.16bn. The $1.25bn midpoint implies ~24% qoq growth, while non-GAAP EPS guidance of $4.05-$4.35 exceeded expectations of ~$3.63. The 40% non-GAAP operating-margin midpoint also represents a further ~340 bps sequential expansion.

Source: Lumentum

The $7.2bn GAAP loss was driven by a non-cash debt-conversion charge. The loss was mainly caused by the difference between the carrying value of convertible debt and the fair value of equity delivered in its conversion. It did not represent a comparable cash outflow or operating loss. However, the transaction may reduce future interest expense while increasing share count and EPS dilution.

AI optics moved closer to the compute system. Management cited initial revenue from optical circuit switching, progress in 1.6T cloud modules, rising demand for high-power CPO lasers and initial orders for external laser-source modules. These developments support the view that optical connectivity is moving closer to the compute system, although the timing and scale of commercial adoption remain uncertain.

A muted share reaction reflected elevated expectations. The stock was little changed after hours despite the beat and strong guidance, following a 43% gain over the previous six months. That reaction does not diminish the operating results, but indicates that investors may now require continued upside to already-rising estimates.

Key debates

  • Is a ~40% non-GAAP operating margin sustainable?
  • When will 1.6T, CPO and optical circuit switching become material revenue contributors?
  • What is the continuing dilution impact of the debt conversion?
  • How exposed is the outlook to hyperscaler concentration?

Source:

  1. Company press release; https://investor.lumentum.com/quarterly-results/default.aspx
Breaking News - SK Hynix-Linked Vehicle Becomes Kioxia’s Top Shareholder
News
Memory ChipSemiconductorEquityCapital MarketsAI InfrastructureBreaking News Semi Analysis

Breaking News - SK Hynix-Linked Vehicle Becomes Kioxia’s Top Shareholder

Kioxia Holdings said on August 11 that a Bain Capital investment vehicle linked to SK hynix has become its largest shareholder after former parent Toshiba further reduced its stake.

Economics & FinanceTech

Kioxia Holdings said on August 11 that a Bain Capital investment vehicle linked to SK hynix has become its largest shareholder after former parent Toshiba further reduced its stake.

Will SK Hynix exercise its rights and pass all regulatory steps to become Kioxia's largest shareholder by the end of 2027?

Yes
0.00%
No
0.00%
0 Polls

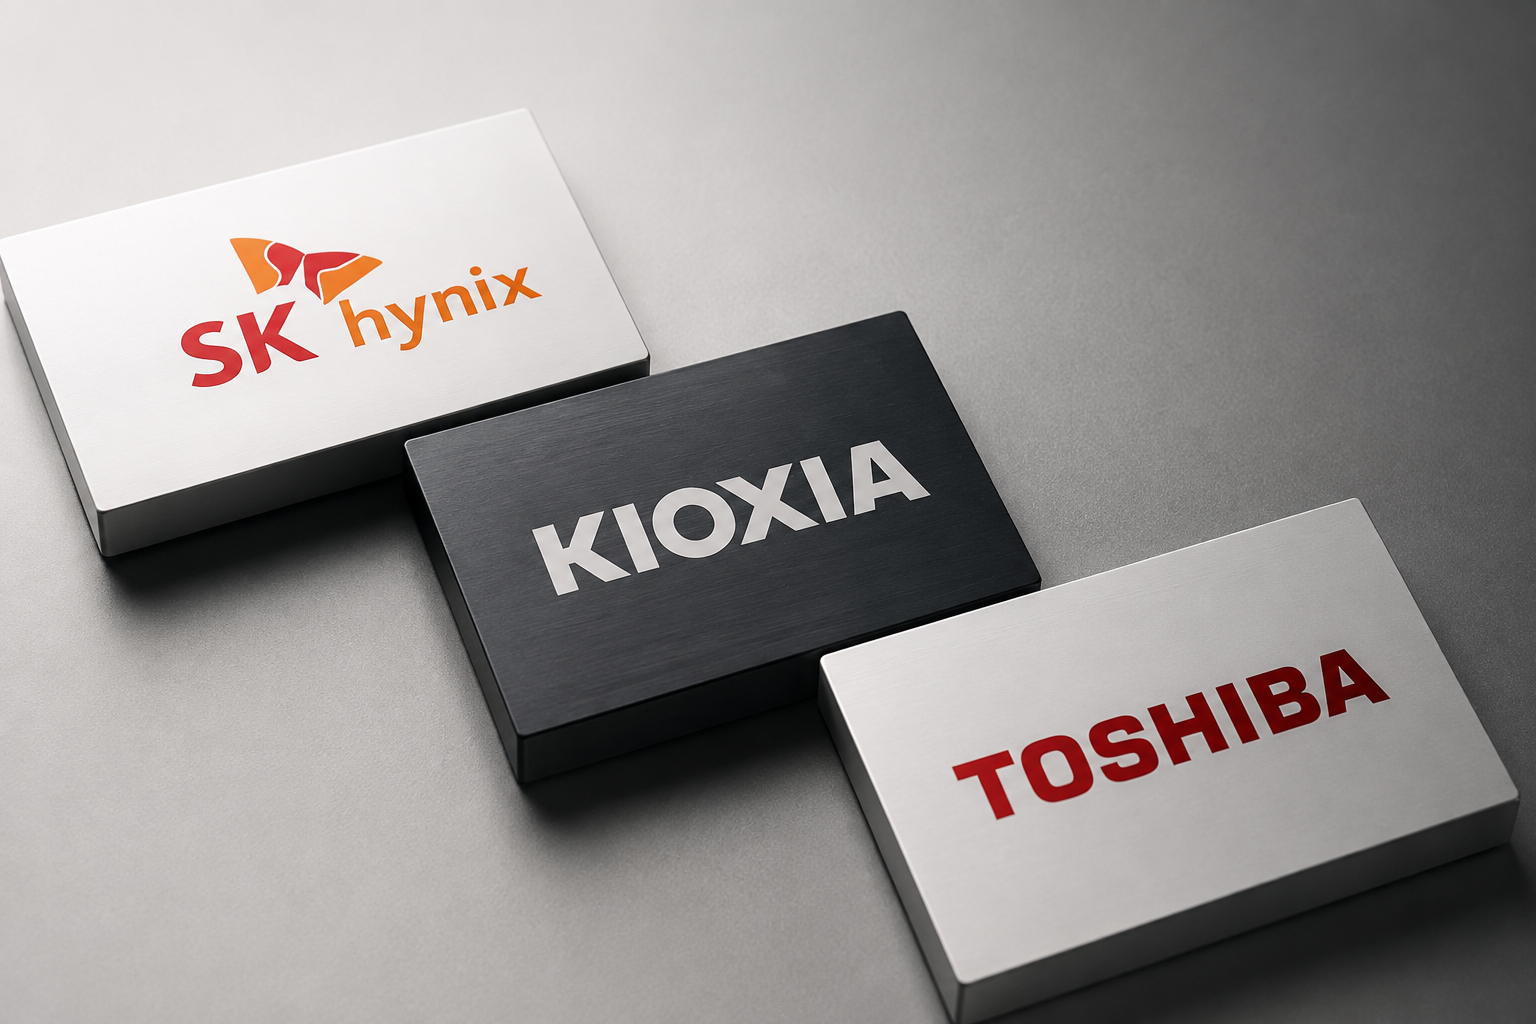
Toshiba’s holding in the Japanese flash-memory maker fell to about 14.12% as of August 3, from 14.48%, leaving BCPE Pangea Cayman2 — a vehicle established by Bain Capital — as Kioxia’s biggest shareholder with a 14.19% stake.

The ownership structure is notable because SK hynix holds bonds that can be converted into substantially all of the voting rights of BCPE Pangea Cayman2. Kioxia has previously identified the arrangement as a potential conflict-of-interest risk, given that SK hynix is also one of its major competitors in the global memory-chip market.

The structure dates back to 2018, when a Bain-led consortium acquired Toshiba’s memory-chip business, later renamed Kioxia. SK hynix participated in the consortium but agreed to limit its voting rights in Kioxia to no more than 15% until 2028 unless Kioxia approves a larger stake.

The latest change does not mean SK hynix directly controls Kioxia, but it puts an investment vehicle closely tied to the Korean chipmaker at the top of Kioxia’s shareholder register. The arrangement could draw greater attention to governance, competitive conflicts and SK hynix’s longer-term position in Kioxia as the 2028 voting-right restriction approaches expiry.

Source:

  1. Bloomberg; https://www.bloomberg.com/news/articles/2026-08-11/kioxia-says-investment-vehicle-for-sk-hynix-is-top-shareholder
Silicon Bakery - How Intensified Will the AI Infra Race Be? Behind: Intel's Capital Raising, Nvidia's AI Funding Plan, Microsoft's Bet on Indigenous Chips And More...
Analysis
SemiconductorMemory ChipIndustry PulseData CenterAI InfrastructureSilicon BakeryMag 7 Semi Analysis

Silicon Bakery - How Intensified Will the AI Infra Race Be? Behind: Intel's Capital Raising, Nvidia's AI Funding Plan, Microsoft's Bet on Indigenous Chips And More...

The AI infrastructure race intensifies as Intel raises capital, Nvidia builds a massive financing ecosystem, and Microsoft advances custom AI chips. Together, they signal a shift toward a broader AI supply chain powered by chips, capital, and scalable compute infrastructure.

Economics & FinanceTech

TL;DR:

  1. Intel Plans $20B Equity Raise
  • Intel is reportedly upsizing its share sale to around $20B, with demand exceeding $100B.
  • Shares are expected to price at ~$95 or above, about 6.5% below Friday’s close.
  • The fundraising supports CEO Lip-Bu Tan’s balance sheet cleanup strategy and comes amid a broader AI-driven capital raising wave.
  1. Nvidia Secures $500B AI Infrastructure Financing Network
  • Nvidia is partnering with Apollo, BlackRock, Blackstone, Brookfield, KKR, and Goldman Sachs to arrange up to $500B in AI infrastructure financing.
  • The plan focuses on debt financing for data centers and compute capacity using third-party capital.
  • The move highlights massive AI infrastructure demand but also raises concerns over AI spending sustainability and circular financing risks.
  1. Microsoft Prepares Maia 300 AI Chip Launch
  • Microsoft plans to unveil Maia 300 in September and is negotiating with TSMC for 300,000+ chips by 2027.
  • The custom AI accelerator aims to reduce reliance on Nvidia GPUs across Azure, Copilot, and OpenAI workloads.
  • Scaling risks remain due to TSMC capacity constraints, CoWoS packaging shortages, and rising competition from other custom AI chip developers.

Intel Is Said to Near Share Sale Upsize to Raise $20 Billion

Intel Corp. is seeking to increase the amount it’s raising in a share sale to about $20 billion, according to people familiar with the matter, a third more than it was targeting when it announced the deal Monday morning.

Will Intel Stock Price Recover to >US$105 by the end of August 2026?

Yes
61.89%
No
38.11%
530 Polls

The chipmaker is poised to price the offering at around $95 per share or above, the people said. At that level, the pricing would represent a discount of 6.5% to Friday’s closing price.

The offering could increase to well over $20 billion if a so-called over-allotment option is exercised, one of the people said. The share sale has drawn more than $100 billion in demand, they said.

Deliberations are ongoing and details including the size and pricing could still change, the people said. A spokesperson for Intel declined to comment.

JPMorgan Chase & Co., Goldman Sachs Group Inc., Morgan Stanley and Citigroup Inc. are working on the offering, according to a statement earlier. The deal is multiple times oversubscribed.

Intel’s shares were little changed in after-hours trading after falling 4.1% on Monday during normal market hours. They remain up roughly 164% this year, after Chief Executive Officer Lip-Bu Tan made cleaning up Intel’s finances a priority. The effort has included attracting outside investments from the US government and even chip rivals such as Nvidia Corp.

The year’s biggest US equity offerings have been dominated by companies riding the boom in artificial intelligence spending. Alphabet Inc. is in the process of raising as much as $85 billion through equity offerings, including so-called at-the-market share sales and equity-linked deals. And Oracle Corp.’s fundraising plans include a $20 billion at-the-market share sale program.


Nvidia Taps Wall Street for $500 Billion Funding Commitment

US investment giants including Apollo Global Management Inc., Blackstone Inc., BlackRock Inc. and Brookfield Asset Management are partnering with Nvidia Corp. to source $500 billion in financing for artificial intelligence infrastructure.

The coalition, which also includes Goldman Sachs Group Inc. and KKR & Co., will “create dedicated pools of capital at significant scale at attractive rates for Nvidia customers,” according to a statement Monday. Nvidia Chief Executive Officer Jensen Huang said in a CNBC interview that he approached only the six firms for the commitment, and none turned him down.

The effort comes with a huge headline figure but few details on the timing and structure of the financings, or how much the plan goes beyond the string of AI deals that are already driving a large chunk of Wall Street’s biggest transactions. Executives indicated that it will focus on debt financing to provide access to compute for Nvidia’s largest customers and that there are already many deals in the works that would qualify toward this commitment.

Nvidia has already signed hundreds of billions of dollars worth of deals with companies across the AI ecosystem, stoking concerns from some investors that the chipmaking giant is inflating demand and valuations across the industry through the circular nature of such agreements.

Nvidia Credit Risk Surges as $750 Billion AI Push Raises Financing Fears
The cost of protecting Nvidia Corp.’s debt against default surged by the most on record Monday, after reports of the chipmaker being in conversations on more than $750 billion of artificial intelligence infrastructure deals stoked fears about the company’s obligations.

Now, the firm is publicly tapping the biggest private markets firms to provide funding for its customers amid the trillions of dollars that are expected to be needed for the data centers, power stations and chips that will power the next era of AI.

The money will all be third-party capital, Huang said in the CNBC interview, which also featured executives from each of the six Wall Street firms.

“It’s a big infrastructure build, and the capital markets are signaling that there’s lots of capital available to support it,” Goldman Sachs CEO David Solomon said, adding that his firm is trying to find different ways of “getting the capital to the right places to extend this or accelerate this.”

Such deals are set to start coming to market within months, the person said.

As the only bank in the partnership, Goldman Sachs is positioning itself to be the lead bookrunner on the public debt deals coming to market for the deal. It will also gather investment returns from debt distributed through its asset-management arm, which oversees more than $4 trillion in assets.


Microsoft plans Maia 300 chip reveal in September

Microsoft is targeting a public unveiling of its next-generation Maia 300 AI accelerator as soon as September. It has also entered talks to secure manufacturing capacity for more than 300,000 units from TSMC, with delivery planned for 2027, The Information reported Monday.

Taiwan Semiconductor Manufacturing is the direct supply-chain beneficiary. Microsoft is negotiating with TSMC to fill an order that dwarfs the tens of thousands of Maia 200 chips produced to date. The longer-term ambition is capacity for more than one million units, though component supplies and ongoing packaging negotiations could constrain that target.

Will Microsoft or TSMC Officially Announce Maia 300 Partnership by end of 3Q2026?

Yes
21.93%
No
78.07%
538 Polls

The scale of the ambition marks a sharp turn from the Maia program's troubled recent history. The Maia 200 was delayed after early tests fell short of internal goals and has since been deployed in only a small number of data centers. CEO Satya Nadella told investors on Microsoft's Q4 FY2026 earnings call on July 29 that the chip delivers 30% better performance per dollar compared to existing hardware and is scaling to support OpenAI and MAI models. The limited footprint, however, underscores how far the homegrown silicon program still has to go.

Reducing dependence on Nvidia is a stated priority for Nadella. The Maia line is central to that effort. Microsoft believes its chips can run both in-house and OpenAI models at lower cost, and the company is ramping internal usage through Azure AI Foundry and Copilot while pitching the technology to large external cloud customers.

Anthropic is among the names Microsoft hopes to win over. That pitch has a complication: Anthropic confirmed earlier this month that it is forming its own internal semiconductor team to design custom chips for its Claude models, making the AI startup simultaneously a potential Maia 300 customer and an emerging long-term competitor in custom silicon.

Execution risks are real. J.P. Morgan analysts flagged that projects concentrated on TSMC's N3 process and CoWoS advanced chip-packaging technology face supply tightness through 2027, a constraint directly relevant to Microsoft's Maia 300 ramp.

All eyes will turn to Nvidia's Q3 FY2027 earnings, expected August 26, where management commentary on hyperscaler custom silicon competition will be parsed closely. A formal Maia 300 reveal in September, if it materializes, could serve as an early catalyst for that conversation — and a test of whether Microsoft's second-generation chip can deliver at a scale the first one never reached.


Source:

  1. Bloomberg; https://www.bloomberg.com/news/articles/2026-08-10/intel-is-said-to-near-share-sale-upsize-to-raise-20-billion?srnd=homepage-asia
  2. Bloomberg; https://www.bloomberg.com/news/articles/2026-08-10/nvidia-to-team-with-wall-street-on-500-billion-package-ft-says
  3. Yahoo!finance; https://finance.yahoo.com/technology/ai/articles/microsoft-plans-maia-300-chip-140432692.html
Results Review - Microchip Beats Q1 Estimates as Data Center and Defense Growth Accelerate
Quick Take
Earnings & OperationsAI InfrastructureSemiconductorData CenterIndustrials Semi Analysis

Results Review - Microchip Beats Q1 Estimates as Data Center and Defense Growth Accelerate

Microchip delivered a clear Q1 FY2027 beat and issued Q2 guidance substantially above expectations. Shares rose sharply following the release, consistent with a reset in near-term earnings expectations rather than revenue alone.

Economics & FinanceTech

Microchip delivered a clear Q1 FY2027 beat and issued Q2 guidance substantially above expectations. Revenue rose 38% yoy and 13.2% qoq to $1.485bn, above both the $1.456bn midpoint and the high end of management's prior range. Non-GAAP EPS was $0.76 versus management's $0.67-$0.71 outlook and ~$0.70 consensus. The larger surprise was forward-looking: Q2 non-GAAP EPS guidance of $0.91-$0.95 compares with ~$0.80 consensus, while the 66%-67% gross-margin guide moves above the company's 65% long-term model. Shares rose sharply following the release, consistent with a reset in near-term earnings expectations rather than revenue alone.

Will data center account for more than 20% of Microchip’s revenue in Q2 FY2027?

Yes
0.00%
No
0.00%
0 Polls

TL; DR: Key Takeaways

The earnings beat reflected operating leverage as well as stronger sales. Non-GAAP gross margin reached 63.8%, up 220 bps qoq and 55 bps above the high end of prior guidance, while non-GAAP operating margin expanded to 35.1%. Higher factory utilization, lower underutilization charges and product mix converted a 13.2% sequential revenue increase into a much larger profit improvement.

Q2 guidance exceeded expectations by an unusually wide margin. The $1.589bn-$1.618bn revenue range implies 7%-9% qoq growth and ~40.6% yoy growth at the midpoint. More importantly, the $0.93 non-GAAP EPS midpoint is ~16% above the cited consensus, suggesting estimates must move higher even without assuming another revenue beat.

Data center is becoming material, but the growth case extends beyond one end market. Microchip has said its Data Center Solutions unit should reach ~$500mn of calendar-2026 revenue, with another ~$500mn expected from data-center sales across power management, MCUs, analog, security, FPGA, timing and memory products. Management also described broad improvement across industrial, automotive and aerospace and defense, supporting a recovery-plus-structural-growth interpretation.

Source: Microchip

The 66%-67% gross-margin guide is notable, but not yet a new steady state. Favorable mix, licensing revenue, pricing, lower inventory write-downs and reduced underutilization costs all contribute. Some inputs can vary by quarter, and management cautioned against extrapolating further upside from this level.

Inventory and leverage are improving, but remain important constraints. Company inventory days fell to 175 from 185, while net debt declined by ~$170mn. The direction is positive, yet inventory remains elevated and long-term debt was $5.36bn at quarter-end, keeping cash deployment focused on deleveraging rather than buybacks.

Key Debates

  • Can non-GAAP gross margin remain near 66.5% after Q2?
  • How much of the current order strength reflects durable demand rather than supply-chain repositioning?
  • Can data-center revenue approach ~$1bn in calendar 2026 without becoming more concentrated?
  • Will industrial and automotive recovery add a second leg of growth?

Source:

  1. Company press release; https://ir.microchip.com/news-events/press-releases/detail/1409/microchip-technology-announces-financial-results-for-first-quarter-of-fiscal-year-2027
Silicon Bakery - Microsoft, Amazon, Meta, and AMD: Which Can Prove the AI Payoff?
Analysis
Capital MarketsIndustry PulseAI InfrastructureSilicon BakeryMag 7 Semi Analysis

Silicon Bakery - Microsoft, Amazon, Meta, and AMD: Which Can Prove the AI Payoff?

The AI capex race has become a monetization test. Microsoft, Amazon, Meta and AMD show how quickly spending converts and whether the revenue will last.

Tech

Microsoft, Meta, Amazon, and AMD all reported their latest results within seven days. Three are buying the infrastructure; AMD is selling into it.

Microsoft added $450 billion in market value in one session (around 15%), the largest single-day market-cap gain ever recorded by a company, surpassing chip giant Nvidia's previous record one-day gain of $441 billion on April 9, 2025. Meta’s stock fell more than 9% intraday.

If Wall Street had simply turned against AI spending, these reactions would make no sense.

Amazon rose 15.3% the following day in its biggest single-session move since 2012, and AMD beat on revenue guidance and adjusted EPS and still dropped 6.6% in the first full session.

All three infrastructure buyers are spending more, not less.

My read is that investors have stopped asking how much is being spent and started asking whether the money already has a customer’s name on it.

Which of these four are you buying after this week?

Microsoft
12.50%
Amazon
19.02%
Meta
23.37%
AMD
39.67%
None, I'm sitting this one out
5.44%
184 Polls

Microsoft turned new capacity into revenue almost immediately

Azure revenue grew 43%, beating the roughly 40% analysts expected, and Microsoft guided for about 45% constant-currency growth next quarter. Management said the extra capacity brought online during the quarter was quickly sold.

Source: Reuters

Commercial remaining performance obligation, meaning contracts signed but not yet booked as revenue, rose 84% to $678 billion, more than twice Microsoft’s full-year revenue.

However, its lower reported capex outlook partly reflects a longer assumed life for data centers, shifting more leases outside capex without reducing the commitment. Another $329.1 billion of data-center leases have not yet commenced.

Meta vs. Amazon: Both face cash-flow pressure, but on different measures

Meta generated $31.86 billion in quarterly operating cash and spent $31.08 billion on capex. This absorbed about 97.5% of the cash the business produced, leaving free cash flow of $784 million, down 91%.

Amazon’s trailing- 12-month free cash flow swung from positive $18.2 billion to negative $7.6 billion, while its 2026 capex plan rose 10% to roughly $220 billion. Its shares rallied anyway, so why did investors give it a pass?

Source: Reuters

The reason could be that Amazon’s AWS revenue accelerated 37% to $42.2 billion, its best growth in 18 quarters, and segment operating income jumped from $10.2 billion to $16.6 billion (about 63%). Contracted backlog climbed from $364 billion to $496 billion in one quarter.

Now, Meta did provide narrower evidence that AI is improving the ad machine. Advantage+ reached a $75 billion annual revenue run rate, while newer models lifted clicks and conversions in testing. The problem is these figures show that the tools work, but not how much incremental revenue the current infrastructure build produced or whether it has earned an adequate return.

In simple terms, it is clear that Meta’s revenue grew 28% to $60.8 billion, ad impressions rose 14% and average price per ad increased 12%. And this sounds like proof that AI is already paying off, and part of it probably is, but neither figure separates model-driven improvements from the broader ad cycle.

Put simply, Amazon can point to a customer waiting for its next server. Meta can point to a much better version of Facebook and Instagram, but not how much of the improvement belongs to the latest round of infrastructure spending.

This is probably why the market gave Amazon more room than Meta. Most of its 2027 AWS compute capacity has already been reserved, with commitments stretching into 2028. The cash is leaving first, but customers are already waiting at the other end.

Meta’s AI Cloud Pivot: Monetization Strategy or Overbuild Signal?
Bloomberg (July 1) - Meta is reportedly developing a cloud infrastructure business that would sell access to AI computing power and models to outside customers. The plan could put Meta into a new competitive lane against cloud leaders such as Amazon Web Services, Microsoft Azure, and Google Cloud. The business would

AMD monetizes the buildout earlier, but its stock had already priced in more

AMD turns everyone else’s capex into revenue as it sits earlier in the monetization chain. Revenue was a record $11.54 billion, up 50%. Data center revenue more than doubled to $6.72 billion, now 58% of the company, and third-quarter guidance of roughly $13 billion beat the $12.5 billion Street number.

Source: Reuters

The shares still fell before the open after more than doubling this year, even though AMD is already turning AI demand into revenue. The reaction shows that it faced an exceptionally high bar.

Intel’s Big Quarter: Real Comeback, or Just Better Timing?
Intel’s Q2 numbers support the case that inference and agentic AI are broadening the CPU growth cycle. The harder question is whether Intel is winning it.

The verdict? Next two quarters will test this ranking

AMD’s revenue rises the moment the other three write a cheque, which is why data center revenue more than doubled to $6.72 billion in a quarter.

And it still fell 9%. That is the most useful signal in the week: the market is not merely paying for speed of conversion, it wants confidence that the demand lasts.

Simply put, Amazon rose 15.3% and Microsoft just over 15%, so the percentage moves were roughly the same. But Microsoft’s nearly $450 billion gain was larger in dollars due to its larger starting market cap, so Amazon’s smaller base produced a smaller dollar gain. So, for now, my ranking is:

  1. Amazon: Strongest current evidence of contracted demand so far, with most 2027 capacity already reserved and commitments stretching into 2028.
  2. Microsoft: Fastest near-term conversion, with new Azure capacity sold almost as quickly as it came online. But its spending advantage is smaller than it looks, because the headline capex figure understates the commitment.
  3. Meta: Not necessarily the weakest monetizer, just the hardest one to measure. AI is already improving engagement, ad clicks and conversions, so the buildout is producing something. But Meta still cannot show how much incremental revenue the latest spending created or whether that return is keeping pace with the cost.

Next, keep an eye on:

Amazon: AWS growth needs to stay near the mid-30s without giving back the margin gain as Amazon works through its $496 billion backlog. If backlog keeps rising while AWS margins fall or free cash flow deteriorates further, this growth is getting more expensive.

Microsoft: Azure needs to meet the roughly 45% growth guide with stable cloud gross margin. A miss alongside more than $50 billion of Q1 capex would weaken the cleanest case.

Meta: It depends on whether operating cash flow starts pulling away from capex while ad growth holds. If capex remains close to operating cash flow, a cleaner margin alone will not prove monetization has caught up.

AMD: Q3 revenue needs to land near the $13 billion guide, with non-GAAP gross margin holding around 56% and Data Center revenue continuing to accelerate. Beyond the quarter, watch whether the Helios and MI400 ramp turns AMD's announced partnerships into actual revenue without putting pressure on margins.

Memory Chips: Peak Cycle, or Just Peak Acceleration?
AI demand is keeping memory chips scarce and prices high. But with expectations already sky-high, the next leg of the trade may be much harder.

In your opinion, which company has the strongest AI monetization case right now?

Microsoft: New Azure capacity is selling immediately
9.41%
Amazon: AWS growth, margins, backlog
18.82%
Meta: Improving engagement and ad performance
41.18%
AMD: Data-center demand is converting into revenue
30.59%
170 Polls

Sources

Amazon: Amazon.com Announces Second Quarter Results

AMD: AMD Reports Second Quarter 2026 Financial Results

Meta: Meta Reports Second Quarter 2026 Results

Meta: Second Quarter 2026 Results Conference Call

Microsoft: Earnings Release FY26 Q4

Microsoft: Microsoft Fiscal Year 2026 Fourth Quarter Earnings Conference Call

Microsoft: Press Release & Webcast

Reuters: Amazon lifts investment plans after strong cloud sales; shares jump

Reuters: Microsoft says cash will keep flowing from AI, shares rise

Reuters: Microsoft sets record with near $450 billion single-day gain in market value

Reuters: Wall Street ends sharply higher, lifted by soaring Microsoft

Yahoo Finance: Amazon Raised Its AI Spending And Had Its Best Day In Years


Result Review - Western Digital Beats Q4 Expectations as Gross Margin Reaches 54.4%
Quick Take
Earnings & OperationsAI InfrastructureData CenterCloud Computing Semi Analysis

Result Review - Western Digital Beats Q4 Expectations as Gross Margin Reaches 54.4%

Western Digital delivered a Q4 FY2026 beat, with the clearest upside in profitability rather than revenue. Management said it expects gross margin to improve for many quarters, supported by pricing, higher-capacity drives and lower cost per TB.

Economics & FinanceTech

Western Digital delivered a Q4 FY2026 beat, with the clearest upside in profitability rather than revenue. Revenue rose 44% yoy to $3.747bn, near the top of management's $3.55bn-$3.75bn range and modestly above market expectations, while non-GAAP EPS of $3.56 exceeded the company's $3.10-$3.40 outlook. The main incremental signal was non-GAAP gross margin of 54.4%, 240 bps above the prior guidance ceiling, followed by a 55%-56% Q1 guide. Management also said it expects gross margin to improve for many quarters, supported by pricing, higher-capacity drives and lower cost per TB.

Will cloud remain at least 90% of Western Digital’s revenue in Q1 FY2027?

Yes
59.69%
No
40.31%
129 Polls

TL; DR: Key Takeaways

The beat was high quality, but it was primarily a margin beat rather than a major demand surprise. Revenue of $3.747bn finished near the top of management's range, while non-GAAP gross margin exceeded the prior ceiling by 240 bps and EPS cleared the high end by $0.16. This mix matters because the result supports higher earnings estimates without requiring a materially stronger near-term volume assumption.

Q1 guidance shifts the earnings debate from revenue growth to conversion. The $4.1bn revenue midpoint implies ~9% qoq growth, but the 55%-56% non-GAAP gross-margin range suggests incremental revenue is still converting at a high rate. The more meaningful forward revision should therefore come from margin and EPS, not from a large change in the revenue trajectory.

Nearline HDD pricing adjusts more slowly, making margins more predictable. Western Digital does not reset prices across its customer base every quarter. LTAs start and expire at different times, new platforms can trigger renegotiation, and capacity above committed volumes may carry higher prices. Pricing therefore moves more slowly than in spot memory markets, but the staggered structure also reduces the risk of an abrupt portfolio-wide reset.

The next phase of margin expansion depends increasingly on execution, not pricing alone. Seagate's Mozaic 4 and Western Digital's 40TB ePMR and 44TB HAMR must convert higher areal density into acceptable yields, customer qualification and volume shipments. If cost per TB falls near the long-term target of ~10% annually, gross margin could expand even as price increases moderate; if qualification or yields disappoint, LTAs may secure demand without securing profitability.

The AI demand case is gaining commercial support, but remains concentrated. Cloud generated 89% of Q4 revenue and grew 43% yoy, consistent with strong hyperscaler demand. Yet client and consumer together represented only 11% of sales, so the evidence currently supports deepening AI-related demand more clearly than broad-based diversification.

Key Debates

  • Can gross margin remain above 55% beyond Q1?
  • Can cost per TB keep falling as price increases moderate?
  • How much of AI storage demand is structural rather than deployment-led?
  • Can Western Digital execute the HAMR transition without disrupting margins?

Source:

  1. Company press release; https://www.westerndigital.com/company/newsroom/press-releases/2026/2026-08-05-wd-reports-fiscal-fourth-quarter-and-fiscal-year-2026-financial-results