

Bitcoin has been going through some troubles in the past few days. First, its value sank nearly 5% in just one week. Next, Truth Social revealed it has abandoned its Bitcoin ETF plans. This could have been because of the competitive ETF landscape according to one ETF analyst. Despite all this, the technical analysis for BTC is still positive.
Truth Social Withdraws Proposed Bitcoin ETF Filings
According to a recent statement, Truth Social's proposed Bitcoin ETF filings which were done in June 2025 to the U.S. SEC were officially abandoned. The proposed funds' sponsor and investment adviser Yorkville America claims that this decision is strategic and does not mean it will be the end of the company's crypto offerings.
One reason for this decision could be the fact that the Bitcoin ETF landscape has become more competitive. Most investor inflows are now going to top companies with strong reputations. Plus, asset managers have started lowering their fees as they go after institutional capital.
In fact, Bloomberg ETF analyst James Seyffart claims that this intensifying competition is likely connected to why Truth Social backed out of its ETF launch. He specifically pointed to Morgan Stanley’s MSBT which only has 14 basis points (a 0.14% management fee).
The BTC Price Pulls Back
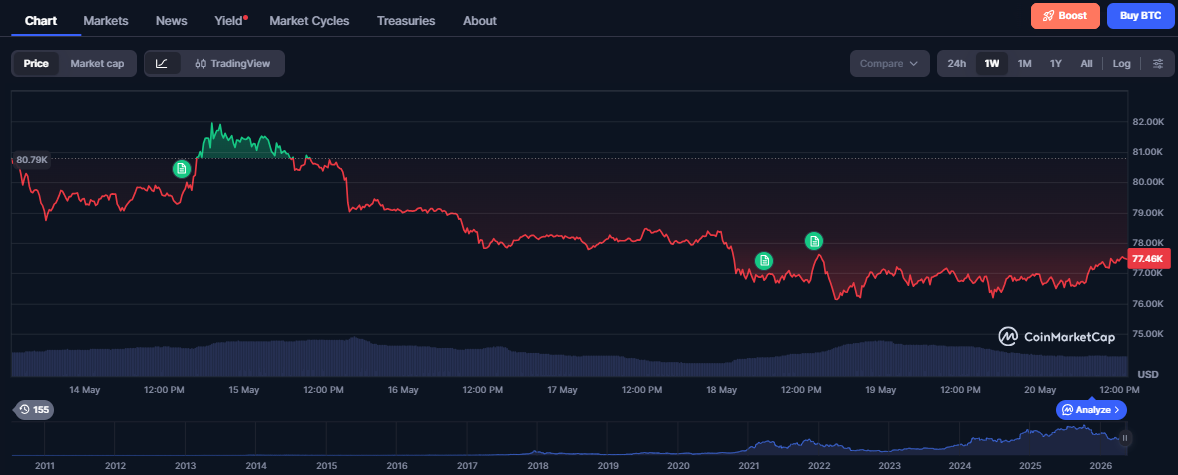
At the same time, the Bitcoin price action has been a little weak on the weekly price charts. CoinMarketCap shows that the price of BTC fell from around $81,120 to nearly $77,400 in the past seven days. This can be seen as a correction since the value of BTC increased from $74,740 on the monthly chart.
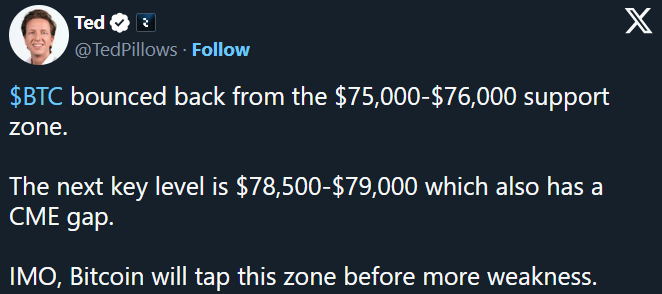
However, there is still bullish market sentiment for BTC in the crypto community. For instance, one prominent trader Ted said that the price of BTC could go on a gap-fill rally to $78,500-$79,000. To clarify, the CME Bitcoin futures market shuts down during the weekends. Because of this, a gap fill tends to happen after that. Therefore, some traders expect the Bitcoin price to go up soon.
But, these are just guesses. What matters is the facts. Currently, the immediate resistance for BTC sits at $78,258 - $81,500. Traders see this range as a key short-term test around the 200-day EMA. If this level gets broken, the BTC price could go to its 13-week high of $82,814. On the other hand, its immediate support levels sit at $76,220. The price could dip as low as $75,500 if this support level fails.
Technical Analysis Shows a Mixed Bitcoin Picture
The technical analysis shows some bullish and negative signs for Bitcoin right now. For instance, TradingView data shows that the 14-day RSI indicator now has a value of 51 which is a positive sign. This suggests that the BTC price is moving with slight upward momentum. It is sitting comfortably in the middle, not overbought or oversold.
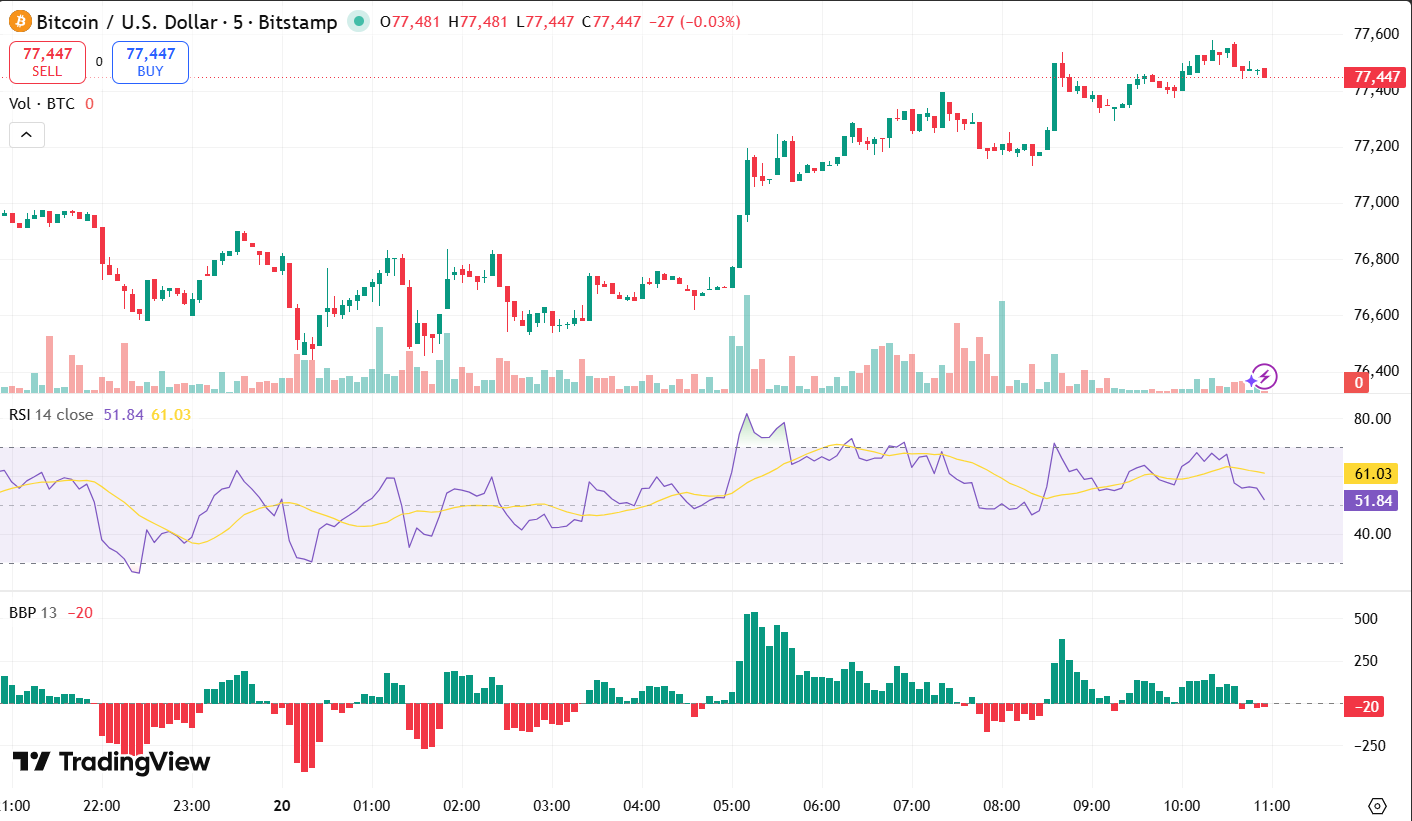
Meanwhile, the 13-day bull/bear power indicator is more bearish. Notably, the last two bars are red and below the zero line at -20. This shows that the sellers are gaining more control since the indicator compares a price to a 13-day moving average. Bars below the zero line show that the BTC price is trading under that average. In other words, a bearish sign.
What Could Come Next for Bitcoin?
Currently, there is some negativity surrounding the short-term impact of the Bitcoin ETF withdrawal by Truth Social. The biggest question right now is if Bitcoin's most important support levels can hold as its ETF space goes through changes.
If bulls manage to take control of BTC again and flip the resistance level of $81,500 soon, a jump to its 13-week peak of $82,814 may follow. However, the key is holding above the $76,220 support level. Looking at the bigger picture, what is your opinion? Is this price dip a buying opportunity or the start of a larger correction for BTC? Feel free to vote on this poll and also explain why you came to that conclusion in the comments.