SK Group Chairman Chey Tae-won purchased 4.8 billion won ($3.4 million) in SK hynix shares, signaling confidence after the chipmaker's steep stock decline, multiple news reports on July 30, 2026.
A corporate regulatory filing on Thursday showed that Chey acquired 3,620 common shares through open-market transactions. At Thursday's closing price, the purchase was valued at about 4.8 billion won.
The move seemingly reflected his confidence in the chipmaker amid a steep sell-off in semiconductor stocks.
SK hynix shares have fallen sharply since reaching an all-time intraday high of 2.98 million won on June 25. They closed at 1.33 million won on Thursday after the stock lost more than half its value in just over a month.
The sell-off has added to concerns about the semiconductor industry's outlook and investor sentiment.
Chey previously brushed off the recent decline in SK hynix shares.
"Demand for memory chips will continue,” Chey said. “Thus, the long-term trend is upward. Instead of buying and selling, simply holding the shares is a better way to preserve your wealth."
On June 12, 2026, the U.S. Department of Justice approved Paramount Skydance's acquisition of Warner Bros. Discovery, closing out an eight-month antitrust review with a finding that the deal did not pose a threat to competition. At roughly $111 billion including debt, with an equity value near $81 billion, it stands as the largest merger in streaming history, surpassing Disney's acquisition of 21st Century Fox, which closed at approximately $71.3 billion.
DOJ clearance, however, has turned out to be far from the finish line. The transaction is now caught between three separate and simultaneous legal fronts: an antitrust lawsuit brought by a coalition of state attorneys general and the Writers Guild of America in the United States, a formal competition review by the UK's Competition and Markets Authority, and a possible separate intervention by the UK's culture secretary on media plurality grounds. The question this deal now raises isn't whether it will close on the original schedule — that possibility has already been foreclosed by a legal settlement — but whether these three fights will ultimately derail it altogether, or simply make it slower and more expensive to complete.
How the Deal Came Together
The path to Paramount's ownership of Warner Bros. Discovery ran through an unusually public bidding war. In December 2025, Netflix reached an agreement to acquire WBD's studio and streaming operations — excluding its linear cable networks — for a price reported between roughly $72 billion and $83 billion. Paramount Skydance responded with a hostile takeover bid for the entire company, cable networks included, going directly to shareholders after WBD's board had already recommended the Netflix deal. In January 2026, Paramount raised its offer to $31 per share and added a "ticking fee" provision, under which it would owe WBD shareholders additional payments for every quarter the deal remained unclosed past September 30, 2026. On February 26, 2026, WBD's board determined that Paramount's revised bid constituted a "superior proposal," and Netflix declined to raise its own offer, formally withdrawing from the contest. As part of its winning terms, Paramount agreed to cover the $2.8 billion termination fee WBD owed Netflix to exit that earlier agreement, and separately committed to a $7 billion regulatory termination fee, payable if the deal ultimately fails to close for regulatory reasons. WBD shareholders approved the transaction with Paramount in the following months.
The practical implications of the deal, if it closes, are substantial. Paramount CEO David Ellison would run both Paramount and Warner Bros. simultaneously — two of Hollywood's legacy studios under one roof. Paramount+ and HBO Max would merge into a single streaming service, meaning subscribers could eventually find Game of Thrones and Paramount's classic film library on the same platform. On the content side, it would effectively create a two-studio rivalry structure in the superhero genre, with Disney and Marvel on one side and a combined Paramount/Warner — home to DC — on the other. And with CNN and CBS News under common ownership, questions about news independence have become a recurring point of public and regulatory concern.
The U.S. Front: State Attorneys General and the Writers Guild
On July 13, 2026, a coalition of twelve state attorneys general, led by California's Rob Bonta, filed suit to block the merger. The Writers Guild of America filed a separate but related lawsuit around the same period, raising similar antitrust concerns. Both complaints allege that the merger would combine two of the five major cable network operators and two of the five major theatrical film distributors, substantially reducing competition in basic cable, wide theatrical release, and tentpole film distribution.
On July 20, U.S. District Judge Araceli Martínez-Olguín granted the states a temporary restraining order, halting any steps toward closing or integrating the two companies. That order was later extended through August 17. Then, on July 24, in what both sides have characterized as a significant procedural turn, Paramount reached a settlement with the state coalition and the WGA: the companies agreed not to close the transaction until five days after a court ruling on the merits of the case, or June 1, 2027, whichever comes first. As part of that agreement, a hearing originally scheduled for August 3 on whether to impose a longer preliminary injunction was canceled, and the parties were instructed to submit a proposed trial schedule by July 31. No trial date has yet been set. If the court ultimately rules in favor of the states, the merger would be blocked, with Paramount retaining the right to appeal.
The UK Front: A Competition Review and a Possible Ministerial Intervention
Running in parallel is a review by Britain's Competition and Markets Authority, the UK's counterpart to the DOJ's antitrust division, tasked with assessing whether the merger would harm competition specifically within the UK market — relevant here because both companies' content, including HBO's library and CNN's news operations, reaches substantial UK audiences.
The CMA opened its Phase 1 investigation on June 9, with a statutory deadline of August 7 to determine whether the deal presents a "realistic prospect of a substantial lessening of competition." If it finds such a risk, the companies would have five working days to propose remedies, which the CMA would then have up to five additional working days to evaluate. Should no acceptable remedy emerge, the case would move to a Phase 2 investigation — a deeper review that can take as long as 24 weeks, or roughly six months.
Layered on top of that process is a separate and, as of now, entirely open-ended variable: on June 30, 2026, UK Culture Secretary Lisa Nandy indicated she was "minded to" issue a public interest intervention notice on the grounds of media plurality. If formally issued, this would trigger parallel reviews by both the broadcasting regulator Ofcom and the CMA, independent of the standard competition review already underway. As of the most recent reporting, the UK Parliament has gone into summer recess without Nandy having made a final decision, leaving this particular front suspended in uncertainty for at least a month, with no clear timeline for resolution. It's also worth noting that the UK's merger control regime is non-suspensory — meaning Paramount could, in theory, proceed with other aspects of the deal without waiting for UK clearance — though the company has publicly stated its intention to respect the UK process regardless.
Why This Matters Beyond the Boardroom
The stakes here extend well past corporate structuring. If completed, the merger of Paramount+ and HBO Max would directly challenge Netflix's position as the world's largest streaming service by subscriber count. On the creative side, it would formalize a genuine two-studio rivalry in franchise filmmaking, pitting Disney and Marvel against a combined Paramount and Warner Bros., home to the DC universe. For creators and labor, the merger raises real questions about consolidation-driven layoffs and project cancellations — precisely the concern that led the Writers Guild to file suit in its own right, rather than leaving the fight solely to state regulators. And the prospect of CNN and CBS News operating under the same ownership umbrella has become a recurring point of concern for regulators and the public alike, a worry echoed directly in the UK culture secretary's stated rationale around media plurality.
How the Three Timelines Interact
No trial date has been set for the U.S. antitrust case, meaning the litigation could, in theory, run all the way to the agreed outer limit of June 1, 2027. The UK's CMA could issue its Phase 1 finding as soon as August 7, but if the case is referred to a Phase 2 investigation, that alone could stretch the process into early 2027. The Culture Secretary's potential intervention has no defined timeline at all, making it the most opaque variable in the entire picture. Critically, these three fronts are not sequential fallback options — they're parallel risks, and any one of them resolving unfavorably, whether a U.S. court ruling for the states or a CMA decision to block the deal, could be sufficient to derail the transaction entirely. Clearing two of the three fronts successfully would not, on its own, guarantee the deal survives.
Will Paramount's acquisition of Warner Bros. Discovery officially close before the U.S. antitrust settlement's outer deadline of June 1, 2027?
LVMH reported H1 2026 on July 27 — a "solid but uneven" print by the company's own framing, with a genuine inflection in Fashion & Leather Goods undercut by a miss against consensus and an unusually harsh stock reaction for a division showing sequential improvement.
Will LVMH luxury product sells recovery in Asia, in 3Q2026?
YesResult
62.63%
NoResult
37.37%
281 Polls
EndedTBD
TL;DR:
What's Good:
Fashion & Leather Goods returned to growth for the first time in seven quarters — a real inflection, not just noise. The fashion and leather goods division, a key profit driver, achieved its first positive growth in seven quarters (+1% Q2), largely attributed to Jonathan Anderson's impact at Dior and new Louis Vuitton boutiques.
Growth accelerated sequentially, and would have been even stronger without the Middle East drag. Growth accelerated to 3% organically in the second quarter, or 4% excluding the impact of the conflict in the Middle East.
Watches & Jewelry was a genuine standout across the whole half. Watches and jewelry also shined with 11% Q2 growth, boosted by Tiffany, Bvlgari, and TAG Heuer, capping 9% organic growth for the full half.
Wines & Spirits delivered both revenue and profit growth, a break from recent history of decline in this division. The Wines & Spirits division saw a 5% organic growth, supported by volume growth and improving demand, particularly in Europe and Japan, with recurring operating profit climbing 11% to €582 million.
US demand strength broadened — both locals and tourists, not just one or the other. Cécile Cabanis reported strong momentum in the U.S. market, with both local demand and tourism accelerating in Q2 — a reversal from Q1, where tourism was impacted by exchange rates.
What's Missed:
Fashion & Leather Goods still missed the specific number analysts had modeled, even while improving. Fashion and leather-goods growth missed the consensus estimate by 0.7 percentage point, an important difference because the division remains central to LVMH's earnings profile and investor expectations — a case where "better" wasn't "good enough."
Perfumes & Cosmetics posted no growth at all. Revenue remained stable on an organic basis in the first half of 2026 — flat is flat, even if management frames it as a deliberate trade-off for brand equity over volume.
Europe was still in outright decline. A significant slowdown in Europe (-1% H1) stood out as the one major mature region not showing improvement.
Key Debates:
Is the Fashion & Leather Goods rebound a durable inflection or a low-bar bounce tied to one creative refresh?
Is the improving Asia trend a real Chinese demand recovery, or a fragile bounce?
How much of the growth shortfall is genuinely attributable to the Middle East conflict, versus using it as a convenient explanatory factor?
Currency: headwind now, tailwind later — or an accounting distraction from the real demand story?Does the stock's depressed valuation and six-year-low framing reflect a rational re-rating of slower luxury growth, or an overreaction to one division's 0.7-point miss?
Does insider buying from the Arnault family holding companies mean anything predictive, or is it a coincidental/lagging signal?
Is Perfumes & Cosmetics' flat growth a sustainable strategic choice or slow share loss dressed up as discipline?
P&G's fiscal Q4 2026, reported July 29, broke from the beat-heavy run of prints this earnings season: core EPS edged past estimates on productivity savings, but revenue and organic sales fell short as value-conscious consumers kept trading down, margins compressed for the full year, and next year's guidance came in below Street expectations — all against the backdrop of a CEO now also stepping into the Chairman role as the prior chief executive exits after nearly four decades at the company.
Wil P&G raises FY2027 guidance in upcoming quarters?
YesResult
0.00%
NoResult
100.00%
2 Polls
EndedTBD
TL;DR:
Revenue missed consensus, and organic sales growth was effectively zero. Analysts surveyed by LSEG had expected revenue of $21.38 billion... organic sales were unchanged for the quarter, with volume having no net impact.
GAAP earnings fell sharply, a much larger decline than the core EPS number suggests. Net income attributable to the company came in at $3.04 billion, or $1.26 per diluted share, down from $3.62 billion, or $1.48 per diluted share, a year earlier — a 15% EPS decline on a GAAP basis, considerably worse than the -3% core EPS move.
Volume growth has been essentially absent all year. During P&G's full fiscal 2026, the company has reported volume growth in just one quarter — a structural demand signal, not a one-quarter blip.
Consumers are visibly trading down, and management said so directly. Shoppers have become increasingly price-sensitive, turning to store-brand alternatives or making everyday products like shampoo and laundry detergent last longer.
Margins compressed for the full year despite the productivity program. Gross margin for the year fell 100 bps to 50.2% and operating margin fell 160 bps to 22.7%, and the company cited higher SG&A as a percentage of sales and a lower gross margin, which more than offset sales growth in the quarter specifically.
FY2027 guidance itself came in below Street expectations, not just this quarter's results. P&G cut its growth outlook for fiscal 2027. The company expects total net sales to grow 1% to 3% — below the analyst consensus estimate of 2.7% growth — and core earnings per share between $6.89 and $7.11, with a midpoint slightly below the consensus estimate of $7.04.
New cost headwinds are already baked into next year's guide. The company estimates a headwind of approximately $1 billion after-tax driven by higher raw materials, energy and transportation costs, and other charges, equating to a headwind of $0.56 per share.
Key Debates:
Is this a genuine consumer trade-down problem, or a temporary trade/input-cost timing issue?
Can the "superiority" premium-pricing strategy survive a value-conscious consumer environment?
Is the new CEO/Chairman consolidation a governance concern or a natural continuity move?
Is FY2027 guidance conservative sandbagging, or a realistic read of a genuinely tougher environment?
Tariff exposure remains a moving, unresolved target.
Is margin compression here to stay, or does the productivity program eventually catch up?
Capital return sustainability at a lower earnings-growth rate.
As the dust settles on this week’s major Big Tech earnings releases, the financial media remains predictably fixated on top-line revenue beats and cloud growth percentages. However, for institutional investors and universal asset owners, the most critical data points are no longer found in the revenue headlines, but buried deep within the cash flow statements. Silicon Valley is definitively exiting the high-margin, zero-marginal-cost era of traditional software. Driven by the relentless computational demands of artificial intelligence, Big Tech has rapidly mutated into a capital-intensive heavy industry.
The sheer scale of this transition is historically unprecedented. Over the past 36 months, the global financial system has funneled an estimated $1 trillion into physical AI infrastructure. Yet, as leadership at Norges Bank Investment Management (NBIM) recently highlighted, a profound structural asymmetry persists: while an estimated $1.4 trillion is required for global hardware buildouts, direct and verifiable AI revenues struggle to cross a mere $13 billion threshold. With macroeconomic projections from Morgan Stanley anticipating the combined capital expenditures (CapEx) for the five largest US tech giants to hit $1.16 trillion by 2027, the thematic hype cycle is officially over.
We have entered the era of the "CapEx Wall," where the fundamental measure of corporate survival is no longer algorithmic promise, but strict balance sheet resilience and the ability to defend Free Cash Flow.
The Microsoft & Alphabet Proxies: Quantifying the Capital Burden
The sheer magnitude of this infrastructure burden is already visible in the latest SEC filings. Alphabet’s trajectory—with its CapEx surging 74% (from $52.5 billion to $91.4 billion between 2024 and 2025)—was an early warning. Microsoft’s recent Q4 2026 results confirm this permanent escalation in capital intensity, with quarterly capital expenditures reaching an unprecedented $35.80 billion.
AI, a Capital-Intensive Industry Hit by the Inference Tax
The historical paradigm of the tech industry—distributing software at zero marginal cost—is obsolete. Generative AI now resembles a heavy industry, structurally penalized by an “inference tax.” While Microsoft CFO Amy Hood highlighted “a strong quarter to close out the fiscal year, underscored by $59.3 billion in Microsoft Cloud revenue,” the reality of the balance sheet shows profitability under pressure. The Intelligent Cloud division’s operating margin peaked at 40.6% (Q4), and the company’s regulatory filings confirm a squeeze on gross margin directly attributable to AI infrastructure costs.
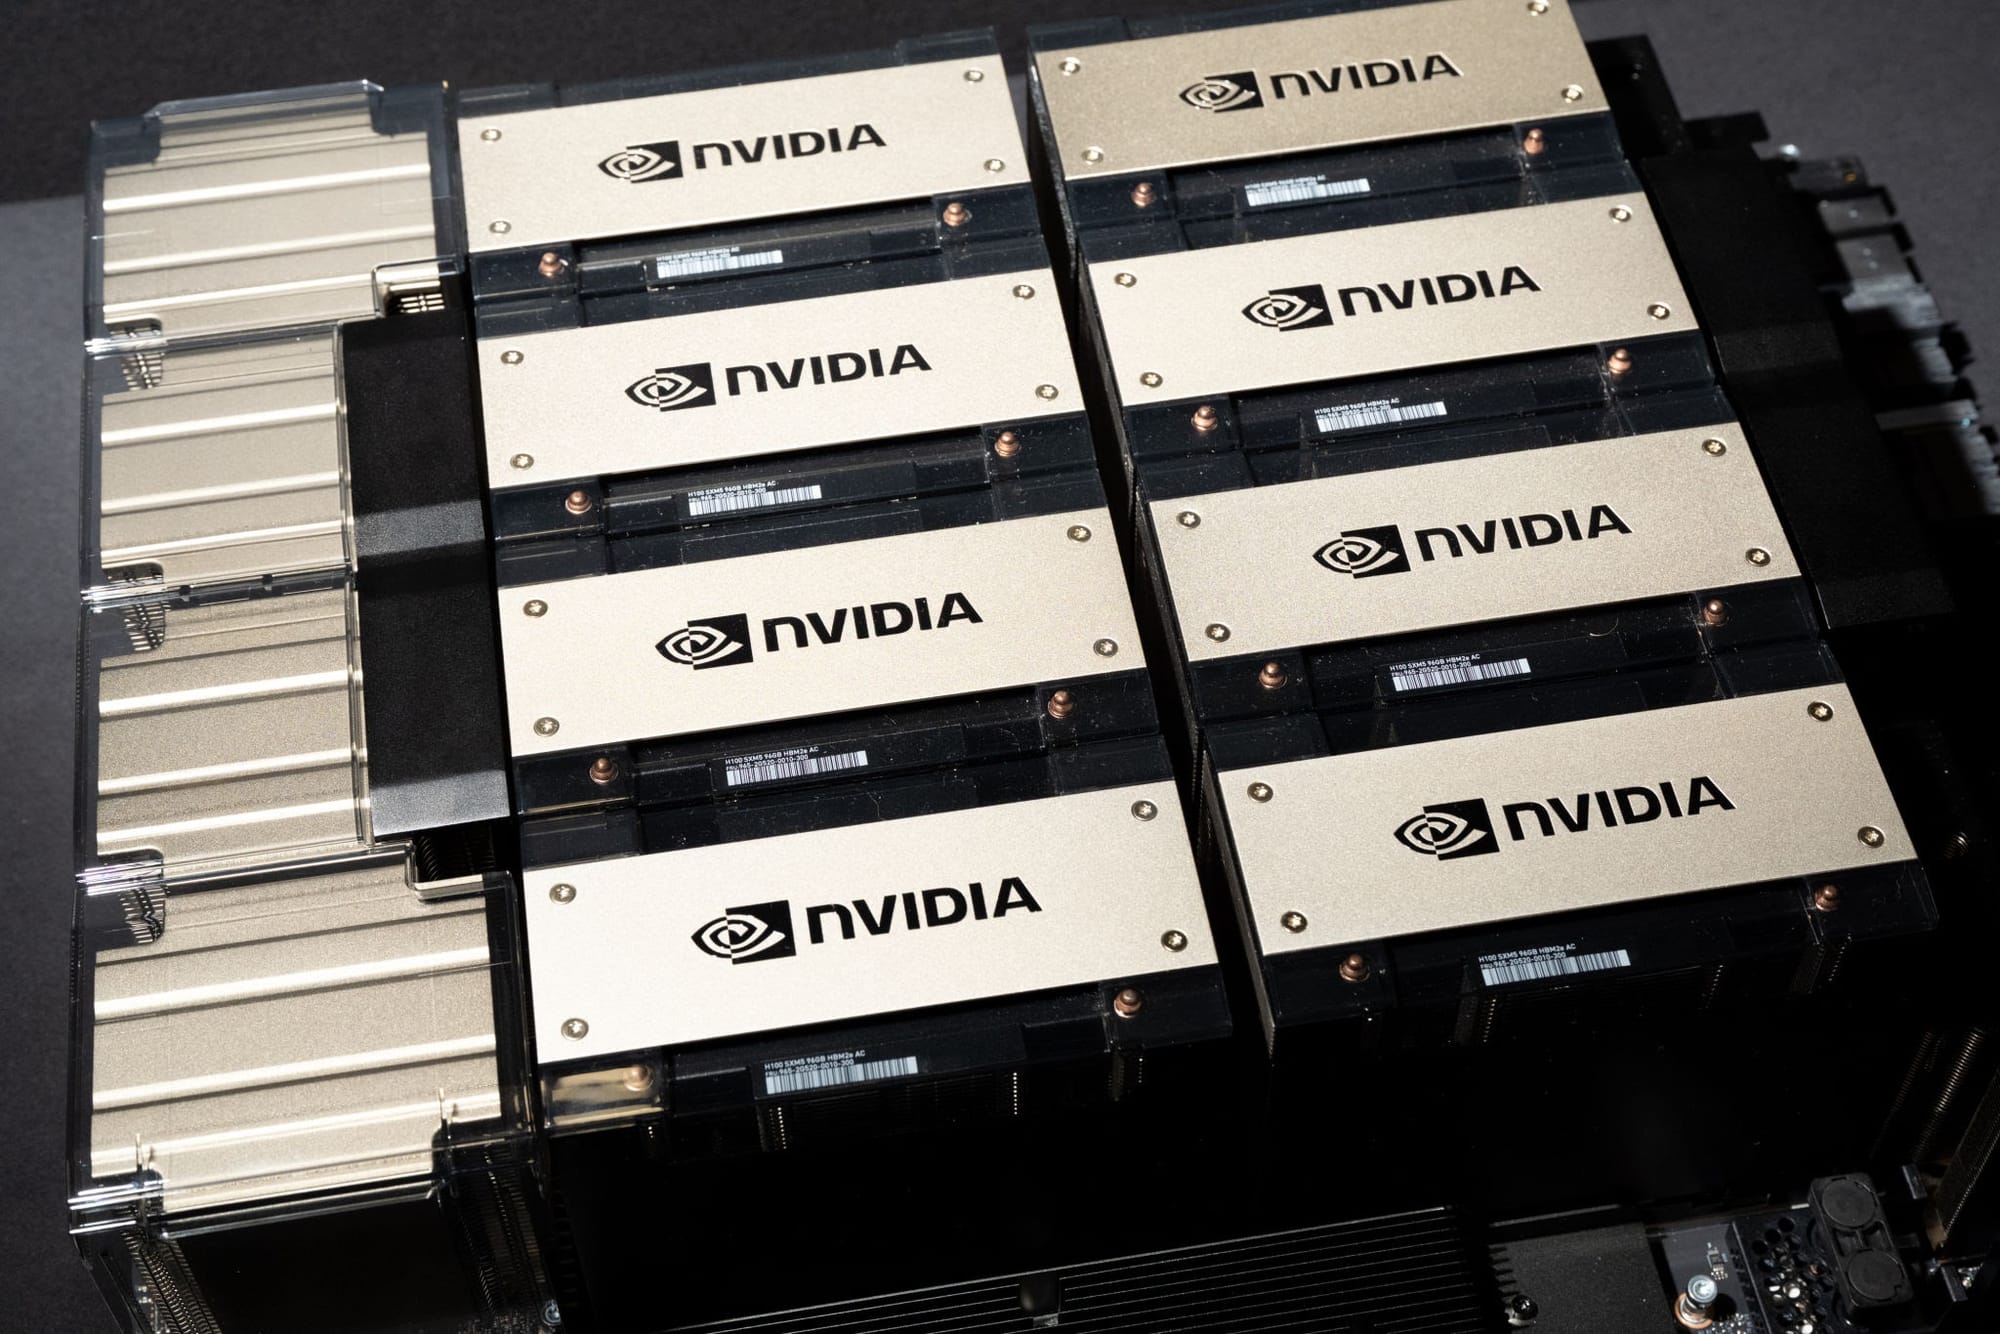
This massive cash burn is exacerbated by a trap of accelerated depreciation. State-of-the-art GPUs (Nvidia H100 or Blackwell architectures) become obsolete within 3 to 4 years. This ultra-short life cycle forces perpetual reinvestment in hardware, which mechanically crushes free cash flow generation, transforming a competitive advantage into a permanent exercise in capital destruction.
The FinOps Pivot and Margin Cannibalization
To finance this unyielding infrastructure burden without defaulting on profitability, tech companies are aggressively cannibalizing their internal operating models. Historical Sales & Marketing (S&M) budgets are being drastically cut from 47% to 41% of revenue (KeyBanc), freeing up capital to prioritize R&D, which now exceeds 22% of revenue. This reallocation automatically extends the CAC payback period to 18 months, while 55% of IT decision-makers admit that their current infrastructure cannot support AI without significantly eroding their margins (Forrester).
Meta Platforms illustrates this dynamic with unprecedented accounting severity. Lacking a B2B cloud division to offset the hardware burden, the company relies exclusively on advertising, leaving it fully exposed to infrastructure risk. The second-quarter 2026 results confirm this “CapEx Wall”: capital expenditures (CapEx) reached $31.08 billion, forcing management to tighten its colossal annual guidance range to between $130 billion and $145 billion. This need to absorb the surge in computing costs led to a 55% year-over-year spike in operating expenses (OpEx), sharply reducing the operating margin from 43% to 31%. The sacrifice of short-term profitability is reflected in a crushing decline in free cash flow, which has been squeezed down to just $784 million. Although Mark Zuckerberg maintains that AI “is accelerating our core business today,” the financial statements reveal a more stark reality: the race toward hyper-infrastructure requires the temporary depletion of available cash.
As the "CapEx Wall" forces a FinOps pivot, what is the most severe P&L risk for enterprise software over the next 18 months?
Aggressive OpEx cannibalization (slashing S&M and headcount to fund compute)Result
10.58%
Further upward revisions of annual CapEx guidance despite market backlashResult
40.13%
Passing the "inference tax" directly to enterprise customers via price hikesResult
19.03%
Scaling back non-core R&D to protect short-term Free Cash FlowResult
30.26%
2,118 Polls
EndedTBD
Macro-Financial Displacement and the Stock Market Divide
The price action observed during after-hours trading on July 29, 2026, confirms a clinical reassessment of the risk associated with artificial intelligence infrastructure. The markets are no longer penalizing revenue stagnation, but rather the destruction of free cash flow (FCF) attributable to the “CapEx Wall.” The -6.41% correction inflicted on Meta Platforms—which fell to $548.09 despite solid revenue—illustrates this perfectly: investors are penalizing the accumulation of capital expenditures that lack immediate profitability.
Conversely, the 8.97% jump in Microsoft’s stock (to $425.56) demonstrates a strict market requirement: depreciation costs must be offset by tangible monetization. Microsoft was rewarded for proving its Operating Alpha—the ability to generate cash despite the hardware drag. As highlighted by the financial press’s narrative illustrating this “great AI divide,” balance sheet resilience now takes precedence over the promise of expansion.
Beyond equity markets, this asymmetry is triggering a severe macro-financial “crowding-out” phenomenon in global credit. According to BIS data, nearly 60% of global FX derivatives are now concentrated among the ten largest banks to finance Big Tech’s data centers, automatically drying up credit conditions for traditional SMEs.
Conclusion: The Valuation Doghouse and the New Institutional Mandate
The cycle of abundant liquidity fueling innovation has come to an end. The markets are conducting a ruthless binary culling: 73% of publicly traded traditional SaaS companies are now relegated to a "Valuation Doghouse," trading at a median multiple of just 3.3x their future revenue (Meritech). Only the elite—those demonstrating true Operating Alpha by mastering the “Rule of 40”—are capturing liquidity.
Ultimately, this week’s Big Tech earnings confirm a definitive regime change: AI is no longer a speculative vector for exponential hyper-growth, but a highly capital-intensive, defensive infrastructure. For institutional allocators, the mandate is clear. Capital allocation must be rigidly anchored to organizations capable of navigating the CapEx wall, enforcing FinOps discipline, and protecting Free Cash Flow generation against the crushing weight of accelerated hardware depreciation.
As the market enforces a ruthless binary culling across the tech sector, what is the ultimate survival criterion for institutional portfolios?
Uncompromised Free Cash Flow (FCF) resilience against the hardware dragResult
37.22%
Accelerated B2B AI monetization to outrun capital intensityResult
Bloom Energy Shares Soar on Back of AI Power Demand post 2Q2026 results. "Without power, chips are just inventories". Could this company be the power-layer behind AI infrastructure?
Bloom Energy reported Q2 2026 on July 28 — and this is by far the most dramatic print of the group: a record-shattering beat that landed in the middle of an active short-seller fight, making the stock reaction genuinely hard to read cleanly.
Where will Bloom Energy FY26 revenue land (based on 2Q2026 guidance)?
Below US3.9BResult
1.35%
US3.9-4.2BResult
34.44%
Above US4.2BResult
64.21%
2,073 Polls
EndedTBD
TL;DR:
Revenue and EPS both beat by very wide margins. Non-GAAP EPS of $0.78 beat the $0.42 estimate by $0.36 (a beat of ~86-95% depending on which consensus figure is used), and revenue of $1.065 billion beat estimates by roughly $214 million — exceeding Wall Street expectations, with non-GAAP earnings beating consensus by 95%, and revenue surpassing forecasts by nearly 30%.
First-ever $1 billion quarter, a real milestone, not just a beat. Bloom Energy said Q2 2026 marked a turning point in its business, achieving its first $1 billion quarter, demonstrating significant revenue growth and acceleration in business operations.
This extends an unusually long beat streak. Bloom Energy has beaten estimates in four straight quarters, most recently posting Q1 2026 non-GAAP EPS of $0.44 against a consensus near $0.13 — this is now a fifth consecutive significant beat.
Gross margin hit a record, and profitability metrics expanded across the board. The company reported a record gross margin of 34.3%, reflecting improved product and service margins and disciplined execution.
Guidance was raised for a second time this year, not just reaffirmed. Management raised full-year guidance for a second consecutive quarter, and the new $3.9–4.2 billion range sits meaningfully above the $3.4–3.8 billion range set just one quarter ago.
Financing capacity was massively expanded, addressing a key capital-intensity concern. Brookfield's expanded project framework of up to $25 billion — increasing available project financing from US$5.00 billion to US$25.00 billion — directly reinforces Bloom's ability to fund large AI and hyperscale deployments at scale.
Customer base is broadening beyond the two most-scrutinized names. CEO KR Sridhar said Bloom delivered power to Oracle's data center within 55 days of first engagement and now has validation from major U.S. hyperscalers and more than a dozen neo clouds, AI labs and co-location operators.
Management directly addressed the project-delay risk the market has been pricing. CFO Simon Edwards said: "Our contracts have strong protections, and our equipment is flexible for redeployment. Financial partners are obligated to take delivery, mitigating our exposure. Our 2026 revenue guidance is not dependent on any single project, accounting for potential delays."
Key Debates:
Are the Hunterbrook scandium-oxide sourcing allegations a real governance/disclosure problem, or a mischaracterization the company can rebut?
Is customer concentration with Brookfield and Oracle a red flag or simply a reflection of early-stage scale?
Does the record quarter validate the AI power narrative, or does it magnify the risk if hyperscaler capex ever slows?
Against geopolitical uncertainties and the nominal supply-demand imbalance, CMA CGM's 2Q2026 turned out to be better than feared, with both revenue and volume rising. Could this be the beginning of another big quarter for container liners?
Will CMA CGM reports volume growth (Y/Y) again in 3Q2026?
YesResult
51.76%
NoResult
48.24%
1,851 Polls
EndedTBD
According to CMA CGM's summary:
Strong results driven by the Group’s agility in a volatile environment marked by geopolitical tensions, particularly in the Middle East.
Strong growth in maritime volumes transported (6% year-on-year), supported by sustained freight rates.
Continued growth in logistics activities, with revenue up 8.5% year-on-year.
“Against a backdrop of continued geopolitical instability, the Group delivered solid results in the second quarter of 2026, driven by the performance of our shipping activities, the growth of our terminals and air cargo businesses, and the complementary strengths of our logistics operations. This performance reflects our strategy of expanding in key markets and investing in strategic assets. They once again demonstrate the strength of our model, our agility and our resilience, all in support of delivering reliable, high-quality service to our customers.”
Coca-Cola reports strong 2Q2026 results and raises full-year guidance, thanks to strong demand driven by FIFA World Cup and water breaks.
Will Coca-Cola FY2026 free cash flow be above or below 2Q2026 guidance (US12.4B)?
AboveResult
66.67%
BelowResult
33.33%
3 Polls
EndedTBD
TL;DR:
Revenue and EPS both cleared consensus with room to spare. Adjusted earnings per share of 97 cents beat expected 93 cents, and revenue of $13.38 billion beat the $13.16 billion expected.
Volume growth was broad-based, not concentrated in one region. Global unit case volume increased 5%, and every one of the company's reporting segments saw volume growth — a genuinely diversified beat rather than one hot market carrying the number.
Margin expansion accompanied the volume beat, not just pricing. Adjusted operating margin ticked up from 34.7% to 35.6% even while the company leaned into World Cup marketing investment.
Zero Sugar's acceleration is now a multi-quarter trend, not a one-off. Coca-Cola Zero Sugar volume grew 16% in the quarter across every geographic segment, following 14% full-year growth in 2025 and 13% growth in Q1 2026 — sustained double-digit acceleration, not a tournament bounce, and it seemed to benefit from increased adoption of GLP-1s — a case where the GLP-1 trend may be helping rather than hurting Coke's portfolio.
Key Debates:
Is GLP-1 adoption a tailwind or headwind for Coca-Cola overall? This quarter's data cuts both ways: Zero Sugar's acceleration is described as structural, driven partly by GLP-1 adoption reducing tolerance for high-calorie beverages, which reads bullish for Coke's zero-sugar mix-shift strategy — but a separate risk framing warns faster GLP-1 adoption could reduce consumption in some markets more broadly. The debate is whether Coke's Zero Sugar portfolio fully offsets any GLP-1-driven decline in overall caloric beverage consumption, or merely cushions it.
How much of this quarter's strength is a World Cup-driven bounce versus durable brand momentum? Trademark Coca-Cola volume was the best in 17 years (ex-COVID), directly tied to World Cup activation, and Q2 2025 was itself a soft comp (volume -1%) — bulls will want to see whether North America and global volume hold up in Q3/Q4 once the tournament-driven marketing lift fades and the comp normalizes.
SK hynix reported record-breaking 2Q26 financial results on July 29, 2026, driven by intense AI memory demand and higher chip prices. Yet, stock price took a huge dip...
What will SK Hynix operating profit margin be for 3Q2026 (vs 2Q2026)?
HigherResult
63.86%
LowerResult
36.14%
1,162 Polls
EndedTBD
TL;DR:
What's Good: Absolute profit and revenue growth were extraordinary by any historical standard. Operating profit of ₩60.54 trillion was up more than 550% year over year, and revenue and operating profit increased 257% and 557% year-over-year, respectively.
What's Good: Long-term contract book was locked in with key customers. SK hynix has finalized Long-Term Agreements with around 10 customers, including key strategic partners, aiming to secure mid-to-long-term supply stability, improve operational efficiency, and support sustainable growth.
What's Good: HBM4 hit technical milestones and began shipping. SK hynix began mass shipments of HBM4 in Q2 2026 and plans to ramp production in the second half, and HBM4 achieves customer-required operating speeds, industry-leading power efficiency, and cost competitiveness, demonstrating differentiated technological edge.
What's Good: Structural position within the AI memory shortage remains dominant. Goldman Sachs has estimated a 2026 DRAM supply-demand gap of 4.9%, described as the most severe shortage in 15 years, with DRAM spot prices up approximately 52% since January 2026, and industry analysts estimate SK Hynix holds approximately 60 to 70% of Nvidia's HBM4 allocation for the Vera Rubin AI platform, with Samsung capturing roughly 25-30% and Micron supplying the remainder — an allocation confirmed publicly by Nvidia CEO Jensen Huang during a Seoul visit in June.
What's Missed: Operating profit missed consensus by a meaningful margin, despite the YoY headline.
What's Missed: Multi-year HBM supply contracts are structurally capping upside capture. Korea Investment & Securities projected Q2 operating profit roughly 8% below consensus, revealing how the company's multi-year high-bandwidth memory supply contracts prevent it from capturing the full spot-price upside investors were modeling — the company is essentially leaving spot-market pricing gains on the table in exchange for locked-in volume certainty.
What's Missed: HBM4 ramp timing came in later than some analysts had priced. Investors had anticipated that shipments of SK Hynix's next-generation HBM4 [would scale in Q2], [but] that increase had not materialized at scale. Full-scale HBM4 mass production is now expected to begin in the third quarter of 2026 — a shift that also removed a source of upside analysts had priced into Q2 estimates.
Key Debates:
Is the "miss" actually a demand problem, or purely a contract-structure artifact?
How much of the sell-off is stock-specific versus sector-wide noise?
Does the HBM4 delay to Q3 change the growth trajectory, or just shift timing?
Less than two weeks after the World Cup ended, FIFA announced one of its biggest commercial moves in years.
The organization has launched FIFA Forward Enterprise (FFE), a new company that will manage the commercial rights of its biggest competitions—including the FIFA World Cup and Club World Cup. FIFA also plans to sell up to 21% of FFE to private investors, raising as much as $4.2 billion.
The proceeds will fund an expanded FIFA Fast-Forward Programme (FFFP), significantly increasing financial support for FIFA's 211 member associations.
At first glance, this looks like a straightforward fundraising effort. But it also raises a much bigger question: Should the commercial rights of the World Cup become an investment asset?
Why Now?
FIFA is not short on money.
The organization expects to generate around $15 billion during the 2023–2026 World Cup cycle—nearly double the revenue from the previous cycle, thanks to an expanded World Cup and the revamped Club World Cup.
That makes the timing notable. Rather than filling a funding gap, FFE appears designed to unlock the long-term commercial value of FIFA's biggest tournaments by bringing in outside capital.
A New Funding Model
Under the proposal, member associations will receive substantially higher development funding.
Regular FIFA Forward grants are set to rise from $8 million to $20 million per association in the next World Cup cycle, with additional increases planned in future years. FIFA argues this will accelerate football development worldwide.
Supporters see more investment in grassroots football. Critics argue that larger funding could also strengthen FIFA's influence over member associations, many of which already rely heavily on FIFA support.
The Bigger Debate
The controversy isn't about the money—it's about the asset.
Domestic leagues such as La Liga and Ligue 1 have already partnered with private equity firms. But many argue the World Cup is fundamentally different. It has long been viewed as football's global public competition rather than a commercial property owned by a single organization.
Selling part of the business built around the World Cup raises concerns that commercial priorities could play a greater role in future decisions, from tournament expansion to media rights and governance.
The involvement of JPMorgan Chase as adviser and private investment firm Thrive Eternal as lead investor has only intensified scrutiny over the growing role of financial capital in global football.
What Comes Next?
FFE is not FIFA's first attempt to commercialize its assets. Similar proposals surfaced in 2018 but never materialized.
This time, however, FIFA is returning with stronger financial results, a larger World Cup, and a clearer commercial structure. If the plan moves forward, it could become one of the most significant governance changes in modern football.
Should FIFA sell a stake in the commercial business behind the World Cup?
Yes, it's a smart way to fund football's growth.Result
20.00%
Yes, but only with strict governance safeguards.Result
0.00%
No, the World Cup should remain a public football asset.Result
Barclays shares suffered their steepest decline in more than a year after its second-quarter results showed that growth in investment banking and US consumer banking had failed to match the pace set by larger American rivals.
The stock fell as much as 7.1% in London, its biggest one-day decline since April 2025. The fall came after Barclays shares had risen almost 47% in the year through Monday, leaving investors sensitive to any signs that expectations had moved ahead of performance.
Investment banking fees and underwriting revenue rose 32% year on year to £747 million, beating estimates. However, analysts noted that Barclays still lagged Wall Street banks during a strong period for equity issuance, listings and dealmaking.
Equities trading revenue increased 45% to £1.26 billion and exceeded expectations. Fixed-income trading revenue was broadly unchanged at £1.47 billion and came in below forecasts.
The results contrasted with record stock-trading revenue at Morgan Stanley, JPMorgan, Goldman Sachs, Bank of America and Citigroup, which benefited from market volatility and a rebound in US capital-markets activity.
At the same time, Barclays is moving to compensate senior bankers more like Wall Street firms. The bank recorded £1.3 billion of performance-related pay costs in the first half, almost 30% more than a year earlier, while salaries rose by less than 1%.
Chief Financial Officer Anna Cross said costs would increase by a further £100 million to £150 million in the second half as Barclays changes the pay structure for its most senior bankers, increasing variable compensation while reducing the importance of fixed salaries.
However, the latest results highlight the tension behind the strategy. Barclays is moving closer to Wall Street pay levels, but investors remain uncertain whether the bank can also deliver Wall Street-level revenue growth.
Revenue at Barclays’ US consumer bank rose 38% to £1.1 billion following the acquisition of Best Egg, but was about 5% below estimates. The bank nevertheless raised its full-year income guidance to about £31.5 billion from £31 billion.
Barclays also announced a fresh £1 billion share buyback and maintained its targets for 2026 and 2028, including a return on tangible equity of more than 14% and £15 billion of shareholder distributions between 2026 and 2028. The central question is now whether higher performance-linked pay can help close the gap with US rivals without placing additional pressure on costs.
Will Barclays‘ shift toward Wall Street-style pay narrow its gap with US rivals by the end of 2027?
Thomas Plantenga unabashedly says he’s been “stealing” from companies across the globe. The chief executive officer of Vinted, Europe’s biggest consumer-to-consumer fashion marketplace, says he freely borrowed from their strategies to put together an online platform that’s now shaking up the region’s €500 billion ($573 billion) fashion industry.
Thomas Plantenga Source: Vinted
Founded in 2008 as a platform for individuals to buy and sell secondhand clothes, Vinted has created such a formidable marketplace that the platform, along with some of its rivals, is eating into the sales of fashion and luxury houses. McKinsey’s State of Fashion 2026 report says the secondhand market will grow two to three times faster than the firsthand one from 2025 to 2027 as penny-pinching consumers seek bargains.
“The risk for the overall sector is that secondhand clothing cannibalizes the sale of new fashion,” analysts at RBC Capital Markets wrote in a note this month, also pointing out that many international labels are rushing to blunt the impact with resale offers of their own.
Will the global resale apparel market grow faster than the firsthand apparel market in 2027?
YesResult
38.86%
NoResult
61.14%
422 Polls
EndedTBD
With the taboo around buying and selling secondhand clothes evaporating, celebrities like Paris Hilton, Paul Mescal and Chloë Sevigny openly talk about their sales on such platforms.
As economic necessity and a sustainability-conscious new generation lift the stigma around used clothes, about 60% of global consumers are likely to shop resale this year, McKinsey estimates.
The global resale apparel market is expected to reach $317 billion by 2027, the consulting firm said, a 23% jump from last year. The scale and technology of the marketplaces have brought them to “an inflection point,” letting them turn millions of transactions into profits, the report said.
“The real driver is the consumer,” said Poonam Goyal, a senior retail analyst at Bloomberg Intelligence. After years of inflation, shoppers have become more value-conscious, while younger generations increasingly see buying secondhand as mainstream, she said. “People are proud of buying resale. They want to show off the deal they found. It’s a completely different mindset.”
Vinted has led the pack in Europe by massively investing in logistics, payments and technology to draw in more buyers and sellers to its platform. That’s given it the scale and critical mass to keep it ahead of its rivals.
The company, valued at €8 billion during a secondary share sale this year, counts EQT, BlackRock, Ontario Teachers’ Pension Plan and Schroders Capital among investors, and is gearing up for what could be one of Europe’s largest technology-based initial public offerings in recent years.
The US push pits Vinted against established rivals including the industry’s “original gangster” eBay, which this year bought fashion platform Depop for about $1.2 billion to strengthen its secondhand offering, Facebook Marketplace, Poshmark and ThredUp.
“Whether we will be able to actually compete and win in that market is a very big question,” Plantenga said, declining to share details of its plans there. Vinted is in early-stage testing in the US and is encouraged by initial results, he said. Wells Fargo analysts covering eBay, said in their July note that Vinted’s US daily active users jumped more than six-fold in the second quarter from a year earlier following its January market entry.
The global appetite for resale fashion has spawned a slew of players. They include platforms like Japan’s Mercari; the UK’s Hardly Ever Worn It and Depop; Vestiaire Collective in France; The RealReal in the US, among several others. Many have struggled to translate demand into consistent profitability.
Vestiaire Collective expects to post its first annual profit in 2026, more than 15 years after it was created, while in Asia — one of the fastest-growing regions — platforms like Alibaba-backed Idle Fish, Poizon, Mercari and Kream are scaling rapidly.
Can Vinted take meaningful market share from Depop, Poshmark and eBay in the US?
YesResult
20.80%
NoResult
79.20%
226 Polls
EndedTBD
Access to inventory — either through brands looking to offload excess supplies or individuals looking to make a buck from items they no longer wear — is one of the biggest hurdles for the platforms.
After taking over in 2016, Vinted’s Plantenga overhauled the company’s business model, most notably by removing seller fees and charging buyers instead. The changes attracted more inventory, improved marketplace liquidity and laid the foundation for profitability, allowing Vinted to invest heavily in its infrastructure that investors now view as its key competitive advantage.
Vinted processed €10.8 billion of merchandise in 2025, up 47% from a year earlier, while revenue rose 38% to €1.1 billion. Net profit fell 19% to €62 million as it accelerated investment in Germany and in Vinted Go, its logistics business. That drop didn’t stop investors from valuing the company at €8 billion this year, up from €5 billion in 2024.
Through Vinted Go, the company operates thousands of drop-off points in Europe. Photographer: Loic Venance/AFP/Getty Images
Sweden’s EQT, which first invested in Vinted in 2021 and remains one of its largest shareholders, argues the company’s competitive advantage now extends well beyond secondhand fashion. Brochado says the company increasingly resembles scaled marketplace companies like Airbnb, Uber and MercadoLibre because of its network effects, technology infrastructure and expanding ecosystem.
The company has continued expanding across Europe and entered new product categories, including electronics, books and toys. Through Vinted Go, it operates more than 18,000 pickup and drop-off points across Europe, including lockers and designated shops, while Vinted Pay extends its reach into the payments ecosystem.
Vinted’s model is simple: Selling on the platform is free for the seller, who gets to keep 100% of the listed price. Sellers simply take photos of the items they want to sell, add a description, set the price and publish the listing on the app. When someone purchases an item, Vinted charges the buyer a small fee and provides the seller with a pre-paid shipping label. The seller then packs the item and drops it off at a local shipping point. Once the buyer acknowledges receipt, Vinted releases the money into the seller’s virtual wallet.
It’s that model that the company wants to bring to the US. Whether Vinted’s buyer-fee service can be replicated in the US remains an open question. Bloomberg Intelligence’s Goyal says US buyers would be much more resistant to paying a fee, especially if it’s added in separately instead of being built into the price.
But “if they can make it work in the US, they could end up setting a new standard that competitors might eventually follow, making the whole sector more profitable,” she said.
Plantenga said he’s already seeing signs of the shift. Rivals including Poshmark, Depop and Mercari have all moved toward Vinted’s buyer-fee model in recent years — a sign, he argued, that the European approach is setting the industry standard.

 Company Reports