As of July 15, gold trades near $4,000 an ounce, about 28% below the record above $5,590 it hit in January.
Over the same stretch, the US and Iran have gone from ceasefire to renewed strikes and back, oil has spiked repeatedly, and geopolitical risk hardly went away.
But gold's price action has not moved in lockstep with it. It fell the day Trump called the ceasefire "over" and it jumped 2.25% the morning June's CPI came in soft.
The more defensible hierarchy is that rates, the dollar and geopolitical developments create the catalyst; ETF and futures investors transmit that catalyst into the market.
Two different sources of demand therefore influence gold over different horizons. Structural buyers shape the long-term market, while financial investors dominate short-term price discovery. Which one is actually in control answers all three questions worth asking about gold right now.
Is gold becoming a "strategic asset" rather than a safe haven? Why hasn't it rallied with the fighting? What will move it most over the next year?
Who's setting gold's price right now?
Gold is adding a strategic role to its safe-haven one
In the World Gold Council’s latest survey, 89% of reserve managers expected global official holdings to rise over the following 12 months. A record 45% planned to increase their own institution’s holdings, while 83% expected gold’s share of reserves to be higher in five years.
In fact, gold has already overtaken US Treasuries as the largest single asset in foreign central-bank reserves at the end of 2025, per the European Central Bank.
This does not mean gold is shedding its safe-haven role; its crisis performance is one reason central banks want it as a permanent allocation. In the same survey, 90% cited gold’s performance during crises, alongside its value as a long-term store of wealth and portfolio diversifier.
The two roles are really two sides of the same coin. Gold is becoming strategic because it has proved useful in a crisis.
The vault owns the gold, but traders price it
Central banks have been annual net buyers since 2010, but they buy on a different clock from ETF investors, hedge funds and futures traders.
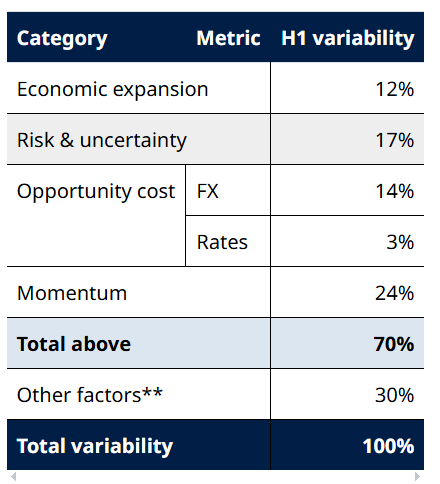
The World Gold Council analyzed what actually moved gold in the first half of 2026: momentum, including investor positioning and trend-following, was the largest named source of price variability at 24%. Risk and uncertainty 17%, foreign exchange 14%, and rates only 3%.
Source: Gold.org
What this means is simple: central banks may own the gold, but traders are pricing it. This is because central banks buy slowly and rarely respond to daily macro surprises.
This does not prove positioning will dominate the next 12 months, but it does show that the identity of long-term holders and the force setting the next price are not the same thing.
So, rates, the dollar, and geopolitical developments may influence why investors act, but ETF and futures positioning decides how strongly that view is expressed in the market. Positioning is therefore likely to produce the largest direct price swings, while rate and dollar expectations determine the direction of those flows.
Continuing wars are not the same as rising risk
Markets trade changes in expectations, not simply the level of danger. Once a war premium is in the price, another day of fighting does not automatically add to it.
In fact, escalation can even work against bullion. On July 15, renewed US threats against Iran pushed oil higher, reviving inflation and rate concerns. Gold fell despite the geopolitical deterioration. During the March selloff, the dollar (not gold) became the preferred haven as the Middle East war increased expectations of tighter policy.
Still, this is not evidence that gold’s haven function has disappeared. It means geopolitical risk reaches gold through competing channels: direct defensive demand on one side, oil, inflation, yields and the dollar on the other.
The next move needs flow confirmation
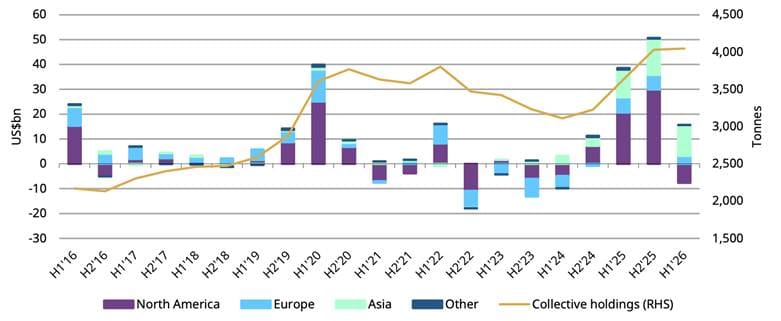
In June, global gold ETFs lost $8.9 billion and 74 tonnes, with every region recording outflows. First-half flows remained positive by $8 billion, but total holdings increased by only 18 tonnes. This means that investors were taking some risk off even while the long-term gold story remained intact.
Source: Gold.org
According to the CFTC, COMEX managed money held 134,941 long contracts and 18,780 shorts on July 7, which is a net long of about 116,000 contracts.
The cleanest bullish signal would be ETF holdings and futures length turning higher together. ETF flows represent sustained investor allocation, whereas futures positioning can reverse quickly and is often more speculative. Futures buying on its own could just be a short-lived squeeze.
Next, rates provide the upstream test. The Council estimates that, all else equal, a 25-basis-point fall in the US 10-year yield could lift gold approximately 1.75%. But you should watch the dollar alongside yields: lower yields accompanied by dollar weakness would be considerably more constructive than a rates move caused by renewed confidence in US policy.
What would put $5,000 back on the map?
Using $4,100 as its reference point, the Council’s model implies a broad consensus range of about $3,900 to $4,300. A bullish scenario points to roughly $4,300 to $4,900, while bearish consolidation could take gold toward $3,500 to $3,900.
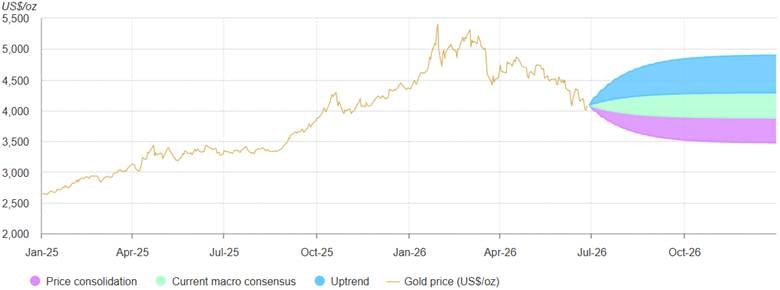
The bullish path likely needs the pieces to line up: falling yields, a weaker dollar and investors putting money back into ETFs and futures. With a dovish Fed turn, a financial shock or faster central-bank buying, the rally would have something solid behind it. Without this follow-through, even a break above $4,500 could turn out to be another short-lived squeeze.
On the downside, if the dollar strengthens and gold funds keep losing money, the structural buyers will have to absorb a lot more selling. A weekly break below $3,860 would be the clearest sign that they are not arriving quickly enough.
But this argument could also be wrong. Gold may keep rising while ETF holdings and futures positions go nowhere. This would suggest the real buying is happening in less visible corners of the market, through central banks, physical markets or private OTC trades. Rising official purchases would make this case much stronger.
The framework, then, is straightforward. Structural demand sets the floor, macroeconomic expectations determine the direction, and investor positioning determines the speed and magnitude of the move.
Where will gold be trading by July 2027?
Sources
BLS: Consumer Price Index – June 2026
CFTC: Disaggregated Commitments of Traders - Futures Only, July 07, 2026
ECB: The international role of the euro, June 2026
GoldSilver: Gold Is Sitting on $4,000. The World Gold Council Has a Model for What Happens Next.
GoldSilver: Gold Jumped $90 This Morning. June CPI Just Explained Why.
GoldSilver: Gold Price Outlook July 2026: The Price Fell. Case Intact.
TradingView: Gold Spot / U.S. Dollar
World Economic Forum: Here's how central banks have used gold in the last 30 years