
At first glance, weekly Elon tweet markets look unserious.
Then you watch them trade.
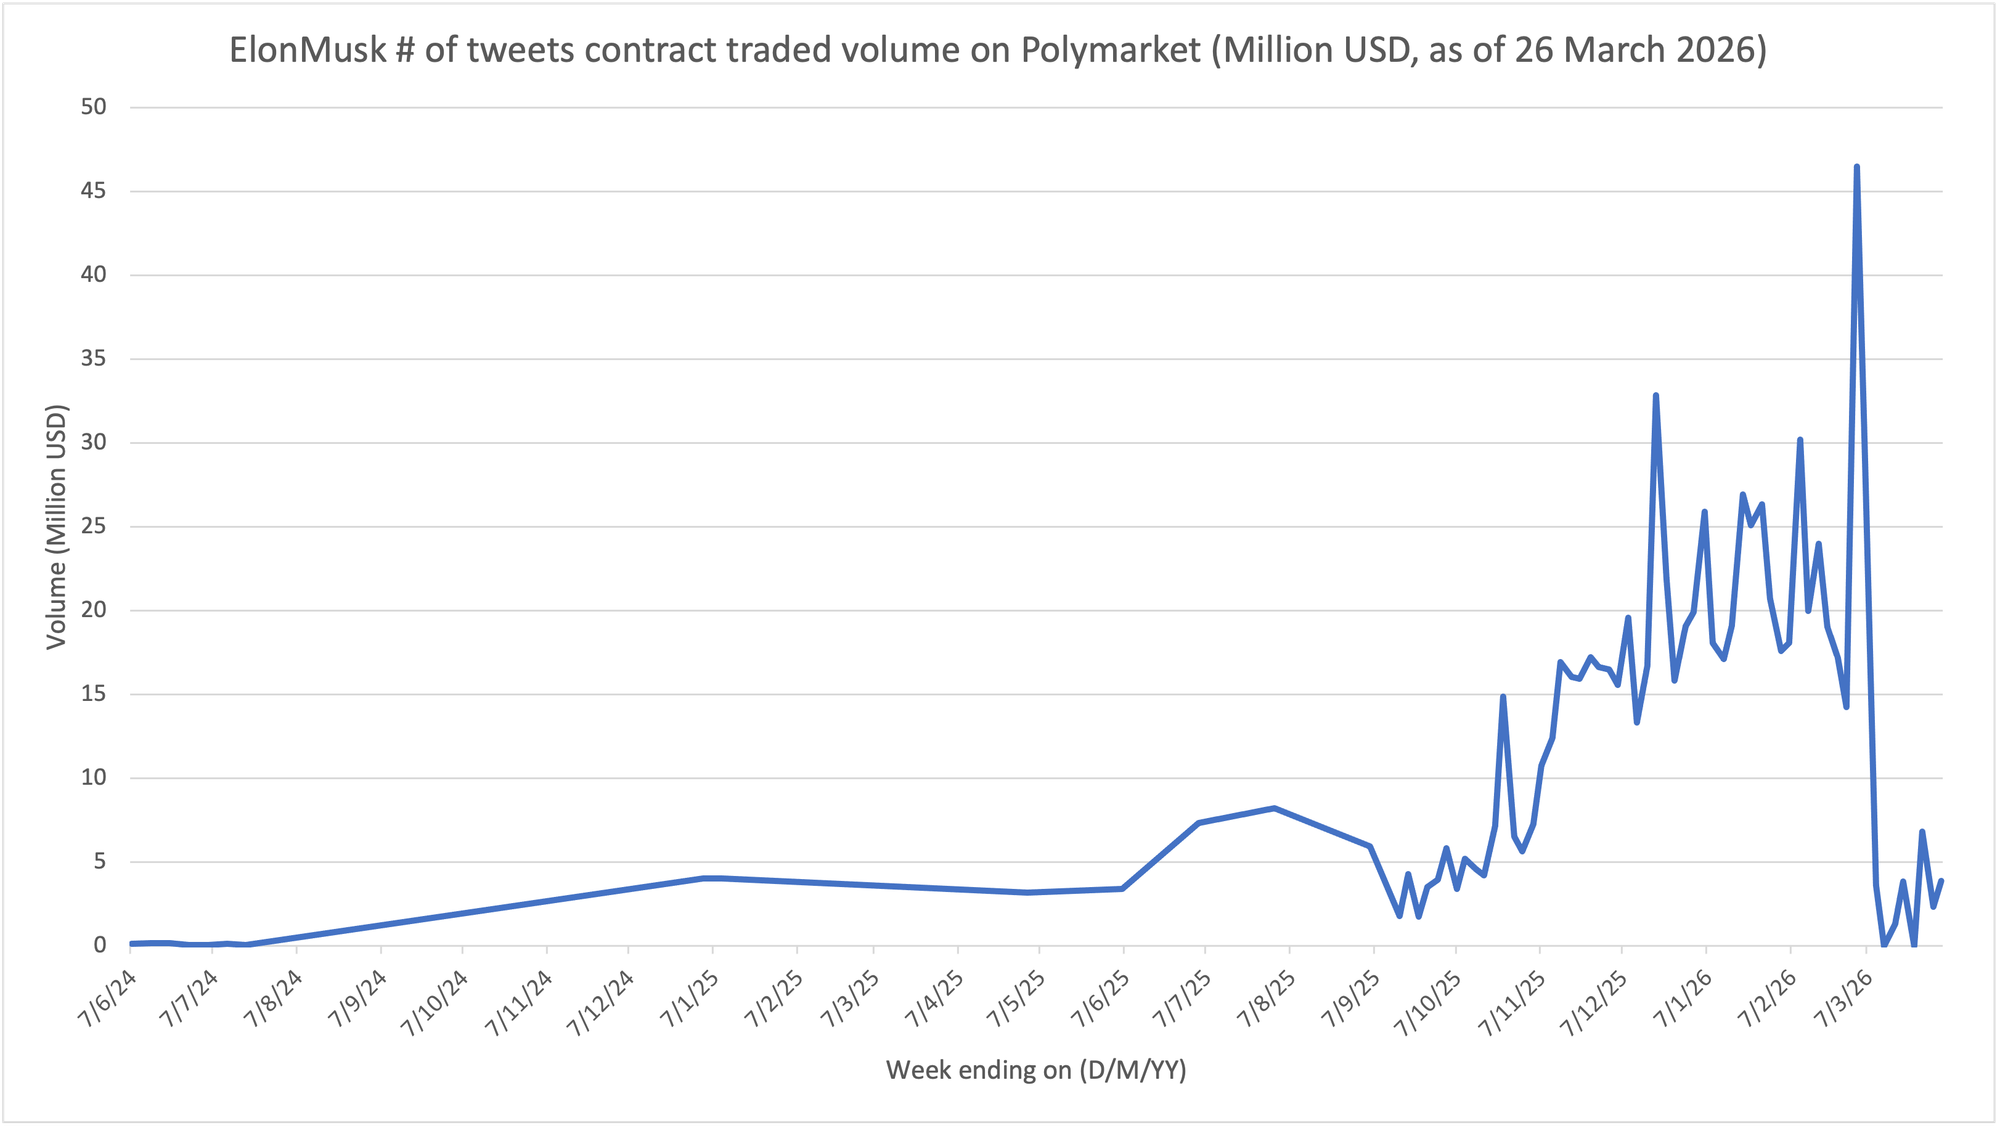
Polymarket launched weekly markets on Elon Musk’s X posting volume in June 2024, and by the last week of February 2026 those markets had grown from about $136,000 to $46.5 million in weekly volume. That is no longer a novelty market. It is a live event contract with real money, real repricing, and real demand for better analysis.
Don't know what a Prediction Market is?
That is where Elon X Forecast and MuskMeter come in.
They do not eliminate uncertainty. Elon is still Elon. They try to do something specific: impose statistical regularity on a subject who may not cooperate.
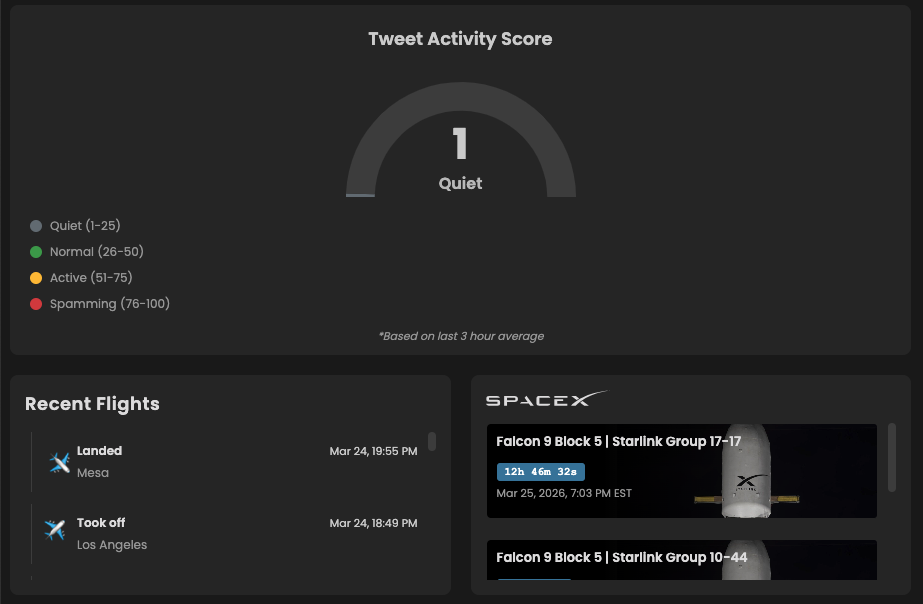
MuskMeter is the live tape. Its site surfaces real-time tweet tracking and organizes the flow into usable views, including moving averages, hourly activity, cumulative timeline, day-of-week distribution, event volume, a tweet activity score based on the last three-hour average, recent posts, the site also tracks flight activity and SpaceX schedules, on the theory that travel days correlate with quieter posting. In other words, MuskMeter is where you go to see what is actually happening right now at a more granular level.
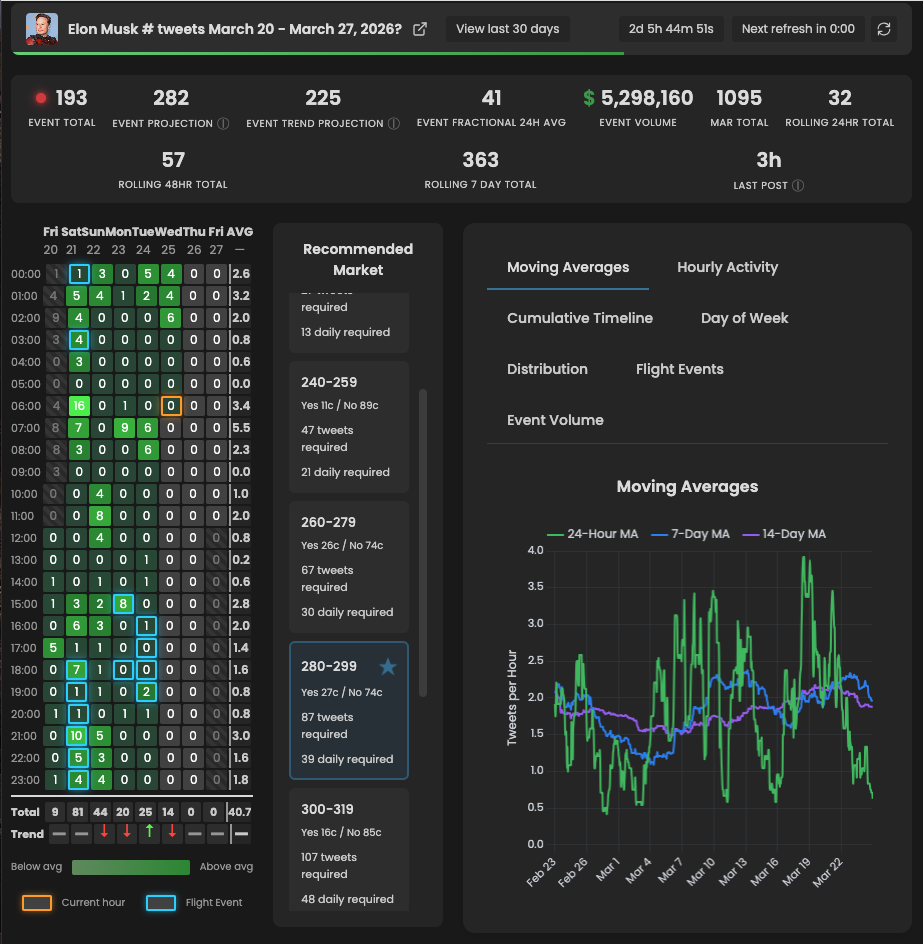
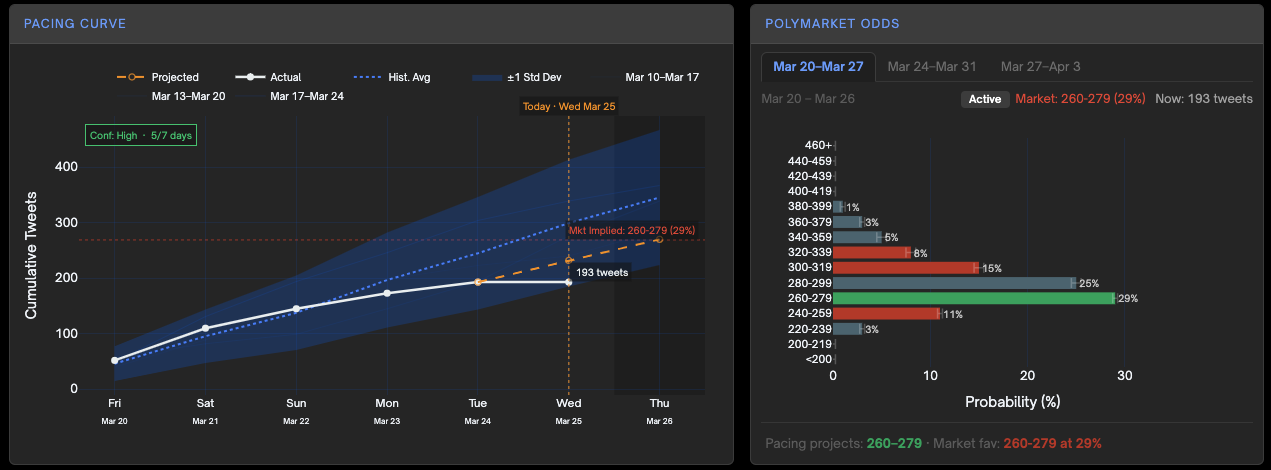
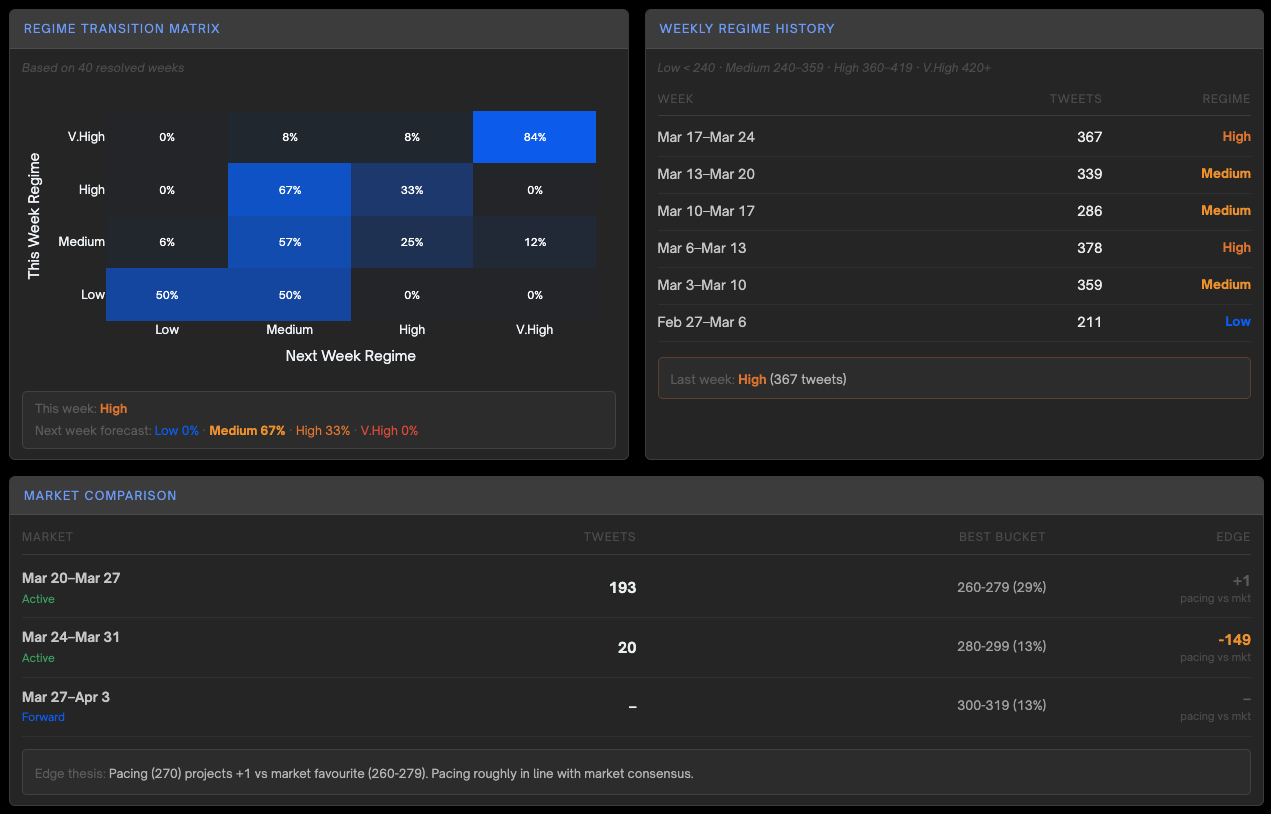
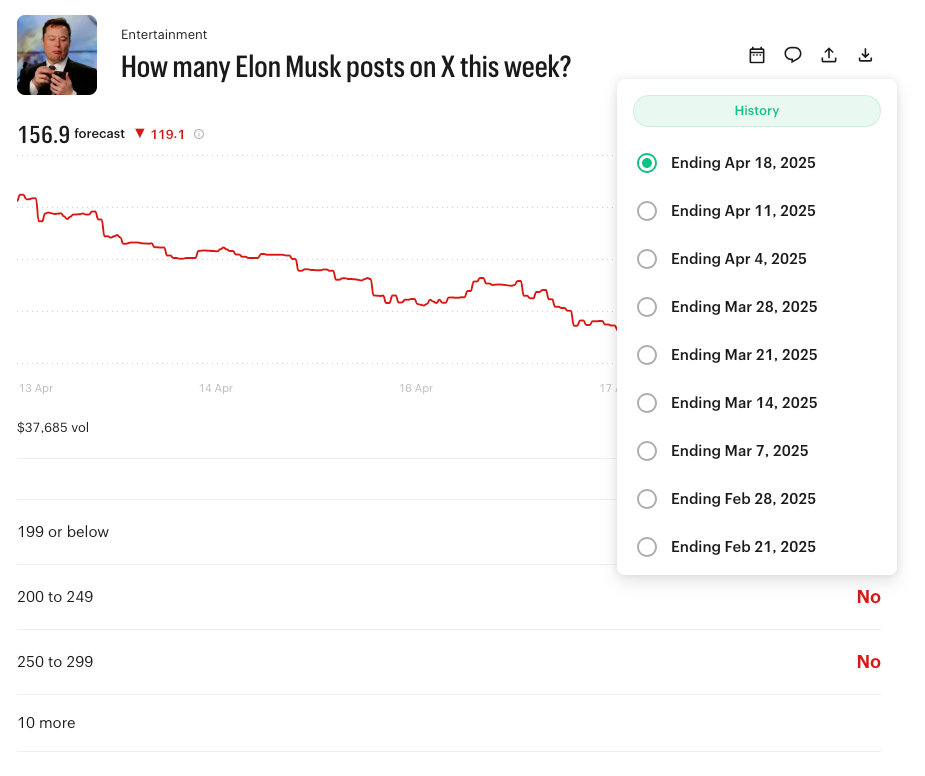
Elon X Forecast is the market lens. The tool claims 86 weeks of historical data as its foundation, built around two hypothesized drivers: momentum and mid-week pacing. The site combines a live pacing curve with current Polymarket tweet-market data, turning it into a dashboard for checking whether the contract price actually matches the observed pace of posting.
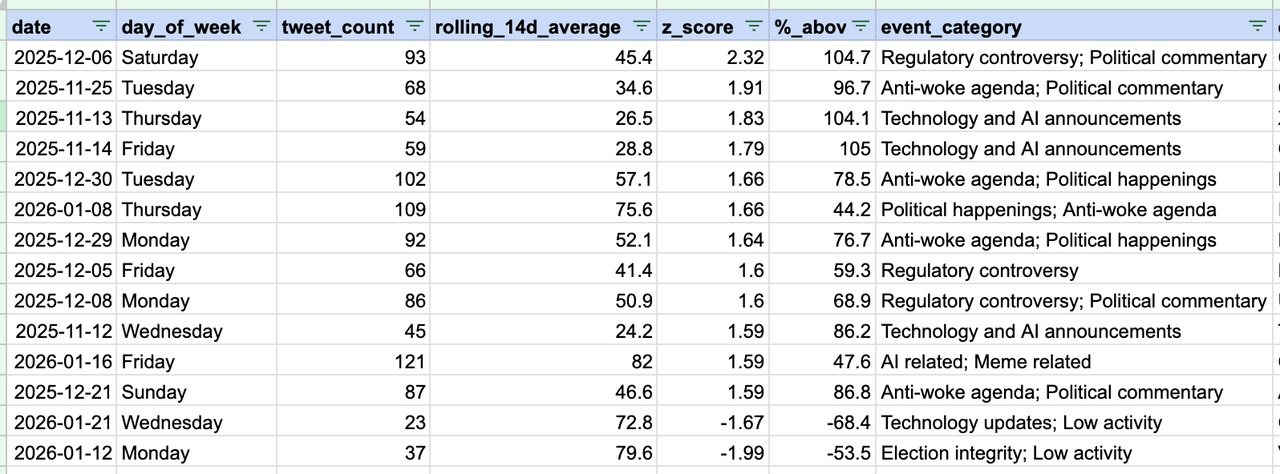
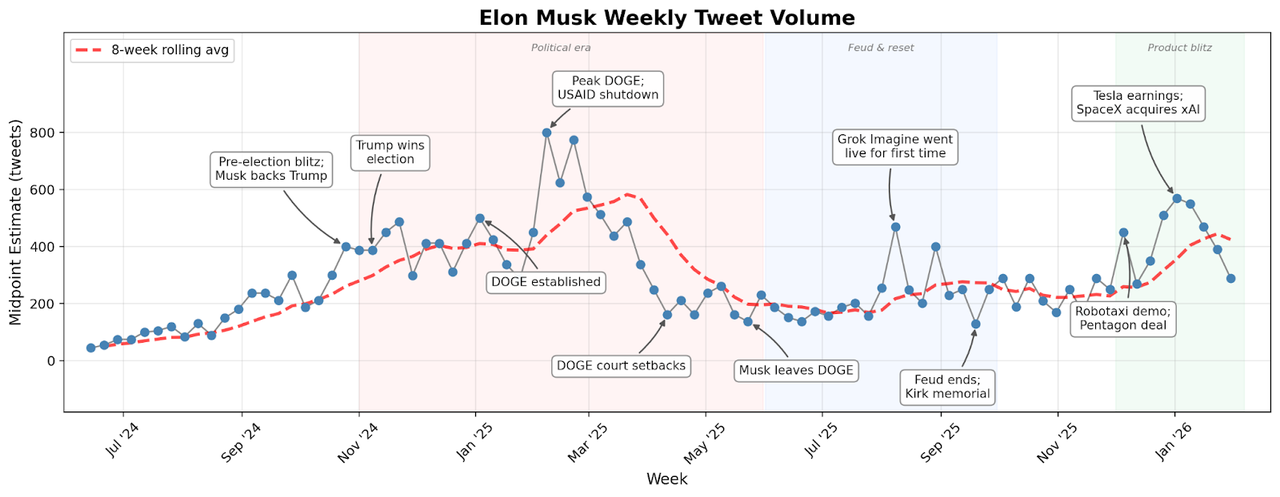
Speaking of the tweet volume outliers at some points in time, the tool creator also notes the following:
"Most of these departures (from the averages), 85% to be exact, are positive outliers (volume spikes). Looking at the categories, we see some trends:
(1) “Woke Mind Virus” and other political commentaries tend to spark extended threads that can balloon the weekly total.
(2) Tech updates and election integrity topics are normally associated with lower tweet levels."
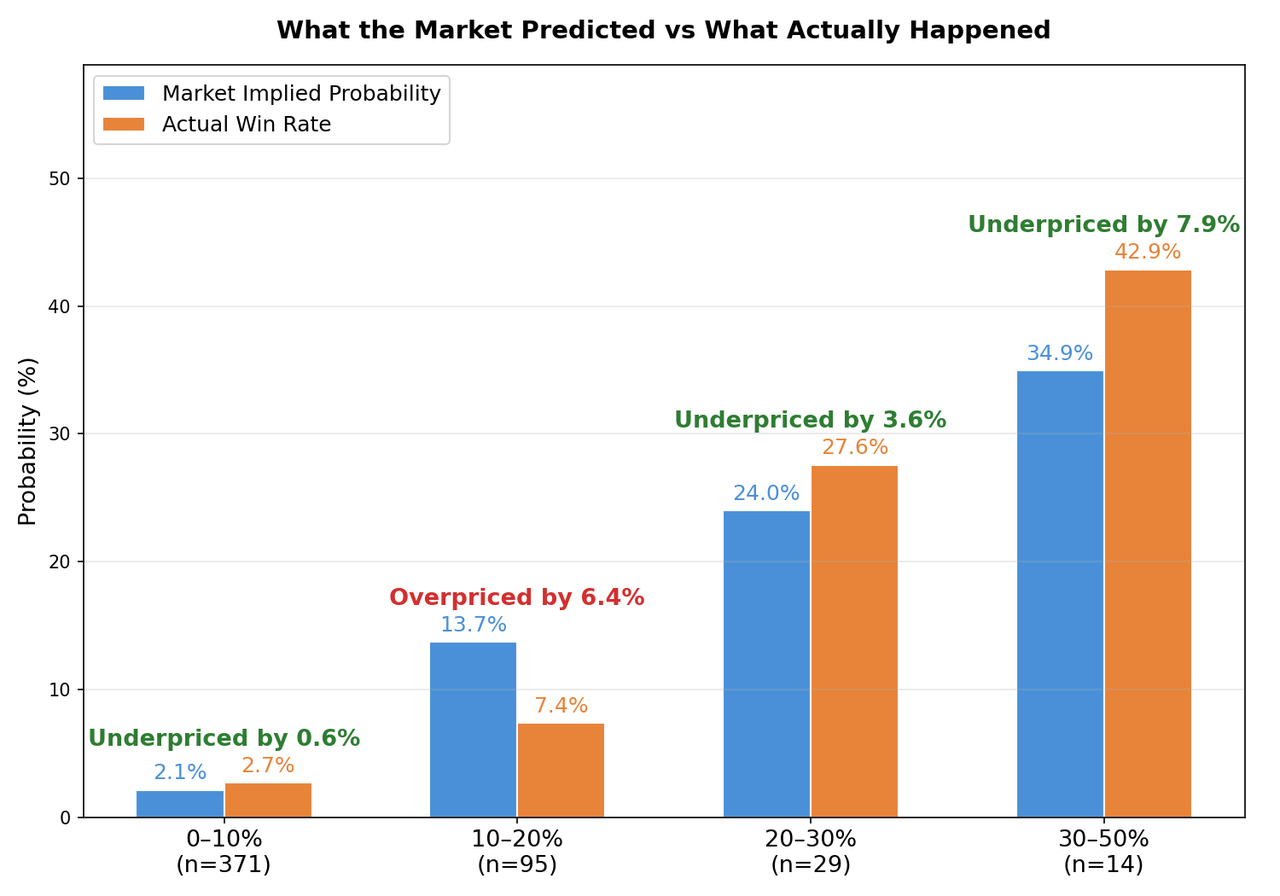
On the other hand, by comparing historical market-implied probabilities and realized win rates (i.e., the actual outcomes), we can see significant market mispricings. The 10-20% bucket appears overpriced, with markets assigning 13.7% odds to outcomes that materialize only 7.4% of the time. Meanwhile, the 30-50% bucket looks underpriced: contracts imply 34.9% odds, yet end up winning about 43% of the time.
This is consistent with the psychological bias called favorite-longshot bias, which describes that people tend to overweight small probabilities and sometimes underweight relatively high probabilities, which can lead them to overpay for longshots and underprice favorites.
If you do decide to trade this market, the most disciplined approach would be to use them in sequence.
Start with MuskMeter, not the odds. Look at the recent-post flow. Check whether activity is clustering in bursts or spreading steadily through the day. Look at the short-run activity score and the moving-average context. This stops you from making the classic mistake of reacting to price before checking the underlying tape.
Then move to Elon X Forecast. Here the goal is not just to count tweets. It is to interpret them. There is some evidence supporting that tweet volume exhibits momentum from week to week, that pacing becomes more informative as the week develops, and that outlier event days can push totals far above normal. For example, by Tuesday, about 69% of a typical week’s total tweets had usually already been posted in the last-14-week pacing sample. That means mid-week counts are not just trivia. Instead, they are a basis for projecting the final weekly total and checking whether market odds have lagged reality.
This is why the tools are strongest in combination.
On its own, MuskMeter can make a user too reactive. You see a burst of posting and immediately assume the high bucket is live. On its own, Elon X Forecast can make a user too abstract. You start staring at modeled ranges and forget that markets can reprice violently when a real-world catalyst hits. But together they create a disciplined workflow: MuskMeter for observation, Elon X Forecast for valuation.
A practical routine looks like this.
Before the week starts, use Elon X Forecast to understand the baseline: what range is realistic given prior-week momentum and historical behavior? During the week, use MuskMeter to monitor whether the live flow is confirming or breaking that baseline. Then return to Elon X Forecast to see whether Polymarket prices have adjusted enough. If live activity is running ahead of normal pace and the contract still looks anchored to an older, quieter expectation, that is the point of analysis.

From curious to confident. Join the sharpest forecasters online, get top contracts, platform updates & market signals - free.
These tools are useful, but people should be clear about the bet they are really making. Every model in this space ultimately leans on the same hidden premise that Musk’s future posting behavior will rhyme with his past. Most of the time, that is a fair assumption. The 86-week sample behind Elon X Forecast does show some momentum and pacing effects. But this is not payrolls, CPI, or an election cycle. It is the discretionary behavior of one man, and one who can plainly see that the market is watching his output in real time. That creates a regime-change risk no backtest can diversify away as Elon can abruptly change his behavior at any time.

And the venue mix says something too. Kalshi currently appears to lean toward broader Musk-themed markets rather than a rolling tweet-count franchise, while Polymarket is still listing weekly Elon tweet contracts. That alone hints at the market-integrity discomfort around an underlying so close to being self-aware.
For traders, the takeaway is not to ignore these tools. It is to understand their limit: your edge is only as durable as the underlying is ungameable.
In a nutshell, for the general public, the big takeaway is simple: stop treating the contract like a meme and start treating it like a sequence of signals.
One tool shows the behavior. The other helps translate that behavior into market context.
And that is the real value of MuskMeter and Elon X Forecast: they do not tell you the future with certainty. These tools give you a real informational edge over pure guessing. The question is whether that edge survives contact with a subject who can see you watching.
Recommended reading: 🔮 TWEET QUANT
Useful links: Elon X Forecast, MuskMeter
Disclaimer: The content is for informational purposes only. You should not construe any such information or other material as legal, tax, investment, financial, or other advice. Nothing contained in this article constitutes a solicitation, recommendation, endorsement, or offer by the author(s) or any third party service provider to buy or sell any securities or other financial instruments in your or in any other jurisdiction in which such solicitation or offer would be unlawful under the securities laws of such jurisdiction. The author(s) report(s) no conflict of interest.