TL;DR | Container Margins Normalise; Tanker Cycle Strengthens
- Container profitability weakened: COSCO Holdings’ revenue rose 2.6% to RMB111.9bn ($16.2bn), while net profit fell 23.6% to RMB13.4bn ($1.9bn) as lower revenue per TEU and higher costs compressed margins.
- Cargo volumes remained firm: Container volume increased 7.5%, led by Asia–Europe and trans-Pacific routes.
- Q2 improved sequentially: Net profit rose 28.3% QoQ to RMB7.54bn ($1.09bn) following a weak Q1.
- Congestion exceeded the pandemic-era record: A record 4.31mn TEU of containership capacity was waiting to berth globally, with Shanghai and Ningbo among the main bottlenecks.
- COSCO continues to buy scale: Another 18 ships costing RMB20.3bn ($2.9bn) lifted disclosed 2026 newbuilding commitments to RMB39.0bn ($5.7bn).
- Tanker earnings accelerated: COSCO Energy’s net profit increased 140.6% to RMB4.56bn ($660mn), supported by high VLCC rates and longer crude-trading distances.
1. COSCO Holdings | Volume Growth Meets Margin Pressure
COSCO Holdings’ first-half performance reflected the wider container shipping market: a weak Q1 followed by a stronger Q2. The sequential recovery improved near-term momentum, although first-half earnings remained below the previous year.
Strong Volumes, Weaker Unit Economics
Demand remained resilient across COSCO’s main routes:
- Total shipping volume increased 7.5% to 14.28mn TEU.
- Asia–Europe volume rose 12.4%.
- Trans-Pacific volume increased 9.7%.
- Intra-Asia volume grew 5.3%.
The volume gains did not translate into comparable earnings growth:
- International revenue per TEU fell 2.1%.
- Container shipping net profit declined 28.7%.
- EBIT margin narrowed to 14.2% from 20.5%.
Higher volumes supported revenue, but weaker unit revenue and higher operating costs drove the decline in profitability. Non-ocean supply-chain revenue rose 11.6%, providing a partial offset.
The near-term rate backdrop has since become more supportive.
Q2 Turns the Corner as Spot Rates Reaccelerate
The first-half headline masks a clear sequential improvement. COSCO Holdings’ Q2 net profit rose 28.3% QoQ to RMB7.54bn ($1.09bn), recovering from a softer first quarter.
The improvement coincided with a sharp acceleration in container spot rates toward the end of Q2.
CCFI rose roughly 44% during Q2, from 1,185 in early April to 1,710 by June 26. The rally then extended into July, showing that COSCO exited the reporting period with materially stronger freight-rate momentum than it entered it with.
4.31mn TEU at Anchor: Congestion Exceeds the Pandemic-Era Peak
Global containership capacity waiting to berth reached a record 4.31mn TEU, exceeding the previous high of approximately 4.0mn TEU in 2022. While current stranded capacity represents 12.6% of the global fleet, below the 15.7% share recorded in 2022, when the fleet was considerably smaller.
Congestion is therefore at a historical high in absolute TEU terms, but not relative to the total fleet.
- Shanghai and Ningbo were among the principal congestion points.
- Lower effective capacity supports spot freight and charter rates.
- Operational drawbacks include longer delays, skipped port calls and higher costs.
For COSCO, congestion should support near-term rates, although the benefit depends on how long it lasts. Against this temporary capacity squeeze, a notable disclosure alongside the interim results was a RMB20.3bn ($2.9bn) order for new ships.
COSCO Keeps Buying Scale: 18 More Ships
COSCO’s latest order comprises:
Together with an 18-vessel order announced in January, COSCO’s disclosed newbuilding commitments in 2026 have reached approximately RMB39.0bn ($5.7bn).
By end-July, COSCO operated 606 containerships with 3.66mn TEU of capacity. Existing and ordered capacity together exceeded 5.3mn TEU.
2. COSCO Ports | A Growing but Modest Earnings Buffer
The terminal business provided a partial earnings buffer:
- Total throughput increased 7.9%.
- Overseas terminal throughput grew 18.1%.
- Operating profit rose 52.5% on a reported basis, but roughly 13% excluding a US$53.7m provision reversal.
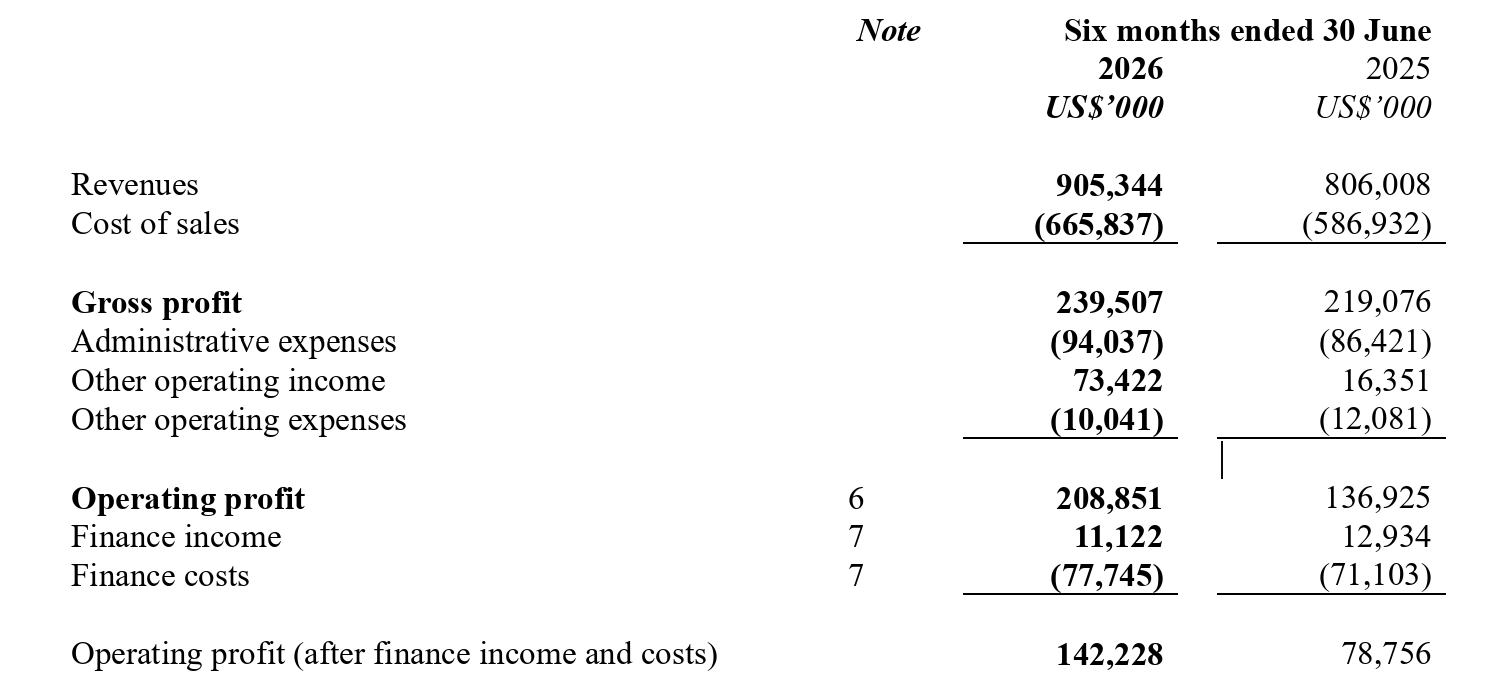
The improvement strengthens COSCO’s shipping-port-logistics network and indicates better operating leverage.
3. COSCO Energy | VLCC Upcycle Drives Earnings Expansion
COSCO Energy reported a sharp improvement in first-half earnings:
- Revenue increased 30.3% to $2.18bn.
- Gross margin rose 18.4% to 41.4%.
- Net profit increased 140.6%.
International Crude Shipping Leads Growth
International oil shipping was the principal driver:
The VLCC market benefited from longer trading distances and tight compliant capacity:
- TD15 West Africa–China TCE averaged $117,800 per day.
- TD22 US Gulf–China averaged $111,000 per day.
Middle Eastern supply disruption increased Asian crude sourcing from the US Gulf, West Africa and South America. The resulting increase in voyage distances supported tonne-mile demand and vessel earnings.
Source:
- Company press release - https://ports.coscoshipping.com/en/Investors/AnnouncementsCirculars/Announcements/
- Company press release - http://en.energy.coscoshipping.com/col/col21112/index.html
- Company press release - http://en.hold.coscoshipping.com/col/col25416/index.html