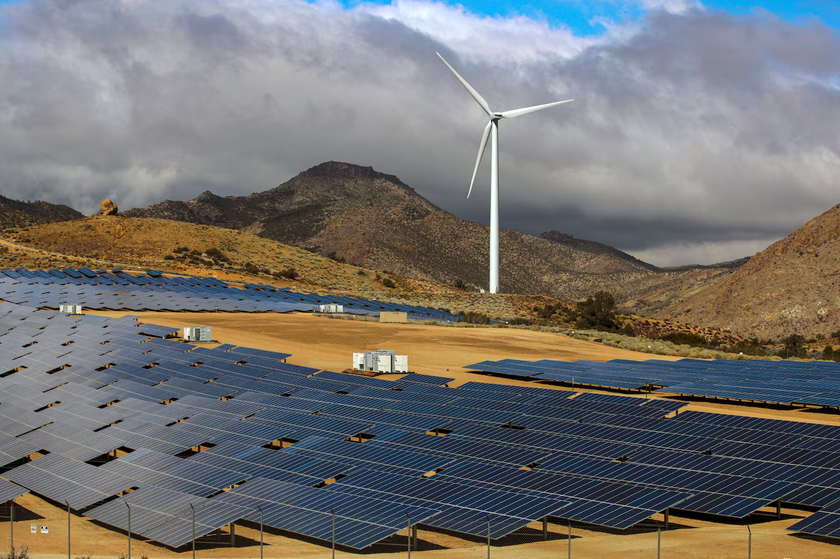
On August 4 Reuters reported that California had curtailed approximately 4.5 million megawatt-hours of wind and solar generation in the first half of the year, already exceeding the 3.77 million megawatt-hours curtailed during all of 2025.
At first glance, this appears absurd. On the one hand, electricity is sometimes so abundant that prices fall below zero. On the other hand, California continues to maintain several thousand megawatts of emergency resources to protect against summer heatwaves, wildfires and regional power shortages.
But this does not mean that California simultaneously has too much electricity and too little electricity at the same moment. Instead, the state is experiencing two entirely different forms of scarcity:
- At midday in spring, it lacks the capacity to absorb, store or export surplus electricity.
- During summer evenings and periods of extreme weather, it lacks capacity that can ramp up quickly, continue generating for extended periods and be delivered reliably to where it is needed.
What California truly lacks is not total annual electricity generation, but power that can be supplied continuously, at the right time and in the right place, and delivered to consumers through the grid.
The 4.5 Billion kWh of Curtailed Electricity
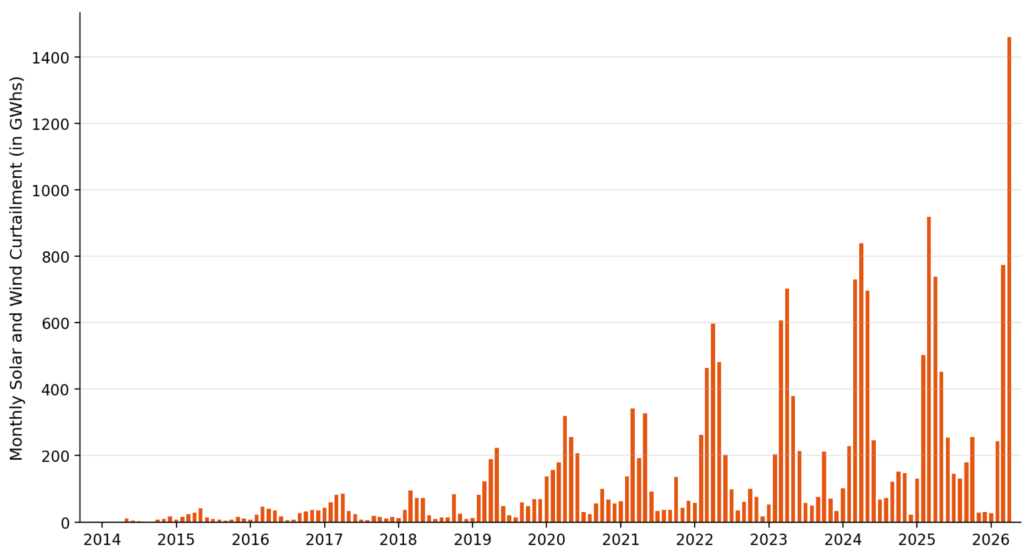
According to CAISO’s (California Independent System Operator) monthly data, a total of 4,502,385 megawatt-hours (or 4.502 billion kilowatt-hours) of wind and solar generation was curtailed between January and June 2026. Spread evenly across every minute of the first half of the year, this would be equivalent to a power plant with approximately 1.04 gigawatts of capacity operating continuously for 181 days.
| Month | Curtailed Wind and Solar Generation | Share of Five-Minute Intervals with Negative Prices | Maximum Three-Hour Net-Load Ramp |
|---|---|---|---|
| January | 23,400 MWh | 2.05% | 16.43 GW |
| February | 242,300 MWh | 7.31% | 17.76 GW |
| March | 774,300 MWh | 19.60% | 20.86 GW |
| April | 1,415,500 MWh | 28.26% | 18.42 GW |
| May | 1,447,500 MWh | 22.03% | 20.07 GW |
| June | 599,400 MWh | 12.51% | 20.93 GW |
April and May alone accounted for approximately 63.6% of all curtailment during the first half of the year. The problem was most severe not during the peak summer demand season, but in spring, when temperatures were mild, air-conditioning demand was relatively low, and solar output was already high.
In April 2026, curtailed electricity represented about 18% of the utility-scale wind and solar generation that was available that month. The amount curtailed in that single month even exceeded the total curtailment recorded over the five years from 2014 to 2018.
Curtailment, Negative Prices and Power Shortages Are Three Different Problems
Curtailment: The System Cannot Efficiently Accommodate the Next Unit of Electricity
Curtailment can result from either physical constraints or economic dispatch.
Physical curtailment usually occurs when transmission lines in a particular area are already operating at full capacity. Even if another city needs electricity, additional power generated in a solar-rich region cannot be transmitted out.
Economic curtailment occurs when there is insufficient demand in the market. Continued generation could cause supply to exceed demand, pushing market prices below zero and prompting generators to reduce output.
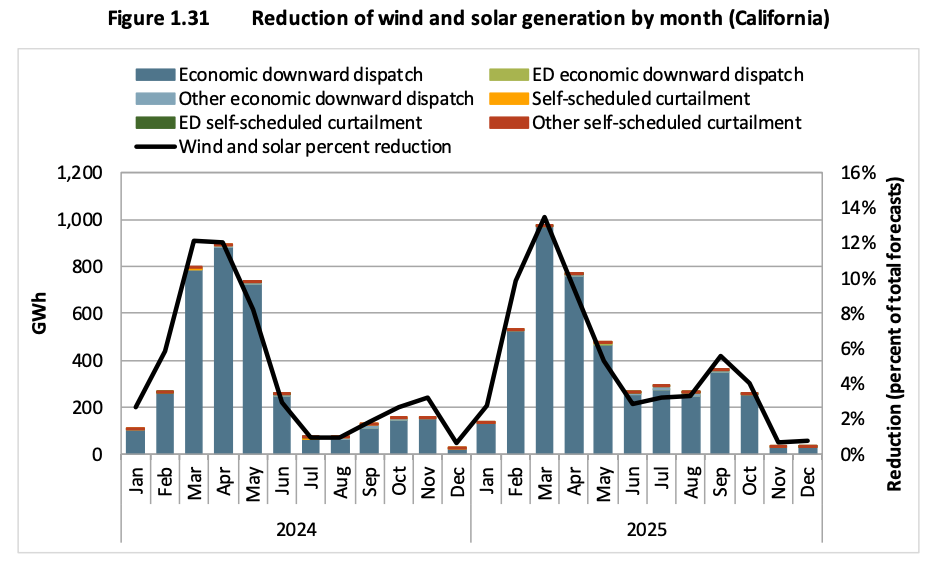
CAISO’s Department of Market Monitoring estimated that, across the Western Energy Imbalance Market in 2025, approximately 4.78 million megawatt-hours of downward dispatch of wind and solar generation was economic, accounting for 89% of the relevant reductions. Self-scheduled resources were forcibly curtailed by approximately 480,000 megawatt-hours, accounting for 9%. This indicates that most curtailment was not caused by emergency operators suddenly disconnecting generation. Instead, the market actively reduced output in response to supply, demand and generator bids.
Negative Prices: The Next Unit of Electricity Has Negative Marginal Value at a Particular Time and Location
Negative electricity prices do not mean that the power system as a whole has no value, nor do they mean that households can consume electricity for free. They simply indicate that, at a particular node and during a particular five-minute or fifteen-minute trading interval, the system does not want to receive additional electricity.
Renewable energy projects may be willing to submit negative-price bids for several reasons:
- The short-run marginal cost of generating wind and solar power is close to zero.
- Projects may receive tax credits, renewable energy certificates or fixed contractual payments.
- Some conventional power plants face high shutdown and restart costs, so they may also prefer to continue operating during periods of low prices.
As long as the loss caused by a negative market price is smaller than the subsidy or contractual revenue received, continued generation may remain profitable.
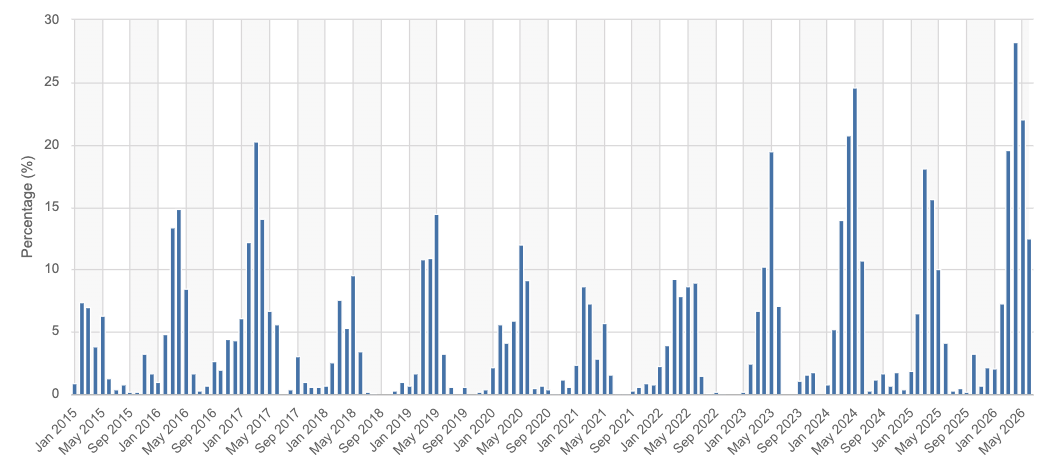
CAISO notes that negative prices occur most frequently when renewable generation is high and electricity demand is low. In 2025, negative prices occurred in 8.4% of five-minute intervals in the CAISO market, down from 10.7% in 2024. In April 2026, however, the share rose again to 28.26%. In other words, batteries and market reforms have reduced the problem on an annual average basis, but they have not eliminated extreme oversupply around midday in spring.
Power Shortages: A Lack of Deliverable Capacity During Critical Periods
Reliability shortages are not determined by how much electricity is generated over the course of an entire year. The relevant question is whether the system can maintain the balance between supply and demand during its most difficult hours.
CAISO forecasts a peak load of 46,844 megawatts in 2026. Its probabilistic model indicates that, under normal planning assumptions, the system has an effective capacity surplus of approximately 2,547 megawatts and can satisfy the reliability standard of limiting the expected loss of load to no more than 0.1 days per year. In other words, California is not expected to face an inevitable power shortage under normal conditions.
The problem is that the model does not simultaneously simulate overlapping extreme events such as a prolonged drought, wildfires disrupting transmission, a heatwave affecting the entire western United States and failures at several large generating facilities. CAISO has explicitly stated that these risks, if they occur at the same time, could still lead to emergency conditions.
California’s decision to retain emergency generation is therefore not contradictory. For the summer of 2026, the state prepared up to approximately 4,500 megawatts of emergency and reserve resources to address extreme conditions that fall outside the assumptions of its standard planning model.
The Real Challenge Is What Happens Within Three Hours
At midday, when solar output is high, net load can fall to very low levels. After sunset, solar generation declines rapidly, but demand does not fall at the same pace. Net load therefore rises sharply.
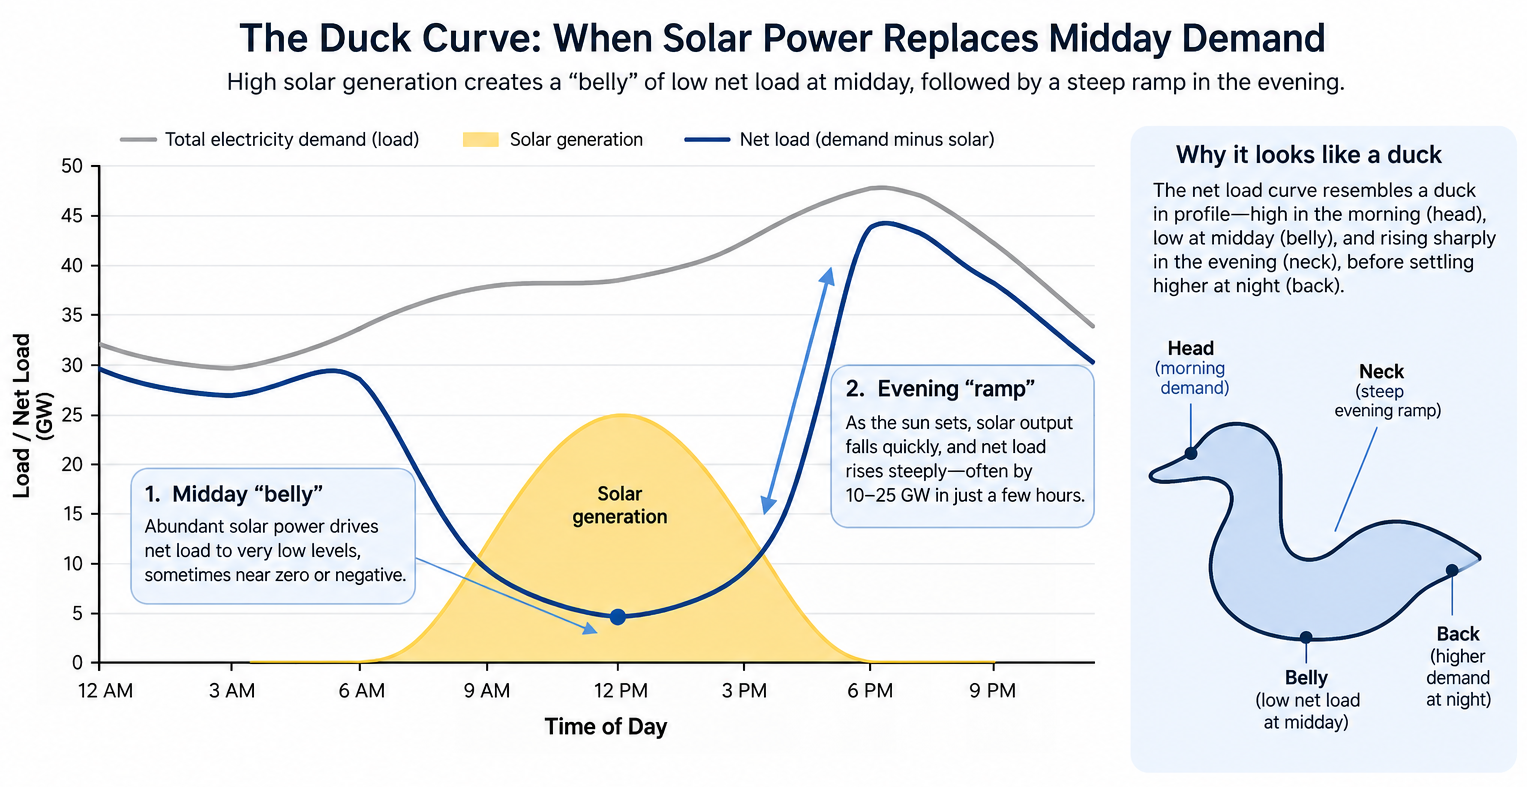
In June 2026, CAISO’s maximum three-hour net-load ramp reached 20,931 megawatts, equivalent to 44.7% of the forecast peak load for 2026. This means that the system sometimes has to rearrange enough electricity supply within three hours to meet nearly half of the grid’s peak demand.
This supply does not necessarily have to come entirely from newly started plants. It can be supplied through:
- Batteries discharging
- Existing facilities increasing output
- Increased electricity imports from other states
- Renewable energy sources that continue generating during the evening
Regardless of where it comes from, what the system needs is power capacity that can change its operating state quickly, not additional solar electricity when the grid is already unable to absorb it.
This explains why electricity generated by the same solar plant may have a negative value at midday, while storing that same unit of electricity and delivering it at 8 p.m. can significantly increase its value. Electricity is not a homogeneous commodity whose value is independent of time.
California Already Has More Than 17 GW of Battery Storage. Why Is Curtailment Still Rising?
By 2025, California’s installed battery storage capacity had exceeded 17,000 megawatts. Batteries have become an important source of electricity during the evening peak, rather than merely an experimental technology.
Within the CAISO system, the capacity of batteries participating in the market increased from approximately 500 megawatts in 2020 to 13,000 megawatts by the end of 2024.
In 2024, battery charging accounted for an average of 14.7% of system load between 10 a.m. and 1 p.m. Between 5 p.m. and 9 p.m., batteries supplied an average of 8.6% of the system’s electricity while meeting 84% of its frequency-regulation requirements.
These figures show that batteries have significantly reduced the severity of the duck curve. However, they have not eliminated curtailment entirely, for at least five reasons.
First, Megawatts Are Not Megawatt-Hours
The figure of 17,000 megawatts describes the maximum rate at which batteries can charge or discharge, not the amount of energy they can store.
Most existing utility-scale batteries in the CAISO system have a discharge duration of approximately 4 hours. A 100-megawatt, four-hour battery can store about 400 megawatt-hours of energy, which is not enough to support the system through several consecutive days of extreme heat or an extended period of cloudy weather.
Second, Curtailment and Batteries May Occur in Different Locations
When transmission lines in a solar-intensive region are already congested, batteries located near the Los Angeles load centre may not be able to absorb the electricity being curtailed there.
Only batteries located upstream of the congested transmission line, sharing the same grid connection as the solar facility, or connected through sufficient transmission capacity can directly reduce curtailment at a particular project. The location of battery storage is therefore just as important as the amount of capacity installed.
The market has already begun adapting to this problem. Approximately 41% of existing utility-scale solar capacity in the CAISO system is co-located with batteries, while about 93% of solar projects scheduled to begin operating before 2030 include battery storage.
Third, Batteries Cannot Use Their Entire Capacity to Absorb Curtailed Electricity
Batteries must also reserve energy for the evening peak, frequency regulation, reserve capacity and other ancillary services. Once a battery is fully charged at midday, it cannot absorb additional solar generation later in the afternoon. Conversely, if it does not preserve sufficient capacity because it is absorbing more low-priced electricity, it may not have enough energy available to discharge in the evening.
Fourth, Battery Dispatch Is Affected by Market-Design Problems
CAISO’s day-ahead market optimises operations over the following 24 hours. However, the 15-min real-time market looks ahead only about two hours, while the five-minute market has an optimisation horizon of only about 65 minutes.
When prices rise earlier in the afternoon, the real-time market may instruct batteries to discharge prematurely because its optimisation software cannot see the more severe evening peak several hours ahead. As a result, batteries may enter the critical period with an insufficient state of charge. CAISO’s Department of Market Monitoring has identified these limited optimisation horizons as an important problem affecting battery dispatch.
Fifth, Four-Hour Storage Solves Intraday Mismatches, Not Every Type of Mismatch
Four-hour lithium-ion batteries are highly effective at shifting electricity from midday to the evening, but they are not well suited to solving the following problems on their own:
- Extended periods of heatwaves, low wind and cloudy weather
- Seasonal mismatches between winter and spring
- Reduced solar generation caused by wildfire smoke
- Widespread transmission failures
California therefore needs a portfolio of resources with different discharge durations, rather than treating every problem as something that can be solved simply by building more batteries.
Transmission Capacity May Be Scarcer Than Generation Capacity
Renewable energy projects can usually be built within a few years, but large transmission lines require route selection, environmental assessments, land coordination, regulatory approvals, procurement and construction. The process often takes more than a decade.
The SunZia project illustrates the difference between generation capacity and deliverable capacity. The project has 3,650 megawatts of installed capacity, of which approximately 3,167 megawatts has been allocated to CAISO. However, in its summer 2026 reliability assessment, CAISO initially counted no more than 1,009 megawatts of additional import capability. The reasons included transmission rights, import capability limits and unfinished internal upgrades in Southern California. The relevant upgrades are not expected to enter service until around 2034.
In other words, building 3,650 megawatts of wind capacity does not mean that California receives 3,650 megawatts of reliable electricity when it is needed most.
This is also why simply counting newly installed solar, wind and battery capacity can easily overstate the actual improvement in the power system.
In 2026, CAISO approved 38 transmission projects with an estimated total investment of approximately US$6.7 billion over the next decade. More than half of the projects and more than half of the investment were driven by growth in electricity demand. The plan also includes 12 reconductoring projects, three of which will use advanced conductors to increase the capacity of existing lines without constructing entirely new transmission corridors.
By 2035, California’s electricity load is expected to increase by 15 gigawatts, while the system will need to add more than 74 gigawatts of resource capacity. By 2040, load is expected to increase by 20 gigawatts, while required resource capacity will rise by more than 107 gigawatts.
This does not necessarily mean that California is overbuilding power plants by a factor of five. The additional resources include solar and wind facilities that cannot maintain their nameplate output around the clock, as well as storage systems that must first be charged before they can discharge. To meet demand in every hour, the system requires higher nominal installed capacity, complementarity among different resources and substantial transmission redundancy.
Why Have Negative Electricity Prices Not Translated into Lower Residential Bills?
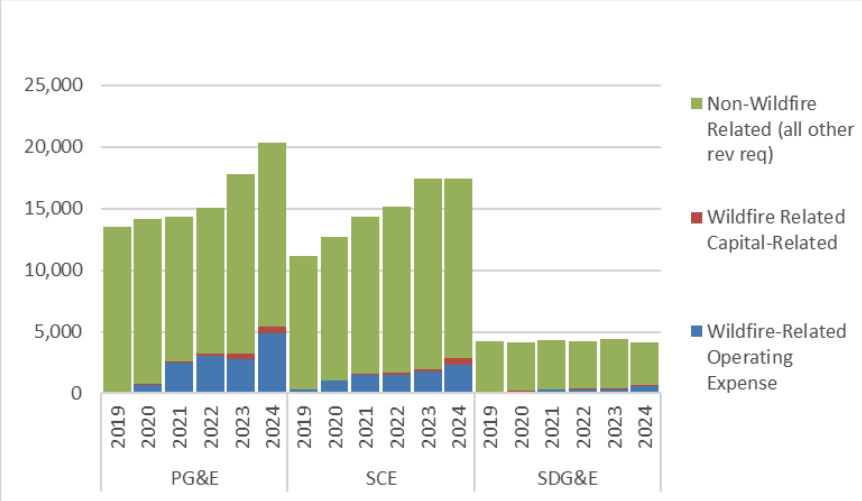
The California Public Utilities Commission identifies three major drivers of the state’s recent electricity-rate increases: wildfire-related expenditure, cost shifting associated with rooftop solar programmes, and increased investment in distribution infrastructure. In 2024, wildfire-related revenue requirements accounted for approximately 27% of PG&E’s total revenue requirement and about 17% of those of SCE and SDG&E. Rooftop solar programmes were estimated to shift approximately US$7 billion in costs to customers without solar systems.
The claim that “wholesale prices are negative, so households should receive electricity for free” is therefore incorrect.
A negative price means only that the marginal unit of electricity has no value at a particular location around midday. The transmission network, distribution grid, wildfire-prevention work and reliable evening capacity must still be paid for throughout the year. Those costs do not disappear simply because wholesale prices fall below zero for several hours around midday.
Curtailment does increase overall system costs because it reduces the utilisation of assets that have already been built and may require consumers to pay simultaneously for additional renewable generation, storage and transmission infrastructure. At present, however, California’s high residential electricity rates cannot primarily be attributed to curtailment. Official cost data indicate that wildfire-related and network costs have had a greater impact.
California Should Not Aim for Zero Curtailment
At first glance, curtailing 4.5 billion kilowatt-hours of electricity may seem to imply that California must build enough batteries and transmission lines to preserve every unit of generation.
From an economic perspective, however, zero curtailment is not necessarily the optimal objective.
Suppose extreme solar oversupply occurs for only a few dozen hours each year. Building an expensive transmission line or a long-duration storage facility that remains idle for most of the year simply to preserve the final unit of electricity may cost more than curtailing that generation directly.
CAISO’s transmission-planning process applies similar logic. It uses production-cost models to compare the cost of new infrastructure with the benefits to consumers from reducing congestion and decreasing the dispatch of higher-cost generation.
The concern for California is therefore not that any curtailment occurs, but that curtailment is increasing too quickly and that the share of available wind and solar generation curtailed in April alone has already reached approximately 18%. This indicates that the mismatch between renewable-energy expansion and the growth of electricity demand, storage and transmission infrastructure is becoming wider.
Disclaimer: The content is for informational purposes only. You should not construe any such information or other material as legal, tax, investment, financial, or other advice. Nothing contained in this article constitutes a solicitation, recommendation, endorsement, or offer by the author(s) or any third party service provider to buy or sell any securities or other financial instruments in your or in any other jurisdiction in which such solicitation or offer would be unlawful under the securities laws of such jurisdiction. The author(s) report(s) no conflict of interest.