The freshly dropped Consumer Price Index print delivered a collective sigh of relief across trading desks, with an inflation reading that was both fairly benign and free of a nasty surprise.
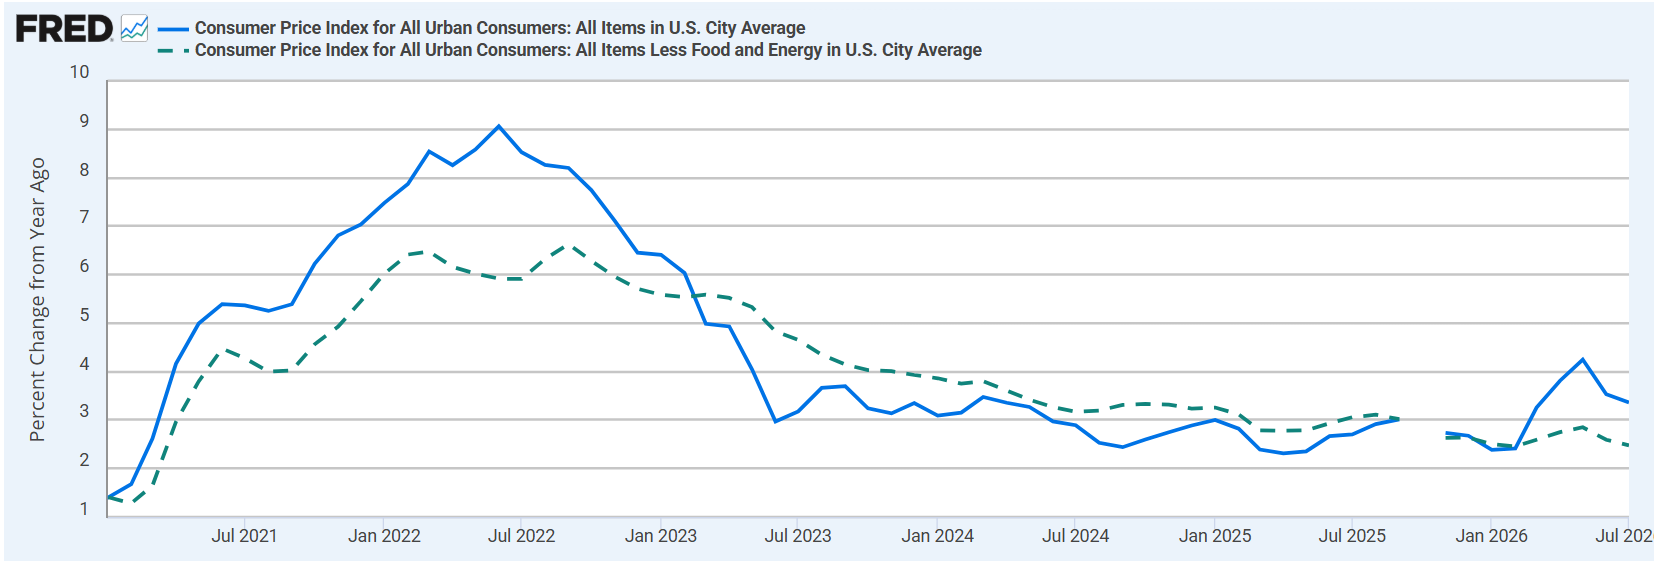
Headline CPI rose 0.1% in July, after falling 0.4% in June. Core CPI, which strips out food and energy, rose 0.2%, after sitting flat the month before. Both numbers landed exactly on the consensus forecast, the kind of nothing-happened print traders haven't gotten much of this year.
Year over year, headline inflation eased from 3.5% to 3.4%. Core slowed from 2.6% to 2.5%.
This makes it a mildly dovish report. For anyone trading a few weeks out, the data made it more difficult to justify an immediate September rate increase.
Where do you think September lands?
No change, the CPI print settles itResult
38.85%
25bp hike, three hawkish dissents still matterResult
29.86%
25bp cut, the labor data is the real signalResult
11.51%
Too close to call before more data landsResult
19.78%
278 Polls
EndedTBD
The details were soft, but not uniformly so
Shelter made the largest positive contribution to the monthly increase, even though the shelter index rose only 0.1%. And accounted for roughly two-thirds of the increase in the overall index. Within shelter, rent and owners’ equivalent rent each rose 0.3%, while lodging away from home fell sharply.
Energy prices declined 1.5%, led by a 2.9% fall in gasoline. Food rose a modest 0.1%, with grocery prices falling slightly even as food away from home continued to rise.
The report was not uniformly soft. Medical care rose 0.4%, airline fares jumped 2.2%, and used-car prices increased 0.4%. Core goods also showed some renewed upward pressure. Still, these pockets were not broad or powerful enough to flip the overall report hawkish.
The most important message from the Bureau of Labor Statistics release is that underlying inflation continued to cool on a year-over-year basis, although monthly core inflation increased from zero in June to 0.2% in July. And energy prices remained 14.7% higher than a year earlier.
Does a soft jobs report cancel out three hawkish votes?
Not entirely. This is the short answer, and it's why September is no longer a foregone conclusion although a hold remains the more likely outcome.
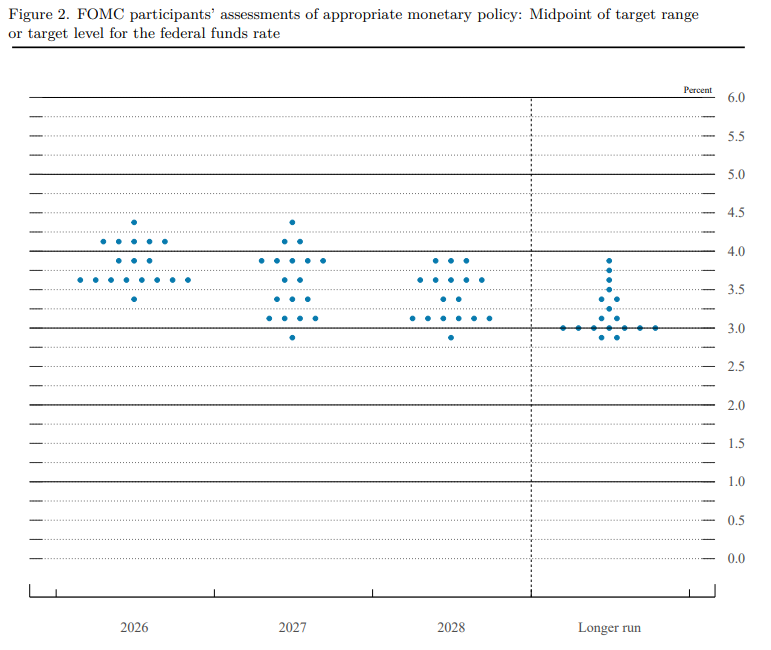
The Federal Reserve’s target range is currently 3.50%-3.75%. At its July meeting, the FOMC voted 9-3 to hold rates steady, and all three dissents wanted a hike.
This is a genuine hawkish bloc, not merely tough rhetoric, and it explains why a September hike still carries meaningful probability even after a friendly CPI report.
But the economic evidence since that meeting has weakened the case for tightening. Payrolls fell by an estimated 23,000 in July, and the two months before that turned out weaker than first reported, by a combined 103,000. Wages are still climbing at a 3.2% annual pace, and fewer people are participating in the labor force than were in January.
None of this proves the three dissenters were wrong in July, but it does mean that raising rates again in September would mean tightening into a labor market that's visibly losing altitude, a much harder case to make than it was a month ago.
Put together, inflation still runs hot enough to keep three voting FOMC members uncomfortable, and the labor market's soft enough to make expanding a three-member dissent into a majority for a hike a much tougher sell. Both things are true at once.
Fed funds futures implied roughly a 38%–40% probability of a September hike after the CPI release. My own working distribution is similar: about 65% for no change, 35% for a 25-basis-point hike, and only a negligible probability of a cut.
Where the 65/35 split might be leaning on the wrong question
Does a hold in September mean the meeting would be dovish? Not necessarily.
September comes with fresh economic projections. The Fed could leave rates unchanged while delivering a hawkish message through the statement, the dot plot and the press conference. Financial conditions could therefore tighten even if the target range does not change.
This creates a useful distinction between the settlement outcome and the macro outcome. A hold can win the bet and lose the trade.
Second, the benign July headline depended partly on falling gasoline prices. Energy is still up sharply over the past year, and renewed geopolitical pressure on oil could reverse this contribution in August. The Fed is more likely to look through a temporary energy shock than a broad demand-driven acceleration, but it will care if energy begins feeding into transportation, goods, services or inflation expectations.
The largest repricing may therefore come after one of the intermediate releases produces an outsized change in September expectations, rather than from the immediate CPI reaction.
The bottom line
July CPI was helpful to the doves but it was not an all-clear. The Fed’s preferred PCE index remained well above its 2% objective in June, three voting FOMC members supported a July hike, and another employment and inflation cycle will arrive before the September decision.
For the next few weeks, the better posture is to treat September as a live two-way market and update probabilities as the evidence arrives.
Incoming evidence
Likely September repricing
Core PCE at or below 0.2%,
weak payrolls, and August core CPI at or below 0.2%
The probability of a hold
could rise toward 75%-85%.
Mixed data, with core
inflation around 0.2%-0.3%
A hold likely remains
favored in roughly the 55%-70% range.
Core PCE or CPI at or
above 0.3%, stronger employment, or a renewed energy shock
A 25-basis-point hike
could become the favorite.
Very weak employment
combined with soft inflation
A hold remains the base
case; a cut becomes a non-zero tail risk, but probably not the central
outcome.
The principal dates are July PCE on August 26, the August employment report on September 4, August PPI on September 10, August CPI on September 11, and the FOMC decision on September 16.
Which release is most likely to move this before September 16?
South Korean shipping companies SK Shipping Co. and H-Line Shipping Co. — both owned by private equity firm Hahn & Co. — will swap tankers and contracts to create one of the world’s largest operators of LNG carriers.
Will the SK Shipping–H-Line fleet swap close by the end of 2026?
YesResult
40.91%
NoResult
59.09%
88 Polls
EndedTBD
SK Shipping will receive 16 LNG vessels and their long-term contracts from H-Line in exchange for 12 tankers, their contracts and approximately $300 million in cash, the buyout firm said in a statement on Thursday.
The deal will turn SK into what Hahn & Co. described as the world’s third-largest operator of LNG carriers, while H-Line will become a leading tanker and bulk-shipping company in the region.
The swap, part of a years-long effort to reshape Korean shipping, also comes as months of conflict in the Persian Gulf upend the energy trade and create lucrative opportunities for shipowners, charterers and traders.
A large, consolidated fleet backed by long-term contracts can offer relatively predictable cash flows in an industry otherwise buffeted by sharp swings in freight rates. The swap will allow H-Line to benefit from “increased scale, operating efficiencies, and capital” at a time of geopolitical uncertainty, Hahn & Co. said.
Hapag-Lloyd’s H1 2026 results were mixed. The company returned to profit in Q2 as stronger demand and spot freight rates lifted transport volumes and average pricing, producing a clear recovery from a loss-making Q1.
Will Hapag-Lloyd transport more than 3.5mn TEU in Q3 2026? (3.481mn TEU in Q2 2026, up 3.5% yoy)
YesResult
47.46%
NoResult
52.54%
236 Polls
EndedTBD
Q2 revenue rose 10.8% yoy to $5.84bn, while EBITDA increased 1.1% to $829mn and EBIT declined 6.9% to $176mn. Net profit fell 72.9% to $83mn. The sequential improvement was much stronger: revenue rose 19% qoq, EBITDA increased 68%, and EBIT swung from a $157mn loss. However, the weak first quarter and substantial disruption costs left H1 EBITDA down 31.2% and EBIT at only $18mn. Hapag-Lloyd raised its FY2026 outlook following the Q2 recovery, but the wide range continues to reflect considerable uncertainty around freight rates, energy costs and the Middle East conflict.
Q2 2026 Group Key Figures
Liner Shipping
Transport Volume
3.5 M TEU
PY: 3.4 M TEU
Terminal & Infrastructure
Throughput
3.6 M TEU
PY: 3.3 M TEU
Revenue
USD 5.8 bn
PY: USD 5.3 bn
EBITDA
USD 0.8 bn
PY: USD 0.8 bn
EBIT
USD 0.2 bn
PY: USD 0.2 bn
Group Profit
USD 0.1 bn
PY: USD 0.3 bn
Free Cash Flow
USD 0.6 bn
PY: USD 0.2 bn
Net Debt
USD 2.0 bn
PY: USD 1.2 bn
Key Takeaways
Ocean was the main earnings driver, supported by both pricing and execution.Q2 marked a clear turnaround from a loss-making Q1. The most important development was not the modest yoy change in EBITDA, but the scale of the sequential recovery. Q2 revenue reached $5.84bn versus $4.92bn in Q1, while EBITDA rose to $829mn from $494mn. EBIT improved to $176mn from a $157mn loss, and the net result swung to an $83mn profit from a $256mn loss.
This shows that Hapag-Lloyd retained significant operating leverage when freight markets improved. Nevertheless, Q2 EBIT remained below the prior-year period even with substantially higher revenue, indicating that the rebound in commercial conditions did not fully reach the bottom line.
Revenue
[USD m]
+19%
5,272
4,918
5,840
Q2 2025
Q1 2026
Q2 2026
EBITDA
[USD m]
15.6%
10.0%
14.2%
+68%
820
494
829
Q2 2025
Q1 2026
Q2 2026
EBIT1[USD m]
3.6%
-3.2%
3.0%
189
-157
176
Q2 2025
Q1 2026
Q2 2026
Group Profit1[USD m]
3.3%
-3.2%
2.7%
306
-256
83
Q2 2025
Q1 2026
Q2 2026
Recovery of Hapag-Lloyd earnings in Q2 due to improved market conditions in the Liner Shipping business. Source: Hapag-Lloyd
Higher volumes and freight rates drove the recovery, but H1 pricing remained broadly flat. Q2 transport volume increased 3.5% yoy to 3.481mn TEU, while the average freight rate rose 8.9% to $1,475/TEU. Management attributed the improvement mainly to strong exports from Asia and better US demand.
The Gemini network also remained resilient, with schedule reliability returning to ~90% after disruption. The first-half picture was less pronounced: volume rose 1.5% to 6.684mn TEU and the average freight rate declined 0.4% to $1,406/TEU.
Network schedule reliability
Gemini Cooperation
Competitor Range
100%
90%
80%
70%
60%
50%
Feb- 25
Mar- 25
Apr- 25
May- 25
Jun- 25
Jul- 25
Aug- 25
Sep- 25
Oct- 25
Nov- 25
Dec- 25
Jan- 26
Feb- 26
Mar- 26
Apr- 26
May- 26
Jun- 26
Gemini reliability back at 90%. Source: SeaIntel
H1 revenue increased 1.6% in US dollars, although it fell 4.8% in euros because of currency translation. Q2 therefore represented a meaningful market improvement, but one quarter of stronger spot pricing does not yet establish a sustained change in the annual rate environment.
Middle East disruption absorbed much of the commercial improvement. The conflict generated ~ $600mn of additional cash costs, including ~ $400mn realized in Q2 and ~ $200mn associated with bunker inventory build-up.
Alternative routings, elevated fuel prices, storage expenses and higher hinterland transportation costs all contributed. H1 transport and terminal expenses increased 8.6% to $8.41bn, despite only 1.5% volume growth.
Raised guidance reflects stronger H2 conditions, while the range remains wide. On July 13, Hapag-Lloyd raised FY2026 EBITDA guidance to $2.7-3.7bn from $1.1-3.1bn and EBIT guidance to $0.1-1.1bn from -$1.5bn to $0.5bn.
The revision reflects the recent increase in spot freight rates and resilient demand, partly offset by energy costs and continuing operational disruption. Cash generation was materially stronger than net income, partly because depreciation is significant in this asset-heavy model and some Middle East-related cash outlays were reflected in bunker inventory. The wide $1bn guidance ranges show that management visibility remains limited.
The proposed $4.2bn acquisition of ZIM is an additional strategic variable: ZIM shareholders have approved the transaction, but regulatory approvals remain outstanding, and Hapag-Lloyd’s guidance excludes any consolidation effects.
Timeline
16 February
Signing
30 April
ZIM Extraordinary
General Meeting
Golden
Share approval
Discussions with relevant
stakeholders and key decision
makers ongoing
Antitrust clearance
All filings submitted, first approvals received
end of 2026
C
Closing
Merger agreement approved by ZIM shareholders; regulatory approvals are still pending amid mounting obstacles. Source: Hapag-Lloyd
Key Debates
Can the Q2 freight-rate recovery persist into Q4 2026?
How much of the ~$600mn Middle East cost impact will prove temporary?
Can cost savings restore Liner Shipping margins if freight rates normalize?
Will Terminal & Infrastructure become large enough to reduce group earnings volatility?
Maersk delivered a strong Q2 2026, as higher Ocean freight rates, volume growth and lower unit costs drove a sharp recovery in earnings. Revenue rose 20.0% yoy to $15.76bn, while reported EBITDA increased 30.2% to $2.99bn. Reported EBIT climbed 85.9% to $1.57bn, taking the EBIT margin to 10.0%, and net profit more than doubled to $1.31bn.
USD
P&L
Revenue
15.8bn
(13.1bn)
EBITDA
3.0bn
(2.3bn)
EBIT
1.6bn
(0.8bn)
Profit for period
1.3bn
(0.6bn)
Cash and returns
FCF
0.5bn
(-0.4bn)
Cash and deposits
18.5bn
(19.9bn)
NIBD
-1.5bn
(-2.5bn)
ROIC
(LTM)
5.0%
(13.7%)
Note: Prior corresponding period figures in brackets. Source: Maersk
The most important incremental information was another substantial increase in Maersk’s FY2026 guidance, just weeks after the company upgraded its outlook in late June. The new guidance suggests that management expects the stronger rate environment and operating performance to remain supportive through H2, although the durability of current freight rates remains the central debate.
Will Maersk’s average Ocean freight rate remain above $2,700/FFE in Q3 2026? (Q2 2026 Avg: $2,746/FFE)
YesResult
61.64%
NoResult
38.36%
232 Polls
EndedTBD
Key Takeaways
Ocean was the main earnings driver, supported by both pricing and execution. Ocean revenue reached $10.53bn, with EBITDA of $2.04bn and EBIT of $940mn. Loaded volumes increased 4.1% yoy to 3.36mn FFE, while the average freight rate rose 21.6% to $2,746/FFE. At the same time, unit costs declined 2.2% to $2,355/FFE. The combination of higher rates, growing volumes and lower costs produced significant operating leverage.
Q2 represented a clear acceleration from a weak start to the year. H1 revenue increased 8.6% yoy to $28.73bn, but EBITDA declined 5.3% to $4.74bn and EBIT fell 8.9% to $1.91bn. Net profit decreased 23.5% to $1.41bn. The contrast between the strong Q2 performance and declining H1 earnings shows how quickly Maersk’s profitability improved as freight rates recovered.
Logistics continued to improve, although margins remain modest. Logistics revenue reached $4.22bn, with EBITDA of $470mn and EBIT of $220mn. The EBIT margin increased 50bps qoq to 5.1%, supported by Landside services, air freight, project logistics and a better contract mix. Further margin expansion would reduce the group’s reliance on volatile Ocean earnings.
Terminals remained a stable source of profit. Revenue reached $1.45bn, EBITDA was $520mn and EBIT was $460mn, while volumes grew 2.2% yoy. The strong profitability on relatively modest volume growth highlights the segment’s role as a more predictable earnings contributor.
Guidance was raised by an unusually wide margin. Maersk now expects FY2026 underlying EBITDA of $10.5–12.5bn, up from $8–10bn, and underlying EBIT of $4.5–6.5bn, up from $2–4bn. The midpoint of both ranges increased by $2.5bn. Free-cash-flow guidance improved to above zero from at least negative $1.5bn. As the global container-market growth assumption remained unchanged at ~4%, the upgrade appears to reflect stronger rates, business mix and execution rather than a higher industry volume forecast.
Key Debates
Can elevated Ocean rates persist beyond the peak shipping season?
How much demand was brought forward?
Can free cash flow remain positive despite heavy investment?
Coherent delivered a broad Q4 FY2026 beat, with revenue, margins and earnings all improving. The more important update was management’s roadmap for another leg of AI-related growth: InP capacity is expanding rapidly, while CPO, PhotonLink, Multi-Rail and thermal-management products are expected to begin contributing over the next several quarters. The shares nevertheless fell after hours as strong execution met an already elevated expectations bar.
Will Coherent’s non-GAAP gross margin > 42% in FY2027 Q1?
YesResult
59.56%
NoResult
40.44%
225 Polls
EndedTBD
Key Takeaways
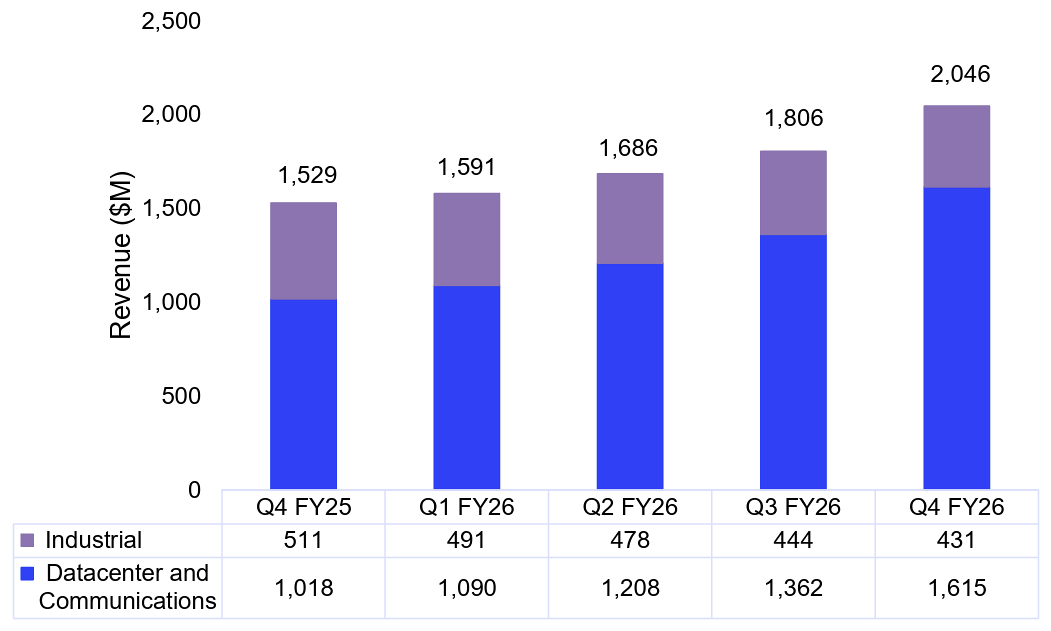
· Results and guidance were stronger than expected. Q4 revenue reached $2.05bn, up 34% yoy and 13% qoq, while non-GAAP EPS rose 74% yoy to $1.74. Non-GAAP gross margin increased 215bps yoy to 40.2%, and operating margin reached 21.8%. Q1 FY2027 guidance calls for revenue of $2.2bn–$2.4bn and non-GAAP EPS of $1.85–$2.05, both above the consensus figures cited in the supplied market review.
· AI optical connectivity is driving an increasingly concentrated growth profile. Data Center & Communications revenue rose 59% yoy to $1.62bn and represented 79% of sales. Industrial revenue fell 16% on a reported basis to $431m. The quarterly trend shows that all net revenue growth over the past year came from the data-center and communications segment, increasing Coherent’s exposure to AI infrastructure spending and execution at major customers.
Quarterly revenue by segment ($m). Source: Coherent investor presentation
· InP capacity is still the central constraint. Internal InP output doubled yoy in Q4, while 6-inch laser output rose ~80%. Management expects internal InP capacity to double by calendar year-end and more than double again by end-2027. The 6-inch line produces CW lasers, EMLs and photodiodes, with management citing better yields and economics than 3-inch production. Backlog extends through FY2027, customer forecasts reach 2028, and many LTAs run three to ten years with pricing and minimum-volume provisions.
· Several new platforms now have specific revenue windows. CPO-related revenue and the PhotonLink integrated optical platform are expected to start increasing in Q2 FY2027. Multi-Rail should begin contributing in the first half, while Thermadite thermal-management revenue is expected in the second half. OCS revenue is already growing, and management raised its estimated 2030 addressable market to more than $4bn. These remain management timelines rather than realized sales.
Source: Coherent investor presentation
· Earnings growth was strong, but cash conversion weakened. FY2026 non-GAAP EPS increased 59% as gross margin and operating leverage improved. However, operating cash flow fell to $80m from $634m, reflecting the working-capital and investment demands of the capacity build. Coherent ended the year with about $2.0bn of cash and short-term investments, while long-term debt declined to $3.21bn, limiting immediate liquidity concerns.
Market Reaction
Coherent rose ~2.8% in regular trading before the release, then fell ~3.5% initially and more than 6% at one point after hours, according to the supplied market review. Lumentum had rallied about 8% after its own stronger-than-expected report one day earlier, creating a demanding peer benchmark.
Coherent had also gained more than 200% over the prior 12 months and traded at roughly 42x forward earnings versus an industry average near 22x in that review. The decline therefore may reflect relative surprise, valuation and the modest near-term margin step-up rather than weaker reported demand.
Key Debates
· Can non-GAAP gross margin exceed 42% by Q4 FY2027?
· Will CPO and PhotonLink generate meaningful revenue in Q2 FY2027?
· Can inventory and capacity investment translate into stronger operating cash flow?
· Will Industrial return to yoy growth within the next two quarters?
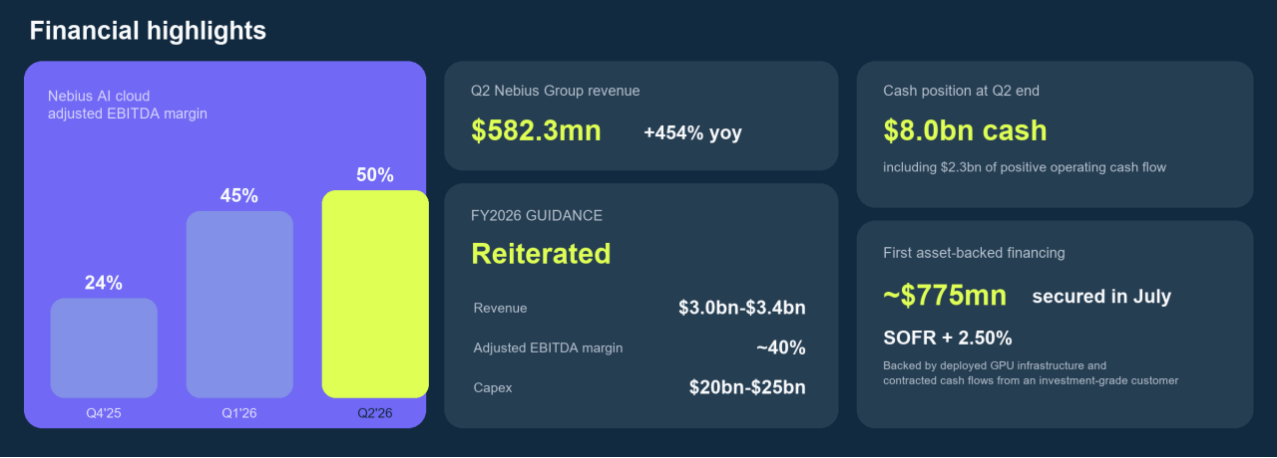
Nebius delivered a clear Q2 beat: revenue reached $582.3mn, up 454% yoy and 46% qoq, versus roughly $510mn-$534mn expected. Nebius AI contributed $574.9mn, while group adjusted EBITDA reached $236.2mn and operating loss narrowed to $175.9mn.
Management said every capacity tranche brought online can be sold, making deployment speed the near-term constraint. The shares rose more than 16% pre-market as the results combined a revenue beat, better profitability and confidence in the 2026 outlook.
Source: Nebius Q2 FY2026 earnings release. Adjusted EBITDA is non-GAAP.
Will Nebius AI Cloud maintain an adjusted EBITDA margin of at least 50% in Q3 FY2026?
YesResult
58.68%
NoResult
41.32%
167 Polls
EndedTBD
Key Takeaways
Financial growth is exceptional, but cluster profitability is not yet corporate profitability. Nebius AI supplied $574.9mn, or 98.7% of group revenue, and its June revenue annualized to $3.0bn, 58% above March. AI adjusted EBITDA margin rose to 49.7% from 45% in Q1 and 24% in Q4 2025 as cost of revenue and SG&A fell sharply as a percentage of sales.
That validates operating leverage in commissioned clusters. It does not yet establish full corporate profitability: the group still reported a $175.9mn GAAP operating loss and a $190.4mn net loss from continuing operations after depreciation, share-based compensation and financing costs.
Three transaction models form the commercial core.
Nebius is managing capacity as a portfolio rather than selling every future MW under one contract type:
3-6 month contracts and auctions monetize urgent, time-sensitive demand at a premium. The first Blackwell auction cleared 15% above the company's previous peak and 20% above standard Blackwell pricing.
1-3 year mid-term contracts remain the core model for leading AI companies. Four Q2 flagship deals averaged more than $1bn of total contract value, with annual contract value of $20mn-$25mn per MW.
Long-term agreements with investment-grade customers trade some pricing optionality for visibility and financing capacity; one contract supported the $775mn asset-backed facility priced at SOFR + 2.50%.
Why it matters: The mix balances utilization, pricing and funding. Reserving capacity for short-duration demand can raise revenue per MW, but also increases renewal and idle-capacity risk.
Related read: Nebius is not the only AI cloud provider facing the scale-to-returns test. This CoreWeave deep dive examines operating leverage, financing costs and the lifetime economics of older GPUs.
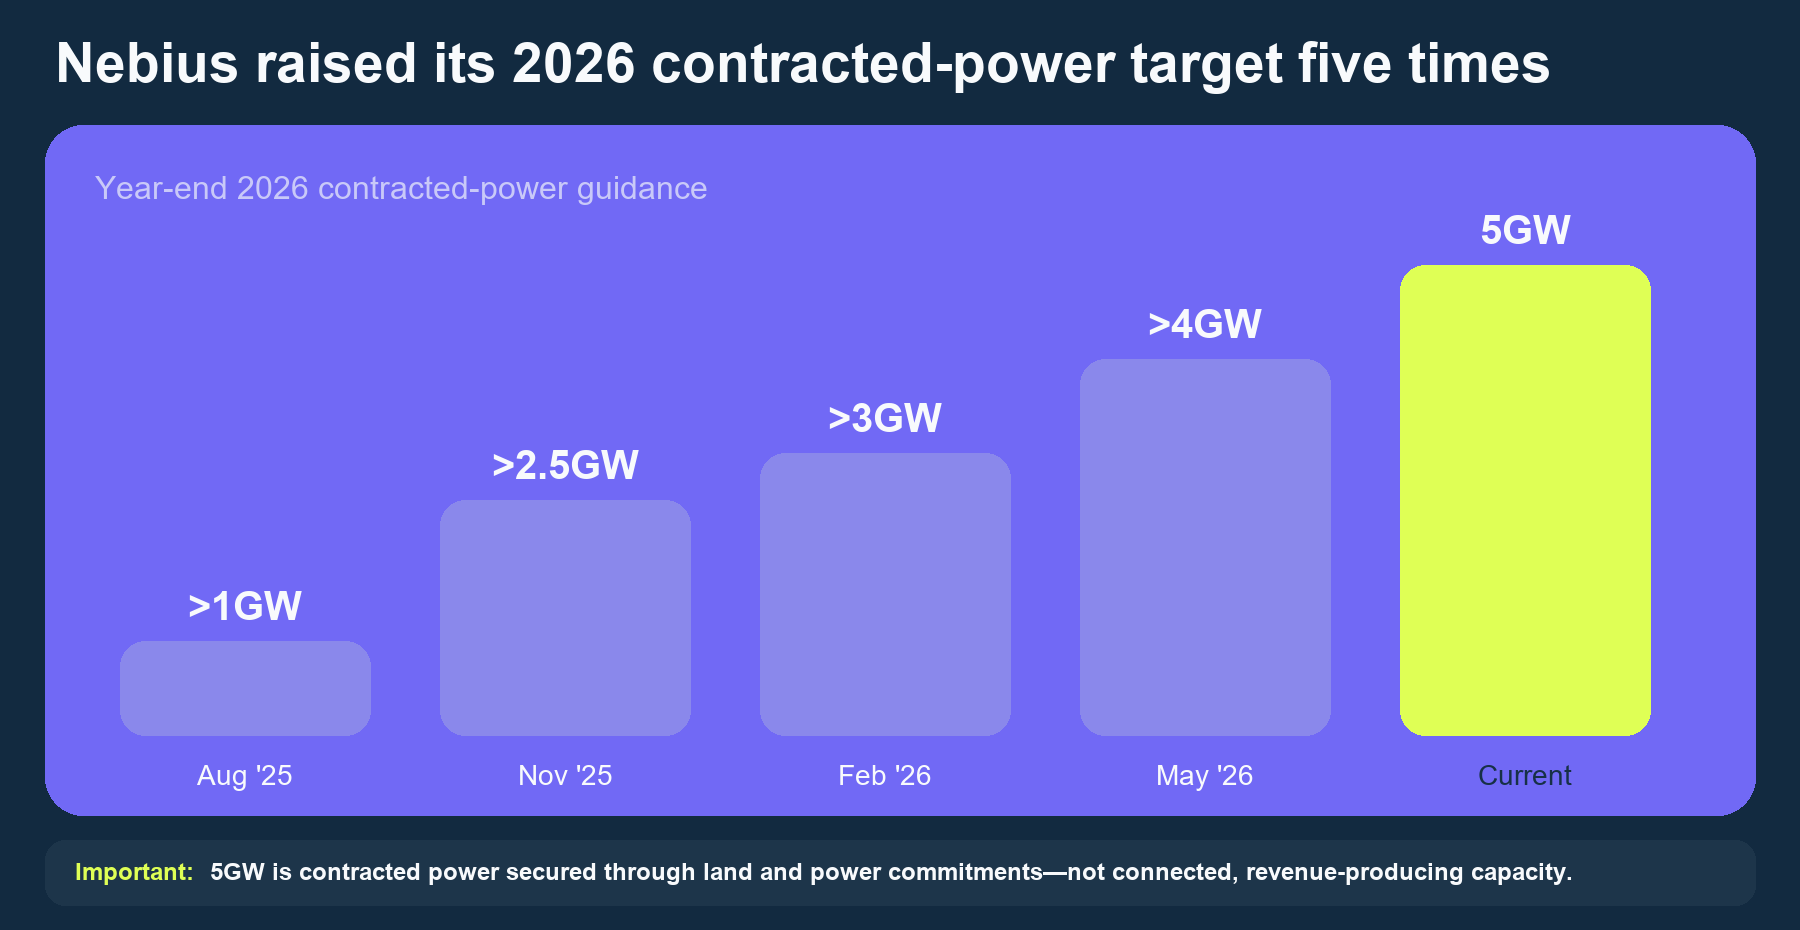
Power access is both the bottleneck and a potential competitive asset. Nebius raised its year-end contracted-power target to 5GW from just over 1GW a year earlier, but connected-power guidance remains 0.8GW-1.0GW - only 16%-20% of the contracted figure.
Source: Nebius
The gap is analytically important: contracted land and power secure a future pipeline, while revenue requires energized sites, delivered GPUs and networks, tested clusters and customer acceptance. Behind-the-meter generation and geographic flexibility may reduce dependence on individual grids, but the key KPI is how quickly and economically signed power becomes billable capacity.
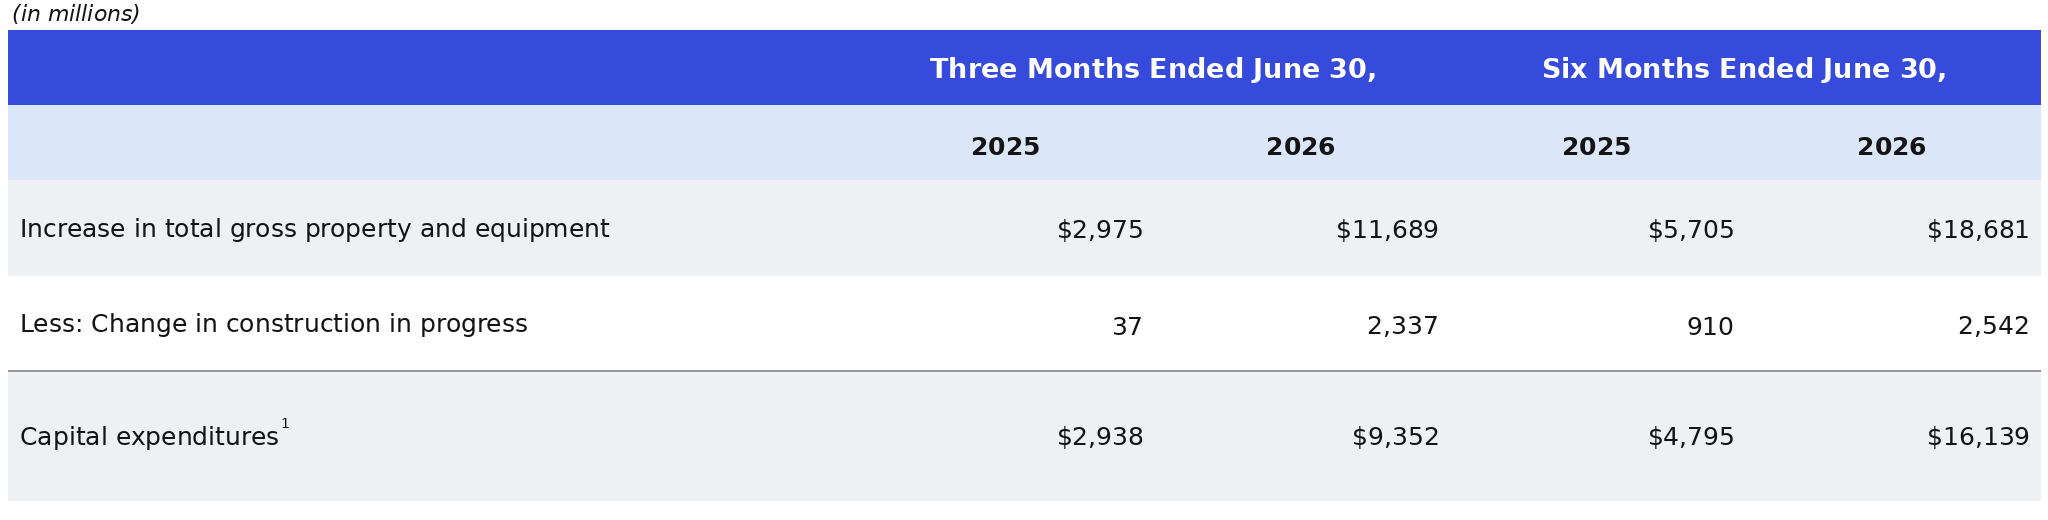
Capital innovation improves funding efficiency, but not the underlying capital intensity. In July, Nebius secured its first ~$775mn asset-backed financing at SOFR plus 2.50%, backed by deployed GPUs and contracted cash flows from an investment-grade customer. Together with prepayments covering an estimated 50%–60% of related capex and its asset-light partnership model, this creates a potentially repeatable funding framework that reduces reliance on corporate cash and equity. However, Q2 capex of ~$5.7bn—almost 10 times quarterly revenue—shows that returns still depend on utilization, financing costs, depreciation and GPU residual value.
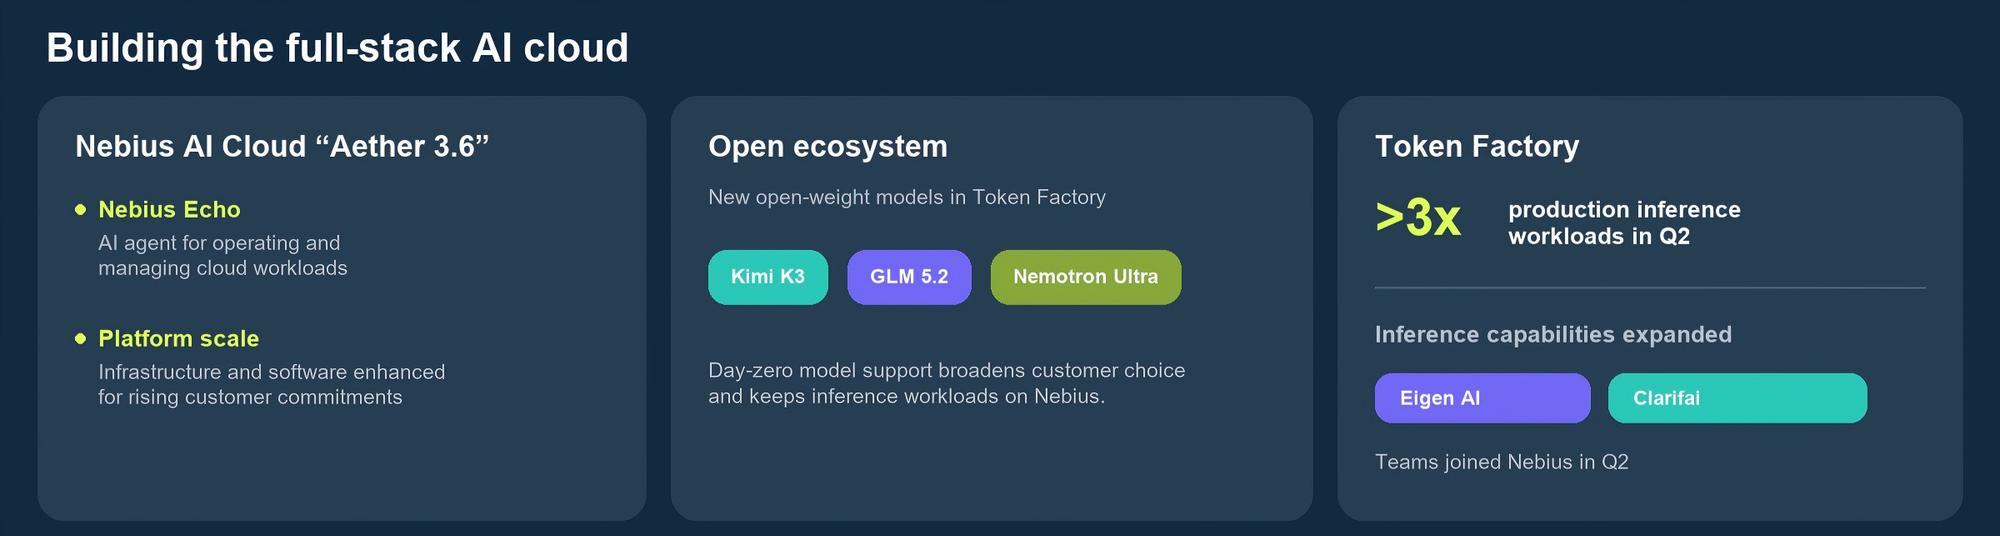
The open ecosystem and Token Factory raise the potential revenue density of the platform. Token Factory inference workloads more than tripled in Q2 as Nebius expanded day-zero support for open-weight models, while the platform added open-weight models including Kimi K3, GLM 5.2 and Nemotron Ultra.
Source: Nebius Q2 FY2026 shareholder letter
The integration of Eigen AI and Clarifai adds inference-optimization capabilities, while Aether 3.6 and Nebius Echo broaden workload management as customer volumes scale. These developments may increase platform usage, compute utilization and revenue per unit of infrastructure.
Market Reaction
Nebius shares rose more than 16% pre-market as Q2 results improved both the scale and quality of its growth outlook.
Revenue beat expectations, while Nebius AI delivered an adjusted EBITDA margin of about 50%, suggesting new capacity is translating into strong operating leverage. Forward visibility also improved after the company signed four major AI cloud contracts with average total contract value above $1bn and annual contract value of $20mn–$25mn per MW.
Pricing remained strong: Nebius’s first Blackwell auction cleared 15% above its previous peak price and 20% above standard pricing, supporting the value of keeping some capacity available for short-duration demand.
Financing concerns also eased after a ~$775mn asset-backed facility priced at SOFR +2.50%, alongside customer prepayments, expanded funding options beyond cash and equity.
Overall, the rally reflected stronger revenue, margins, pricing and financing flexibility, though depreciation, interest costs, dilution and future GPU capex remain key risks.
Key Debates
Can commissioned capacity keep selling at current prices?
Can 5GW of contracted power become connected capacity on schedule?
Do the three transaction models produce comparable lifetime returns?
Does financing innovation improve returns or mainly accelerate deployment?
When will Token Factory become financially measurable?
Taiwan’s latest disclosures point to sustained demand across three layers of the AI infrastructure stack: TSMC’s and UMC’s July 2026 revenue updates, and Hon Hai’s second-quarter operating results.
Together, the companies span distinct segments of Taiwan’s technology supply chain — advanced semiconductor manufacturing, mature and specialty foundry services, and AI server-system production. While all three are benefiting from the broader AI infrastructure buildout, the underlying growth drivers and the implications for margins differ significantly across companies.
Company
Latest revenue
MoM
YoY
AI supply-chain role
TSMC
US$14.61bn (Jul)
+5.6%
+44.7%
Advanced nodes / AI chips
UMC
US$745.1mn (Jul)
+3.1%
+19.0%
Mature and peripheral chips
Hon Hai
US$29.58bn (Jul)
+15.18%
+54.19%
AI servers and rack systems
TSMC: advanced manufacturing remains the primary growth engine
TSMC reported July revenue of approximately US$14.61bn, up 5.6% MoM and 44.7% YoY. Revenue for the first seven months reached approximately US$89.75bn, an increase of 37.0% YoY.
July was about 9% above the Q2 monthly average, indicating that third-quarter growth was not dependent solely on a late-quarter shipment increase. Leading-edge nodes used in AI accelerators and high-performance computing, together with advanced packaging, remained the main drivers.
In Q2, 7nm and more advanced processes represented 77% of wafer revenue, including 30% from 3nm and an initial 3% from 2nm. Management expects a steep 2nm ramp during Q3 and guided to quarterly revenue of US$44.6-45.8 billion. AI accelerators, custom processors and high-performance computing are supporting demand for both leading-edge wafers and advanced packaging.
Will TSMC's Aug 2026 revenue exceed that of July?
YesResult
0.00%
NoResult
0.00%
0 Polls
EndedTBD
UMC: mature-node utilization and product mix continue to improve
UMC reported July revenue of approximately US$745.1mn, up 3.1% MoM and 19.0% YoY. Seven-month revenue was approximately US$4.80bn, representing 12.4% YoY growth.
The improvement is not equivalent to TSMC's direct exposure to advanced AI processors. UMC supplies connectivity, display, power-management, consumer and networking applications. Q2 utilization rose to 85% from 79%, while 22/28nm increased to 37% of revenue and gross margin reached 32.5%.
July's performance is therefore consistent with higher utilization, a better product mix and more stable pricing, with AI infrastructure providing an indirect rather than exclusive demand channel.
Hon Hai: Q2 results underscore growth in AI server systems
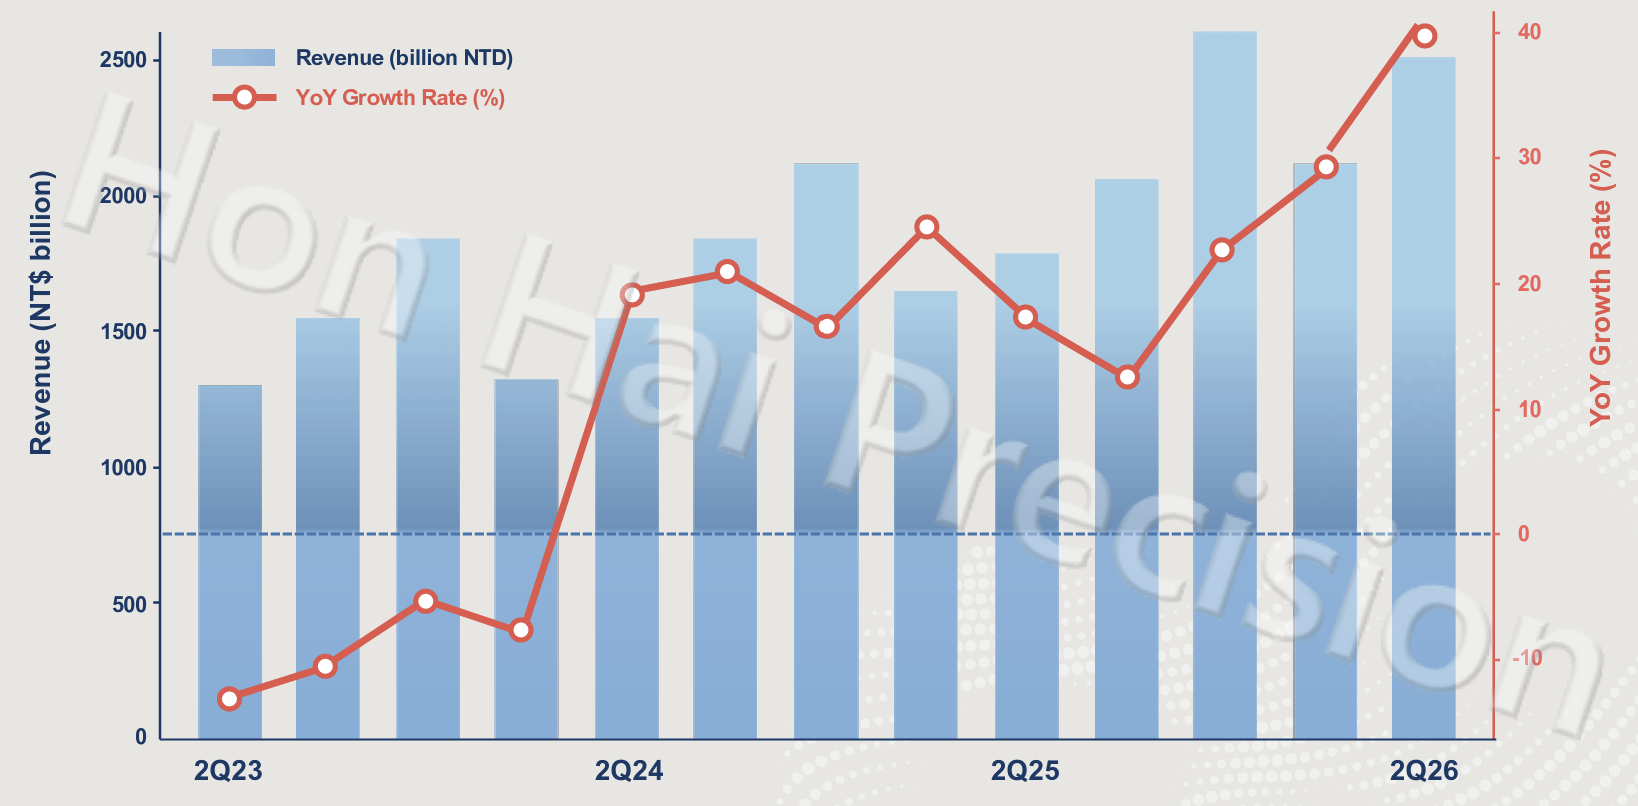
Hon Hai reported July revenue of approximately US$29.58bn, up 15.18% MoM and 54.19% YoY. The sharp sequential rise shows momentum continuing after an already strong Q2, when revenue reached approximately US$78.54bn, increasing 18.0% QoQ and 39.8% YoY.
AI infrastructure is driving revenue growth. Source: Hon Hai
The figures show AI demand reaching the system-production layer as Hon Hai expands from server assembly into integrated racks incorporating computing, networking, cooling, power and interconnect systems. Traditional second-half ICT seasonality also supported the July acceleration.
Will Hon Hai’s August revenue exceed July’s US$29.58bn?
YesResult
50.00%
NoResult
50.00%
2 Polls
EndedTBD
Cloud and networking products were the main growth driver, supported by AI servers and rack-scale systems. Company disclosures indicated that the segment accounted for close to half of group revenue, while industry research pointed to higher shipments of GPU-based racks and custom-ASIC systems for large cloud customers. Hon Hai is also extending its participation into networking, power, cooling and rack integration.
Revenue growth should nevertheless be considered separately from profitability. High-value accelerators can increase reported server revenue substantially, while component-procurement and consignment arrangements affect both revenue recognition and margins. Gross profit, operating margin and the mix between GPU and custom-ASIC programmes therefore remain important indicators of earnings conversion.
Operating read-through: the same AI cycle, different economics
The data support a three-layer transmission of AI capital expenditure through Taiwan: advanced chips at TSMC, peripheral and mature-node content at UMC, and server-system integration at Hon Hai.
The strongest combination of growth and profit conversion is currently at the advanced-chip layer. UMC provides evidence that demand is broadening but remains more exposed to the conventional semiconductor cycle. Hon Hai demonstrates the scale of AI deployment, while the central question is whether exceptional revenue growth produces durable margin and cash-flow improvement.
CoreWeave's Q2 was less about another quarter of exceptional AI demand than about the first credible signs that demand is converting into operating leverage. Revenue rose 112% yoy to $2.575bn, near the top of guidance and slightly above the ~$2.56bn consensus, while adjusted operating income of $128mn exceeded management's $30mn-$90mn range and lifted margin to 5% from 1% in Q1.
Will CoreWeave report >7% adjusted operating margin in 3Q2026?
YesResult
0.00%
NoResult
0.00%
0 Polls
EndedTBD
The inflection matters because it arrived before a roughly 25% July price increase cited on the call. But it is not yet proof of attractive corporate economics: adjusted operating margin remained far below 16% a year earlier, net loss was $626mn and quarterly capex reached $9.35bn.
The central question is no longer whether CoreWeave can sell scarce AI capacity; it is whether each new cluster can earn enough over its life to outrun depreciation, interest and technological obsolescence.
TL;DR: Key takeaways
The quarter strengthens the operating-leverage case, but does not complete it. Adjusted operating income rose by $107mn qoq on $497mn of incremental revenue, suggesting that already-built infrastructure is absorbing fixed costs more effectively as utilization increases. Q3 adjusted operating-income guide of $200mn-$260mn and low-double-digit Q4 margin target imply that this conversion should accelerate.
The caveat is the yoy comparison: adjusted operating income fell 36% and adjusted EBITDA margin slipped to 59% from 62%, reflecting depreciation and commissioning costs from the buildout. CoreWeave has shown a sequential turn, not yet a normalized margin.
Pricing and product mix provide a plausible route to the Q4 target.
Management said new contracts carry contribution margins 5-10 percentage points above those signed in recent quarters, reflecting pricing, newer systems and more storage, CPU, networking and software content.
Managed inference ARR increased from about $1mn at launch to more than $100mn, with at least $250mn targeted by year-end; non-GPU ARR exceeded $400mn.
These services can broaden the customer funnel and raise revenue per cluster, but remain small beside the core infrastructure business and are management-reported operating indicators rather than GAAP revenue categories.
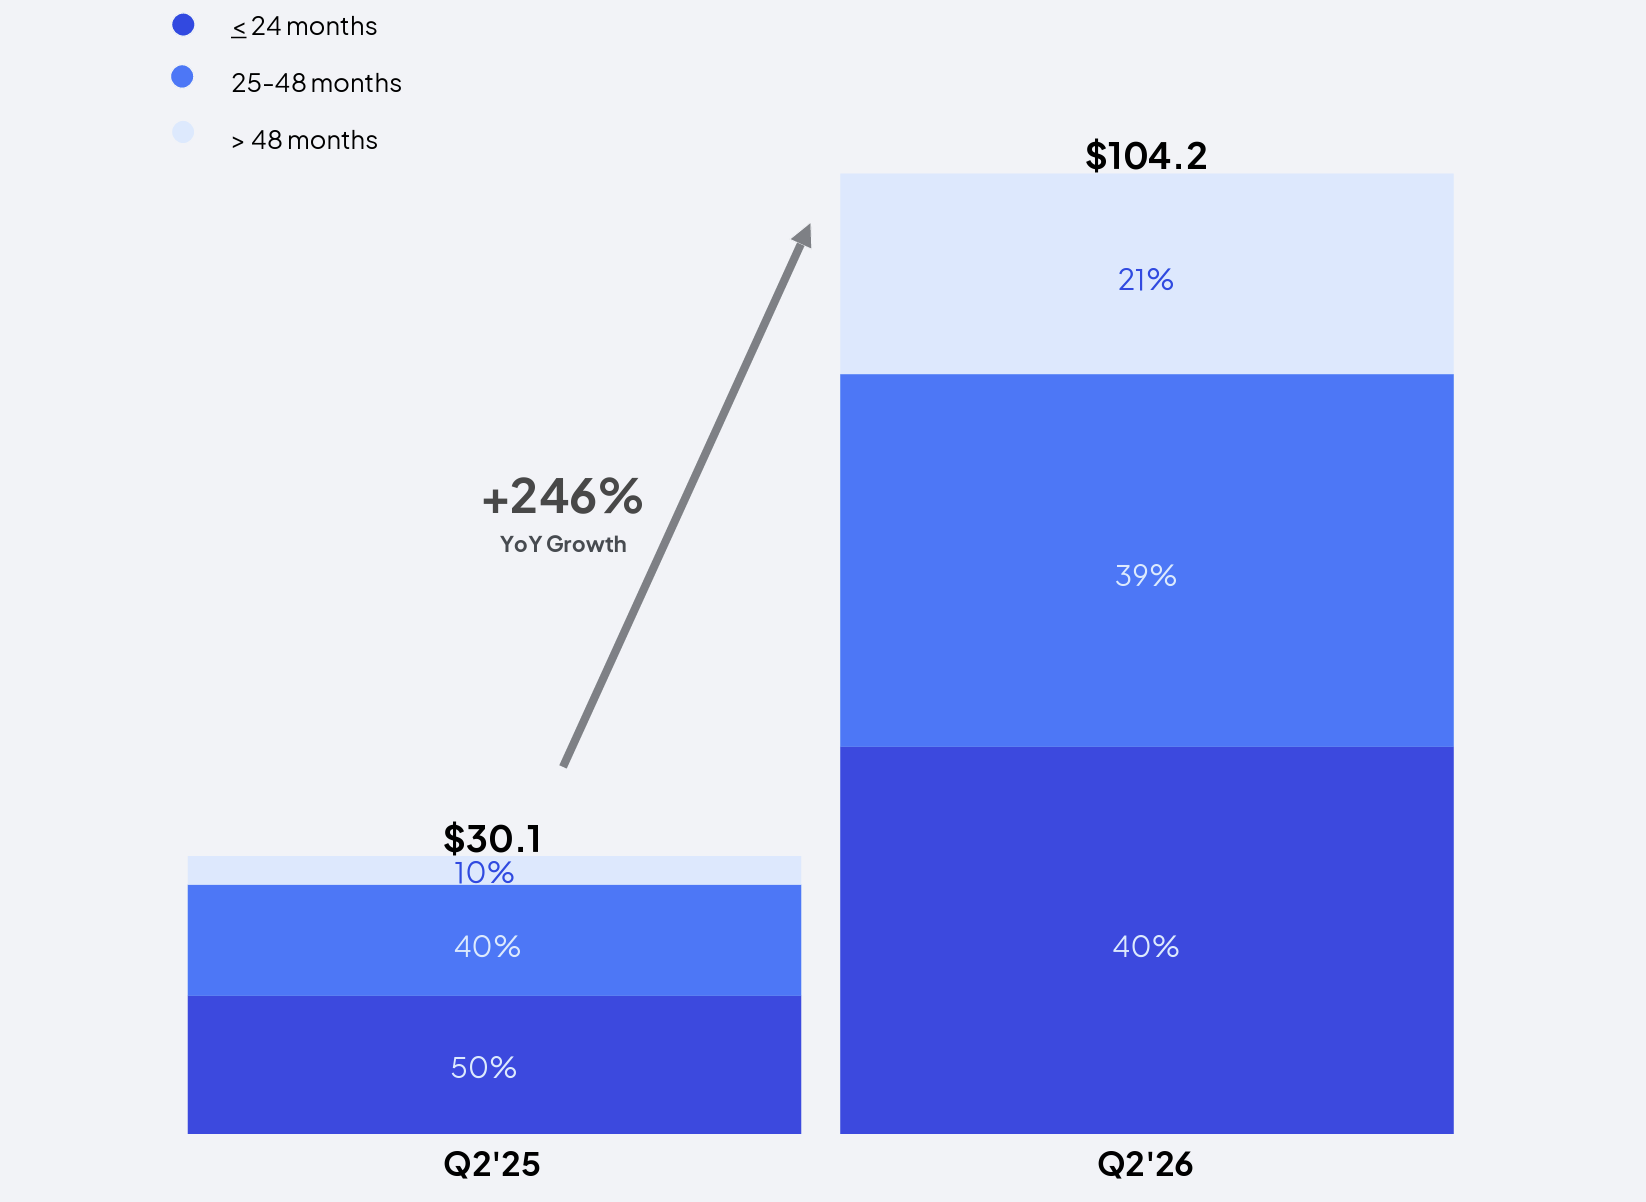
Backlog is becoming an execution schedule rather than a demand indicator. The $104.2bn balance was up 246% yoy and was followed by more than $25bn of early-Q3 commitments, leaving little doubt about customer appetite. What matters now is conversion: 40% is expected within 24 months, and recognition depends on delivery and service availability.
CoreWeave's 1.5 GW of active power and 4.2 GW contracted after quarter-end support future scale, but also expose the model to permitting, construction and supply-chain timing. Backlog has value only when powered capacity reaches customers at the underwritten return.
Q2 FY2026 Revenue Backlog. Source: CoreWeave
The A100 renewal is the call's most important evidence - and its easiest point to overstate. A customer extended use of the 2020-era GPU through 2029 at what management called attractive pricing. If the initial contract has repaid the associated debt, a second term could materially raise lifetime returns without another GPU purchase.
That suggests obsolescence may be slower than feared during a supply-constrained cycle. It does not make old hardware costless or appreciating: power, space and maintenance remain, and one renewal cannot establish fleet-wide residual value.
Financing innovation widens the market, while increasing the importance of discipline. Management said DDTL 5.5 can finance shorter-duration contracts preferred by enterprises, potentially opening a 2-3 year market that previously did not fit five-year asset-backed structures. Shorter contracts may command higher pricing, but leave more renewal risk. With FY2026 capex raised to $35bn-$39bn and interest expense already $640mn in Q2, cheaper or more flexible debt helps only if contract-level returns remain above the cost of capital.
Source: CoreWeave
Key debates
Will $104.2bn of backlog convert on schedule and at attractive returns?
Is the A100 renewal representative of the wider fleet?
Can financing costs fall faster than the asset base expands?
Singapore state investor Temasek has decided to invest directly in Samsung Electronics and SK Hynix, marking what would be its first investment in South Korea’s stock market, according to an exclusive report from Asia Economy on Wednesday.
Will Temasek disclose an investment in both Samsung Electronics and SK Hynix by the end of 2026?
YesResult
0.00%
NoResult
0.00%
0 Polls
EndedTBD
Temasek has recently been in contact with the South Korean government as it assesses the timing of the investments, the report said, citing relevant government agencies and market sources. Rather than allocating capital through an external asset manager, Temasek is expected to make the investments directly through its internal investment team.
The move would represent a significant new bet on Korea’s semiconductor sector. Temasek reportedly views memory semiconductors as one of the most undervalued parts of the AI value chain, even after the sharp rally in Samsung Electronics and SK Hynix shares.
The investment would also fit into Temasek’s broader push into artificial intelligence. The Singapore investor has been increasing exposure across semiconductors, data centers, cloud infrastructure, AI model developers and software infrastructure, and reportedly aims to raise AI-related investments from around 6% of its portfolio to as much as 15% over the next five years.
Temasek already holds stakes in major semiconductor companies including Nvidia, TSMC and ASML, according to its latest U.S. regulatory filings, and is also an investor in OpenAI and Anthropic.
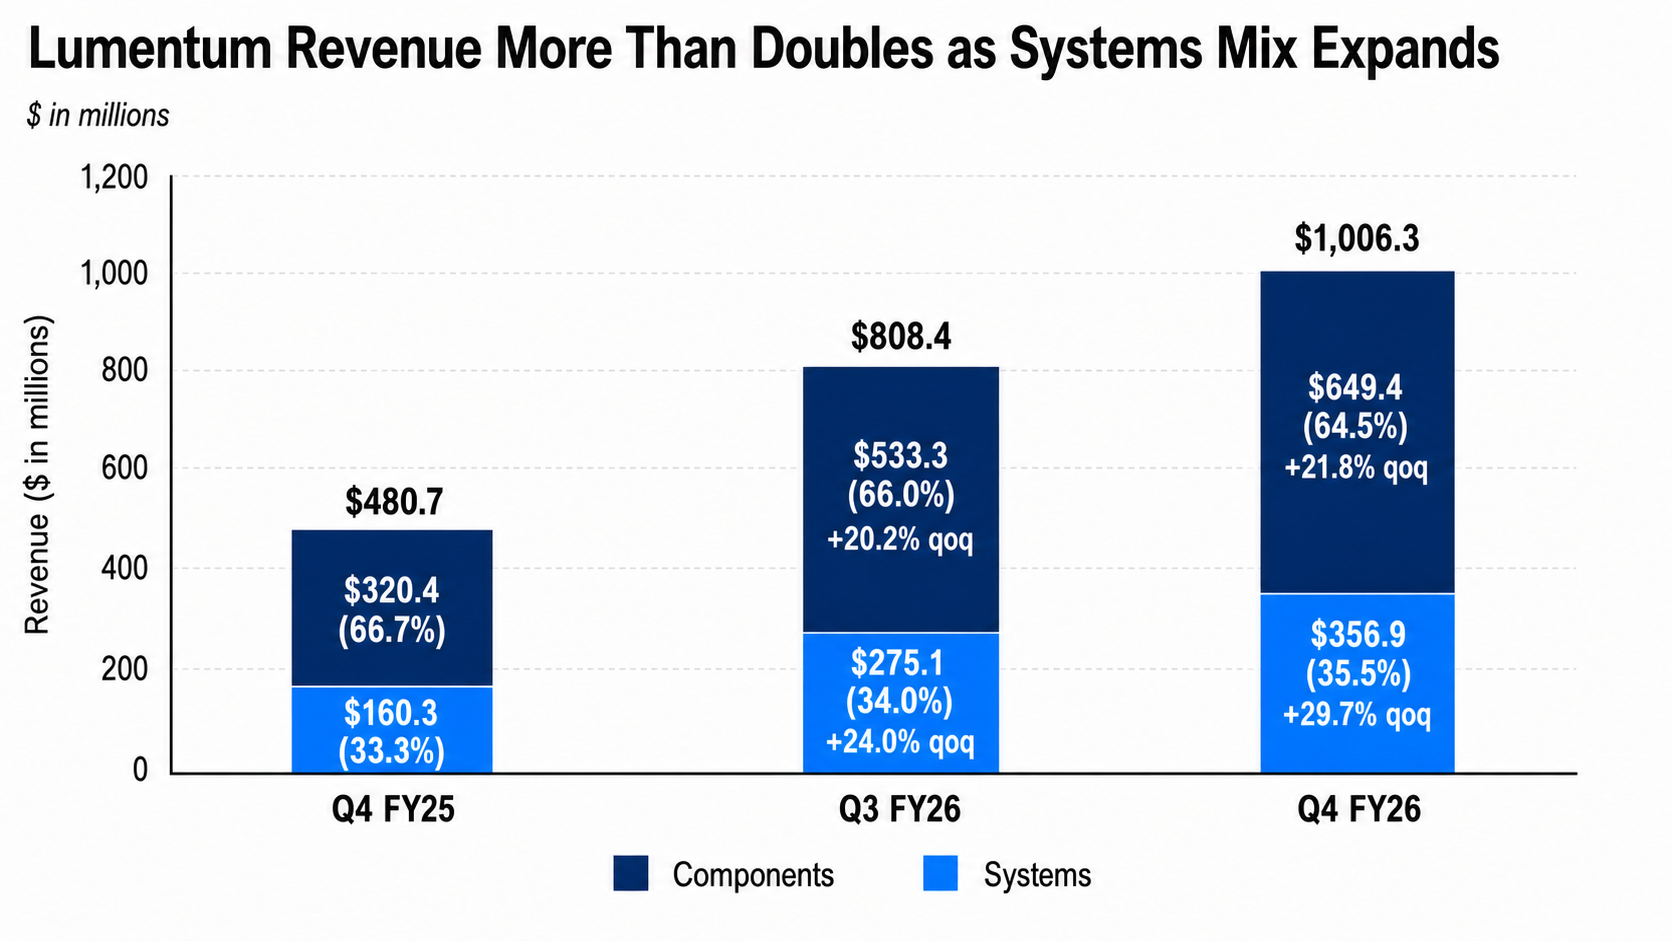
Lumentum delivered a broad Q4 FY2026 beat and issued Q1 guidance substantially above expectations, as AI-driven data-center demand lifted both optical components and systems revenue. Q4 revenue rose 109% yoy and 25% qoq to $1.01bn, ahead of consensus of ~$985mn, while non-GAAP EPS of $3.23 exceeded the $2.95 estimate.
Will Lumentum achieve Q1 FY2027 revenue above $1.25bn?
YesResult
0.00%
NoResult
0.00%
0 Polls
EndedTBD
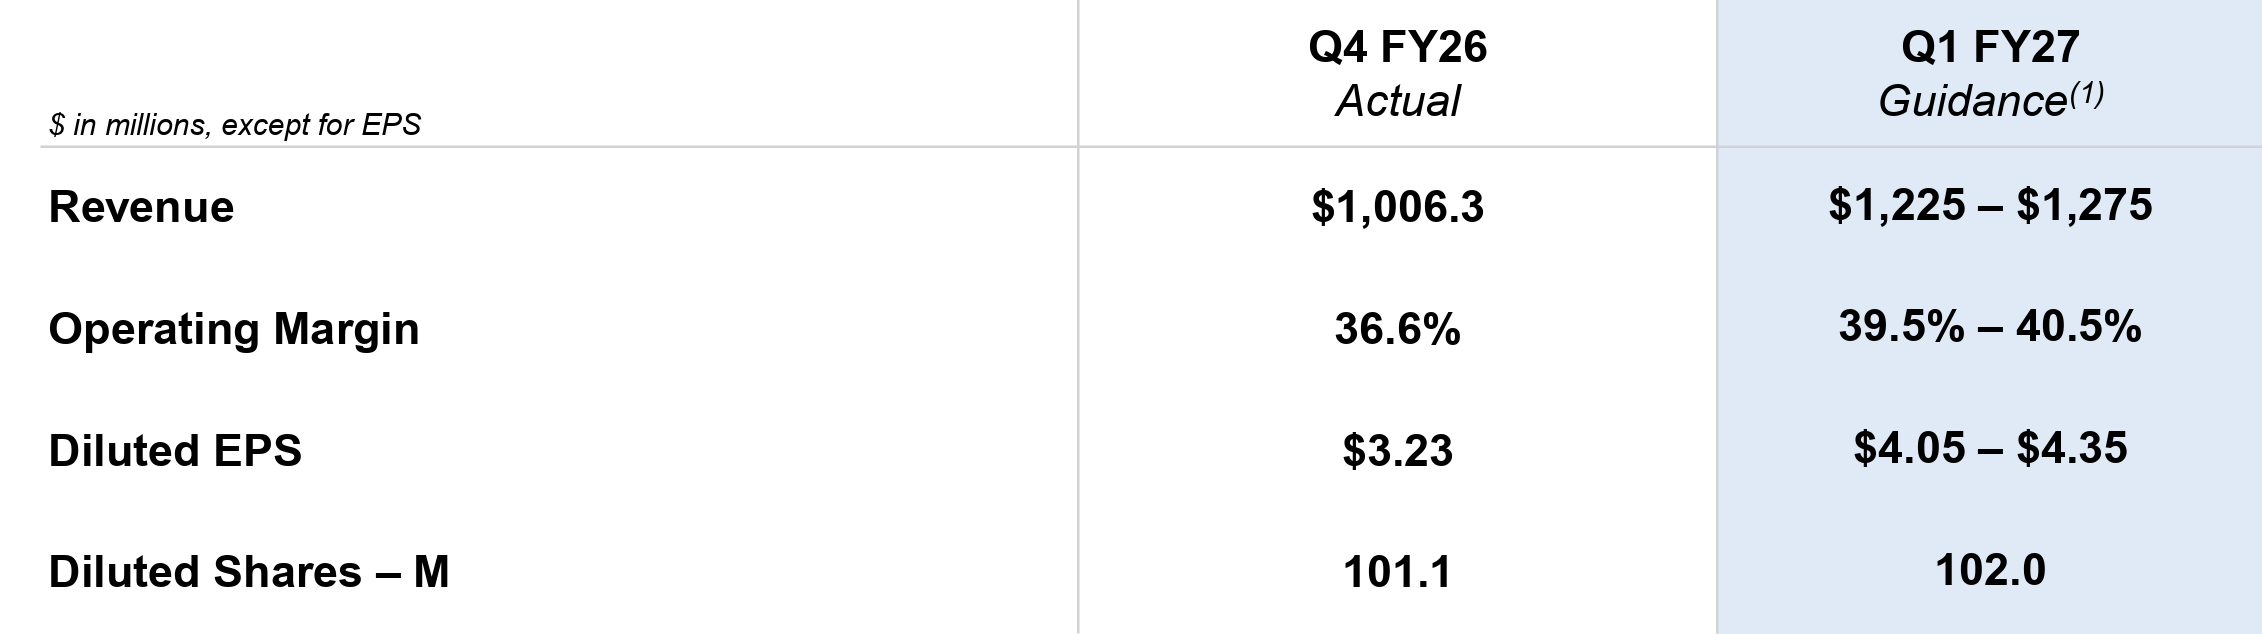
The headline GAAP net loss of $7.2bn primarily reflected a ~$7.8bn non-cash loss related to the conversion of convertible notes, rather than a deterioration in operating performance. The more consequential incremental information was management’s Q1 outlook: revenue guidance of $1.225bn-$1.275bn was well above consensus of ~$1.16bn, while the non-GAAP operating-margin outlook reached 39.5%-40.5%.
TL; DR: Key Takeaways
Revenue growth broadened across both reporting segments. Components revenue increased 103% yoy to $649mn, above consensus of ~$637mn, while systems revenue rose 123% to $357mn, also exceeding expectations. The faster systems growth suggests demand is extending beyond individual optical components toward more integrated connectivity products.
Source: Lumentum
Margins expanded faster than revenue. Non-GAAP gross margin reached 50.4%, versus 37.8% a year earlier and consensus of 48.8%. Non-GAAP operating margin rose to 36.6% from 15.0%, supporting non-GAAP net income of $326mn, up 416% yoy. The improvement may reflect a richer AI-related product mix, stronger utilization and operating leverage.
Q1 guidance reached the company’s target model more than one quarter ahead of schedule. Revenue guidance of $1.225bn-$1.275bn was substantially above consensus of ~$1.16bn. The $1.25bn midpoint implies ~24% qoq growth, while non-GAAP EPS guidance of $4.05-$4.35 exceeded expectations of ~$3.63. The 40% non-GAAP operating-margin midpoint also represents a further ~340 bps sequential expansion.
Source: Lumentum
The $7.2bn GAAP loss was driven by a non-cash debt-conversion charge. The loss was mainly caused by the difference between the carrying value of convertible debt and the fair value of equity delivered in its conversion. It did not represent a comparable cash outflow or operating loss. However, the transaction may reduce future interest expense while increasing share count and EPS dilution.
AI optics moved closer to the compute system. Management cited initial revenue from optical circuit switching, progress in 1.6T cloud modules, rising demand for high-power CPO lasers and initial orders for external laser-source modules. These developments support the view that optical connectivity is moving closer to the compute system, although the timing and scale of commercial adoption remain uncertain.
A muted share reaction reflected elevated expectations. The stock was little changed after hours despite the beat and strong guidance, following a 43% gain over the previous six months. That reaction does not diminish the operating results, but indicates that investors may now require continued upside to already-rising estimates.
Key debates
Is a ~40% non-GAAP operating margin sustainable?
When will 1.6T, CPO and optical circuit switching become material revenue contributors?
What is the continuing dilution impact of the debt conversion?
How exposed is the outlook to hyperscaler concentration?
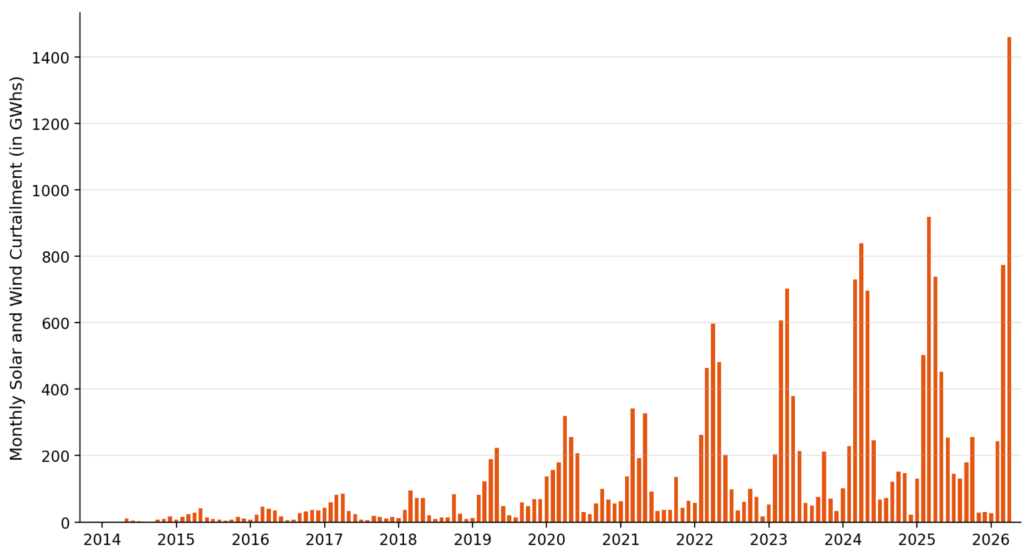
On August 4 Reuters reported that California had curtailed approximately 4.5 million megawatt-hours of wind and solar generation in the first half of the year, already exceeding the 3.77 million megawatt-hours curtailed during all of 2025.
At first glance, this appears absurd. On the one hand, electricity is sometimes so abundant that prices fall below zero. On the other hand, California continues to maintain several thousand megawatts of emergency resources to protect against summer heatwaves, wildfires and regional power shortages.
But this does not mean that California simultaneously has too much electricity and too little electricity at the same moment. Instead, the state is experiencing two entirely different forms of scarcity:
At midday in spring, it lacks the capacity to absorb, store or export surplus electricity.
During summer evenings and periods of extreme weather, it lacks capacity that can ramp up quickly, continue generating for extended periods and be delivered reliably to where it is needed.
What California truly lacks is not total annual electricity generation, but power that can be supplied continuously, at the right time and in the right place, and delivered to consumers through the grid.
The 4.5 Billion kWh of Curtailed Electricity
According to CAISO’s (California Independent System Operator) monthly data, a total of 4,502,385 megawatt-hours (or 4.502 billion kilowatt-hours) of wind and solar generation was curtailed between January and June 2026. Spread evenly across every minute of the first half of the year, this would be equivalent to a power plant with approximately 1.04 gigawatts of capacity operating continuously for 181 days.
Month
Curtailed Wind and Solar Generation
Share of Five-Minute Intervals with Negative Prices
Maximum Three-Hour Net-Load Ramp
January
23,400 MWh
2.05%
16.43 GW
February
242,300 MWh
7.31%
17.76 GW
March
774,300 MWh
19.60%
20.86 GW
April
1,415,500 MWh
28.26%
18.42 GW
May
1,447,500 MWh
22.03%
20.07 GW
June
599,400 MWh
12.51%
20.93 GW
April and May alone accounted for approximately 63.6% of all curtailment during the first half of the year. The problem was most severe not during the peak summer demand season, but in spring, when temperatures were mild, air-conditioning demand was relatively low, and solar output was already high.
Curtailment, Negative Prices and Power Shortages Are Three Different Problems
Curtailment: The System Cannot Efficiently Accommodate the Next Unit of Electricity
Curtailment can result from either physical constraints or economic dispatch.
Physical curtailment usually occurs when transmission lines in a particular area are already operating at full capacity. Even if another city needs electricity, additional power generated in a solar-rich region cannot be transmitted out.
Economic curtailment occurs when there is insufficient demand in the market. Continued generation could cause supply to exceed demand, pushing market prices below zero and prompting generators to reduce output.
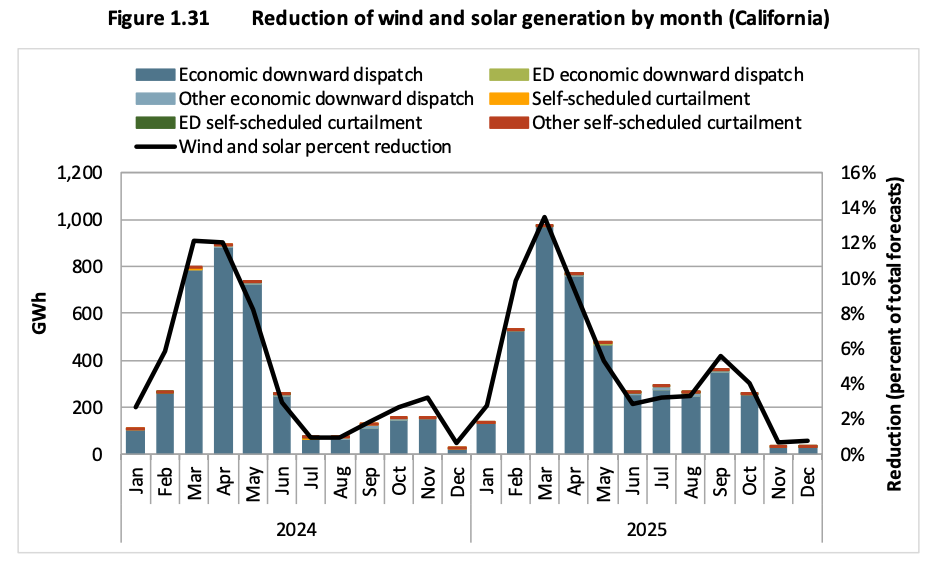
CAISO’s Department of Market Monitoring estimated that, across the Western Energy Imbalance Market in 2025, approximately 4.78 million megawatt-hours of downward dispatch of wind and solar generation was economic, accounting for 89% of the relevant reductions. Self-scheduled resources were forcibly curtailed by approximately 480,000 megawatt-hours, accounting for 9%. This indicates that most curtailment was not caused by emergency operators suddenly disconnecting generation. Instead, the market actively reduced output in response to supply, demand and generator bids.
Negative Prices: The Next Unit of Electricity Has Negative Marginal Value at a Particular Time and Location
Negative electricity prices do not mean that the power system as a whole has no value, nor do they mean that households can consume electricity for free. They simply indicate that, at a particular node and during a particular five-minute or fifteen-minute trading interval, the system does not want to receive additional electricity.
Renewable energy projects may be willing to submit negative-price bids for several reasons:
The short-run marginal cost of generating wind and solar power is close to zero.
Projects may receive tax credits, renewable energy certificates or fixed contractual payments.
Some conventional power plants face high shutdown and restart costs, so they may also prefer to continue operating during periods of low prices.
As long as the loss caused by a negative market price is smaller than the subsidy or contractual revenue received, continued generation may remain profitable.
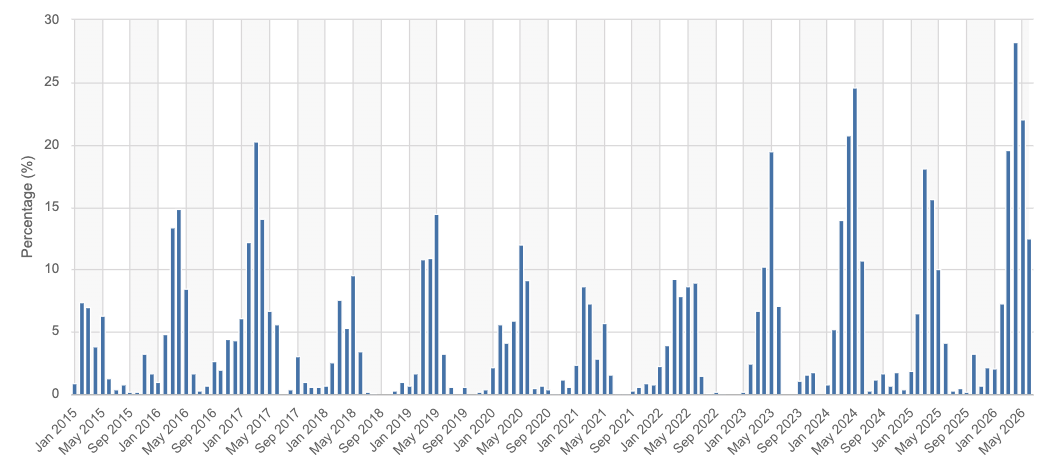
CAISO notes that negative prices occur most frequently when renewable generation is high and electricity demand is low. In 2025, negative prices occurred in 8.4% of five-minute intervals in the CAISO market, down from 10.7% in 2024. In April 2026, however, the share rose again to 28.26%. In other words, batteries and market reforms have reduced the problem on an annual average basis, but they have not eliminated extreme oversupply around midday in spring.
Power Shortages: A Lack of Deliverable Capacity During Critical Periods
Reliability shortages are not determined by how much electricity is generated over the course of an entire year. The relevant question is whether the system can maintain the balance between supply and demand during its most difficult hours.
CAISO forecasts a peak load of 46,844 megawatts in 2026. Its probabilistic model indicates that, under normal planning assumptions, the system has an effective capacity surplus of approximately 2,547 megawatts and can satisfy the reliability standard of limiting the expected loss of load to no more than 0.1 days per year. In other words, California is not expected to face an inevitable power shortage under normal conditions.
The problem is that the model does not simultaneously simulate overlapping extreme events such as a prolonged drought, wildfires disrupting transmission, a heatwave affecting the entire western United States and failures at several large generating facilities. CAISO has explicitly stated that these risks, if they occur at the same time, could still lead to emergency conditions.
California’s decision to retain emergency generation is therefore not contradictory. For the summer of 2026, the state prepared up to approximately 4,500 megawatts of emergency and reserve resources to address extreme conditions that fall outside the assumptions of its standard planning model.
The Real Challenge Is What Happens Within Three Hours
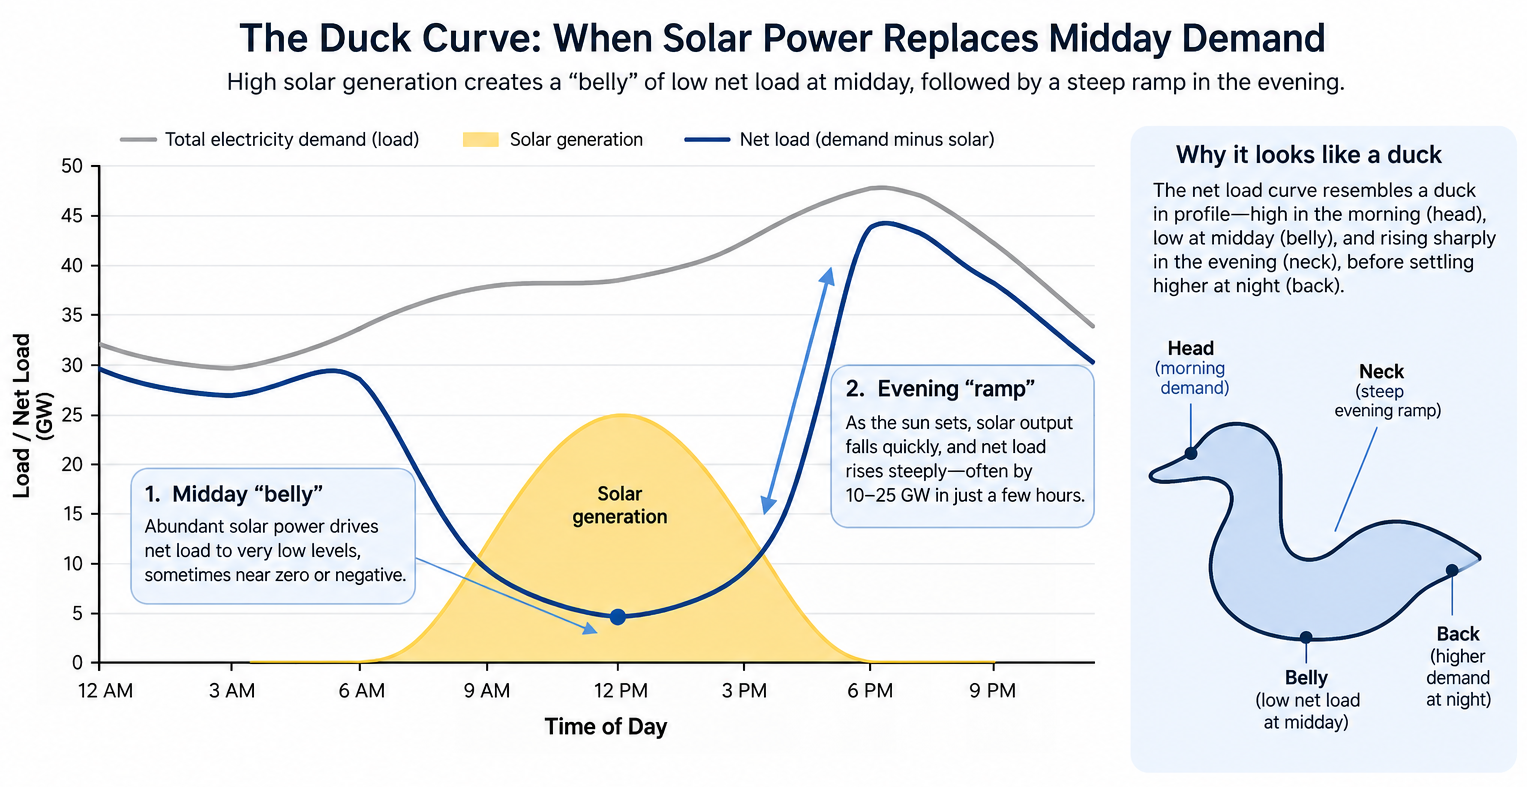
At midday, when solar output is high, net load can fall to very low levels. After sunset, solar generation declines rapidly, but demand does not fall at the same pace. Net load therefore rises sharply.
The duck curve shows how high solar generation during the middle of the day pushes net load down, creating a “belly,” followed by a sharp ramp in the evening when solar output falls and demand remains high. This pattern makes it more challenging to operate the grid, because the power system needs flexible resources to ramp up quickly as the sun sets.
In June 2026, CAISO’s maximum three-hour net-load ramp reached 20,931 megawatts, equivalent to 44.7% of the forecast peak load for 2026. This means that the system sometimes has to rearrange enough electricity supply within three hours to meet nearly half of the grid’s peak demand.
This supply does not necessarily have to come entirely from newly started plants. It can be supplied through:
Batteries discharging
Existing facilities increasing output
Increased electricity imports from other states
Renewable energy sources that continue generating during the evening
Regardless of where it comes from, what the system needs is power capacity that can change its operating state quickly, not additional solar electricity when the grid is already unable to absorb it.
This explains why electricity generated by the same solar plant may have a negative value at midday, while storing that same unit of electricity and delivering it at 8 p.m. can significantly increase its value. Electricity is not a homogeneous commodity whose value is independent of time.
California Already Has More Than 17 GW of Battery Storage. Why Is Curtailment Still Rising?
By 2025, California’s installed battery storage capacity had exceeded 17,000 megawatts. Batteries have become an important source of electricity during the evening peak, rather than merely an experimental technology.
Within the CAISO system, the capacity of batteries participating in the market increased from approximately 500 megawatts in 2020 to 13,000 megawatts by the end of 2024.
In 2024, battery charging accounted for an average of 14.7% of system load between 10 a.m. and 1 p.m. Between 5 p.m. and 9 p.m., batteries supplied an average of 8.6% of the system’s electricity while meeting 84% of its frequency-regulation requirements.
These figures show that batteries have significantly reduced the severity of the duck curve. However, they have not eliminated curtailment entirely, for at least five reasons.
First, Megawatts Are Not Megawatt-Hours
The figure of 17,000 megawatts describes the maximum rate at which batteries can charge or discharge, not the amount of energy they can store.
Most existing utility-scale batteries in the CAISO system have a discharge duration of approximately 4 hours. A 100-megawatt, four-hour battery can store about 400 megawatt-hours of energy, which is not enough to support the system through several consecutive days of extreme heat or an extended period of cloudy weather.
Second, Curtailment and Batteries May Occur in Different Locations
When transmission lines in a solar-intensive region are already congested, batteries located near the Los Angeles load centre may not be able to absorb the electricity being curtailed there.
Only batteries located upstream of the congested transmission line, sharing the same grid connection as the solar facility, or connected through sufficient transmission capacity can directly reduce curtailment at a particular project. The location of battery storage is therefore just as important as the amount of capacity installed.
The market has already begun adapting to this problem. Approximately 41% of existing utility-scale solar capacity in the CAISO system is co-located with batteries, while about 93% of solar projects scheduled to begin operating before 2030 include battery storage.
Third, Batteries Cannot Use Their Entire Capacity to Absorb Curtailed Electricity
Batteries must also reserve energy for the evening peak, frequency regulation, reserve capacity and other ancillary services. Once a battery is fully charged at midday, it cannot absorb additional solar generation later in the afternoon. Conversely, if it does not preserve sufficient capacity because it is absorbing more low-priced electricity, it may not have enough energy available to discharge in the evening.
Fourth, Battery Dispatch Is Affected by Market-Design Problems
CAISO’s day-ahead market optimises operations over the following 24 hours. However, the 15-min real-time market looks ahead only about two hours, while the five-minute market has an optimisation horizon of only about 65 minutes.
When prices rise earlier in the afternoon, the real-time market may instruct batteries to discharge prematurely because its optimisation software cannot see the more severe evening peak several hours ahead. As a result, batteries may enter the critical period with an insufficient state of charge. CAISO’s Department of Market Monitoring has identified these limited optimisation horizons as an important problem affecting battery dispatch.
Fifth, Four-Hour Storage Solves Intraday Mismatches, Not Every Type of Mismatch
Four-hour lithium-ion batteries are highly effective at shifting electricity from midday to the evening, but they are not well suited to solving the following problems on their own:
Extended periods of heatwaves, low wind and cloudy weather
Seasonal mismatches between winter and spring
Reduced solar generation caused by wildfire smoke
Widespread transmission failures
California therefore needs a portfolio of resources with different discharge durations, rather than treating every problem as something that can be solved simply by building more batteries.
Transmission Capacity May Be Scarcer Than Generation Capacity
Renewable energy projects can usually be built within a few years, but large transmission lines require route selection, environmental assessments, land coordination, regulatory approvals, procurement and construction. The process often takes more than a decade.
The SunZia project illustrates the difference between generation capacity and deliverable capacity. The project has 3,650 megawatts of installed capacity, of which approximately 3,167 megawatts has been allocated to CAISO. However, in its summer 2026 reliability assessment, CAISO initially counted no more than 1,009 megawatts of additional import capability. The reasons included transmission rights, import capability limits and unfinished internal upgrades in Southern California. The relevant upgrades are not expected to enter service until around 2034.
In other words, building 3,650 megawatts of wind capacity does not mean that California receives 3,650 megawatts of reliable electricity when it is needed most.
This is also why simply counting newly installed solar, wind and battery capacity can easily overstate the actual improvement in the power system.
In 2026, CAISO approved 38 transmission projects with an estimated total investment of approximately US$6.7 billion over the next decade. More than half of the projects and more than half of the investment were driven by growth in electricity demand. The plan also includes 12 reconductoring projects, three of which will use advanced conductors to increase the capacity of existing lines without constructing entirely new transmission corridors.
By 2035, California’s electricity load is expected to increase by 15 gigawatts, while the system will need to add more than 74 gigawatts of resource capacity. By 2040, load is expected to increase by 20 gigawatts, while required resource capacity will rise by more than 107 gigawatts.
This does not necessarily mean that California is overbuilding power plants by a factor of five. The additional resources include solar and wind facilities that cannot maintain their nameplate output around the clock, as well as storage systems that must first be charged before they can discharge. To meet demand in every hour, the system requires higher nominal installed capacity, complementarity among different resources and substantial transmission redundancy.
Why Have Negative Electricity Prices Not Translated into Lower Residential Bills?
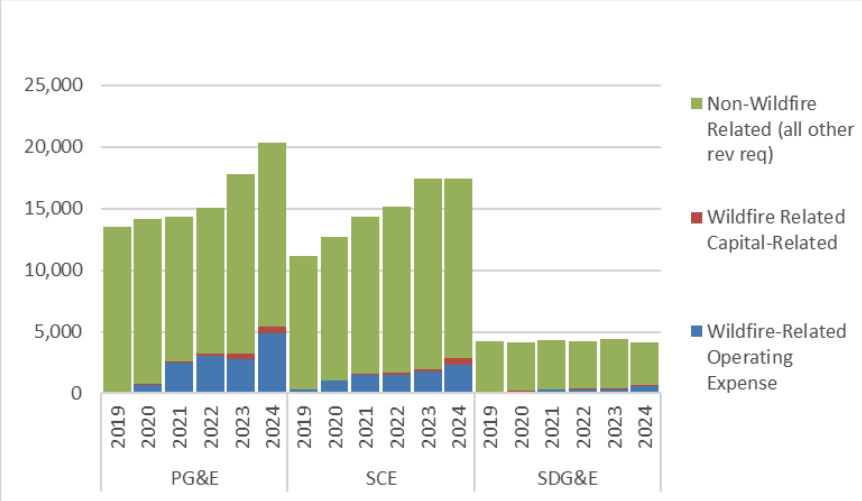
Wildfire-Related Revenue Requirement Relative to Total Revenue Requirement, Year-End, $ Millions (Source: CA Public Utilities Commission)
The claim that “wholesale prices are negative, so households should receive electricity for free” is therefore incorrect.
A negative price means only that the marginal unit of electricity has no value at a particular location around midday. The transmission network, distribution grid, wildfire-prevention work and reliable evening capacity must still be paid for throughout the year. Those costs do not disappear simply because wholesale prices fall below zero for several hours around midday.
Curtailment does increase overall system costs because it reduces the utilisation of assets that have already been built and may require consumers to pay simultaneously for additional renewable generation, storage and transmission infrastructure. At present, however, California’s high residential electricity rates cannot primarily be attributed to curtailment. Official cost data indicate that wildfire-related and network costs have had a greater impact.
California Should Not Aim for Zero Curtailment
At first glance, curtailing 4.5 billion kilowatt-hours of electricity may seem to imply that California must build enough batteries and transmission lines to preserve every unit of generation.
From an economic perspective, however, zero curtailment is not necessarily the optimal objective.
Suppose extreme solar oversupply occurs for only a few dozen hours each year. Building an expensive transmission line or a long-duration storage facility that remains idle for most of the year simply to preserve the final unit of electricity may cost more than curtailing that generation directly.
CAISO’s transmission-planning process applies similar logic. It uses production-cost models to compare the cost of new infrastructure with the benefits to consumers from reducing congestion and decreasing the dispatch of higher-cost generation.
The concern for California is therefore not that any curtailment occurs, but that curtailment is increasing too quickly and that the share of available wind and solar generation curtailed in April alone has already reached approximately 18%. This indicates that the mismatch between renewable-energy expansion and the growth of electricity demand, storage and transmission infrastructure is becoming wider.
Disclaimer: The content is for informational purposes only. You should not construe any such information or other material as legal, tax, investment, financial, or other advice. Nothing contained in this article constitutes a solicitation, recommendation, endorsement, or offer by the author(s) or any third party service provider to buy or sell any securities or other financial instruments in your or in any other jurisdiction in which such solicitation or offer would be unlawful under the securities laws of such jurisdiction. The author(s) report(s) no conflict of interest.
Maersk, Hapag-Lloyd Resume More Sailings Through the Suez Canal
Maersk said another container service in its Gemini Cooperation with Hapag-Lloyd will resume sailing through the Red Sea and Suez Canal, extending the carriers’ gradual return to the route.
The two companies had already restored an Asia–Mediterranean–Europe service through Suez in July, while another service linking the Middle East with the U.S. East Coast is also set to return.
The move is an important signal that carriers are becoming more confident about operating through the Red Sea after years of rerouting vessels around the Cape of Good Hope. A broader return to Suez would shorten voyage times and release effective container capacity that has been absorbed by longer diversions around Africa. That could ease vessel shortages and put downward pressure on freight rates, making the pace of further route normalization a key factor for the container shipping market.
MSC and BlackRock Withdraw Approval Request for Purchase of Stake in Barcelona Port
MSC and BlackRock formally withdrew their EU approval request on August 10, 2026 for the proposed acquisition of joint control of Barcelona Europe South Terminal (BEST) from CK Hutchison.
The deal, first notified to the European Commission on November 5, 2025, would have given Terminal Investment Limited (TiL) — jointly controlled by MSC and BlackRock — joint control of BEST alongside Hutchison Ports. Brussels subsequently opened an in-depth antitrust investigation over concerns that MSC’s presence in both container shipping and terminal operations could allow it to favor its own services through better access to berths, cranes or storage capacity.
The review was paused on January 8, 2026 while the Commission awaited additional information. After months of regulatory scrutiny, MSC and BlackRock withdrew the current approval application on August 10 rather than continue the review under the existing transaction structure.
Importantly, this does not necessarily mean MSC has permanently abandoned BEST. What has been withdrawn is the current version of the transaction and its EU filing. The parties could theoretically restructure the deal, offer additional competition remedies and refile, although no next step has been announced.
Will MSC or TiL formally announce a renewed bid for Barcelona’s BEST terminal by December 31, 2027?
YesResult
42.66%
NoResult
57.34%
218 Polls
EndedTBD
The Barcelona deal is separate from the larger $22.8 billion CK Hutchison global ports transaction involving MSC and BlackRock. The BEST case has primarily centered on EU competition concerns over carrier-terminal vertical integration.
China Bypasses Shipping Chokepoints With ‘Ice Silk Road’ Through Arctic
China is moving to establish a regular container shipping service between Asia and Europe through the Arctic, expanding its “Ice Silk Road” as an alternative to traditional routes through maritime chokepoints.
The first scheduled service, operated by Sea Legend, is set to begin on August 12, 2026, linking Ningbo with Felixstowe in the UK via Russia’s Northern Sea Route.
The Arctic route can reduce the journey between China and northern Europe to roughly 20 days, potentially about half the time required on conventional routes in some conditions.
More importantly, it allows ships to bypass vulnerable chokepoints including the Strait of Malacca, Bab el-Mandeb and Suez Canal, whose strategic importance has been highlighted by repeated geopolitical and shipping disruptions.
However, the route remains highly seasonal and operationally challenging. Arctic shipping requires ice-capable vessels, faces limited emergency infrastructure and carries significant environmental risks.
Evergreen, Yang Ming and Wan Hai Post Positive Revenue Growth in the First Seven Months
Taiwan’s three major container carriers — Evergreen Marine, Yang Ming Marine Transport and Wan Hai Lines — all reported YoY revenue growth for the first seven months of 2026, supported by stronger freight rates.
Evergreen posted July revenue of NT$48.1 billion ($1.49 billion), up 43.1% YoY and 22.8% MoM. January–July revenue reached NT$239.8 billion ($7.43 billion), up 4.2% YoY.
Yang Ming reported July revenue of NT$20.8 billion ($644 million), up 34.6% YoY and 25.6% MoM. Seven-month revenue rose 5.8% YoY to NT$105.4 billion ($3.27 billion).
Wan Hai generated NT$18.6 billion ($576 million) in July, up 50.1% YoY and 15.3% MoM. January–July revenue reached NT$95.2 billion ($2.95 billion), up 12.8% YoY.
The figures show that recent freight-rate strength is still supporting carrier revenues. The key risk ahead is whether demand can absorb additional effective capacity as more vessels return to the Suez Canal and Cape of Good Hope diversions unwind.