

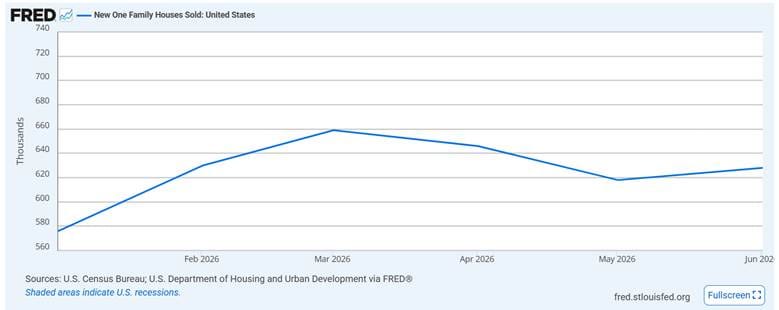
New home sales came in at a 628,000 annualized rate in June, up 1.6% from May and above the 610,000 consensus.
Source: FRED
June’s gain partly reversed the declines in April and May, leaving the sales pace below its March peak.
On the surface, this looks like a housing market getting more affordable. But within a ±14.8% margin of error, it could just as easily disappear in the next revision.
The sticker price can fall without the home getting any easier to carry, so let’s follow June’s median home from the sales sheet to the buyer’s monthly bill.
June new-home sales: turning point or head fake?
The rate is doing more work than the price tag
The latest Redfin data puts the typical down payment among mortgage-financed buyers at 15%. Applied to the median new home, $398,300, down 2.7% from a year ago and down from $412,000 in May, that is $59,745 upfront and a $338,555 mortgage.
At the latest 6.58% average 30-year fixed rate, principal and interest comes to roughly $2,158 a month.
This is before property taxes, insurance or mortgage insurance.
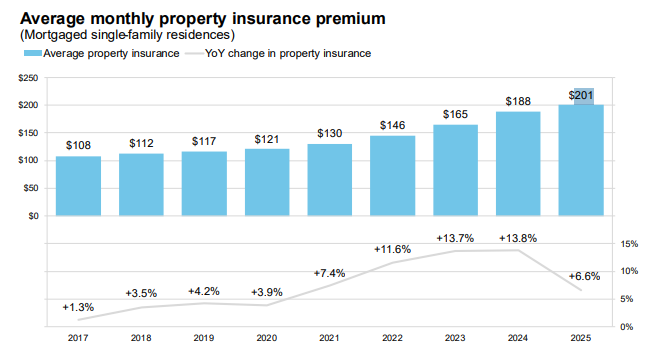
Using the latest 0.9% national effective property-tax rate adds about $299 monthly. The average homeowners insurance premium reached roughly $2,412 annually in 2025, adding another $201. Because the buyer put down less than 20%, an illustrative 0.6% private mortgage-insurance charge adds about $169.
Source: ICE
The full monthly cost therefore lands near $2,827. Maintenance, HOA fees, utilities and closing costs are still outside this number.
|
Cost item |
Amount |
How it
affects the buyer |
|
Purchase
price |
$398,300 |
Headline
price |
|
15% down
payment |
$59,745 |
Paid upfront |
|
Mortgage |
$338,555 |
Amount
financed |
|
Principal and
interest |
$2,158/month |
Mortgage
payment |
|
Property tax |
$299/month |
Based on
illustrative 0.9% rate |
|
Homeowners
insurance |
$201/month |
Based on 2025
average |
|
PMI |
$169/month |
Illustrative
0.6% charge |
|
Total
modeled payment |
$2,827/month |
PITI plus
PMI |
So a home carrying a $398,300 price tag requires nearly $60,000 upfront and approximately $34,000 a year in mortgage-related payments.
Does a larger down payment solve the problem?
It lowers the payment, but it does so by moving more of the burden forward. Putting down 20% lowers the payment to about $2,533 by reducing the loan and removing PMI, but requires $79,660 at closing.
The 20% buyer saves almost $300 a month compared with the 15% buyer, but the 20% buyer also has nearly $20,000 less available for repairs, emergencies, or another investment.
This is a real improvement in monthly affordability, but it is not free. You tie up liquidity for a lower carrying cost.
The comparison with June 2022: The rate erased a $33,400 price discount
On price alone, today’s buyer gets the better deal. The latest revised Census data put the June 2022 median new-home price at $431,700, compared with $398,300 today. This makes the current home $33,400, or 7.7%, cheaper.
With 15% down, the lower price saves today’s buyer $5,010 upfront and reduces the mortgage by $28,390. But the rate is 0.88 percentage points higher, which consumes the benefit of that smaller loan and leaves the buyer paying about $28 more every month in principal and interest.
|
June 2022 |
June 2026 |
Difference |
|
|
Median
new-home price |
$431,700 |
$398,300 |
-$33,400 |
|
15% down
payment |
$64,755 |
$59,745 |
-$5,010 |
|
Mortgage |
$366,945 |
$338,555 |
-$28,390 |
|
Mortgage rate |
5.70% |
6.58% |
+0.88 points |
|
Monthly
principal and interest |
$2,130 |
$2,158 |
+$28 |
The home got cheaper, yes, but financing it became expensive enough to take the entire saving back.
Builders are increasingly subsidizing the payment
The July NAHB survey showed 63% of builders using sales incentives. Separately, 37% reported cutting prices, with an average reduction of 6%.
A 6% reduction on the median home saves approximately $158 a month under the same assumptions. An illustrative permanent rate reduction from 6.58% to 5.58% saves about $219 in principal and interest.
Both make the home easier to carry. But they also reveal how weak the underlying affordability remains. If the deal only works after the builder lowers the rate or absorbs part of the upfront cost, the market-rate payment is still too high. The buyer is getting relief, but the builder is supplying it.
If mortgage rates stay around 6.5%, where does the next concession come from?
What would show genuine affordability relief?
As discussed above, a lower sale price reduces the amount borrowed, but this benefit can be (and was) absorbed by a higher mortgage rate, a smaller down payment, mortgage insurance and rising property taxes and homeowners insurance.
The relevant question is therefore whether the buyer’s total monthly cost begins falling, not whether the median price falls again.
The first trigger to look for is the 30-year mortgage rate, published weekly by Freddie Mac. At 6.58%, principal and interest on the median new home with 15% down is about $2,158 a month. A drop toward 5.7% would reduce this by roughly $190 and bring financing costs closer to their June 2022 level.
The second is builder incentives in the monthly NAHB survey. If sales hold up while incentive use moves below 60% and fewer builders need to cut prices, it would suggest buyers can carry the payment with less support. If incentives keep rising, the lower sale price is still not sufficient on its own.
The third is the combination of sales and months of supply in the next Census releases. A few months of stronger sales alongside supply falling from 9.3 months to below nine would indicate that lower prices and financing support are broadening demand. If prices continue falling while sales remain near 628,000 and supply stays above nine months, builders are making homes cheaper without making them affordable enough to clear the market.
These three indicators separate a lower home price from a real affordability improvement: financing costs must fall, buyers must need less support and lower monthly payments must begin translating into stronger demand.
Sources:
Census: MONTHLY NEW RESIDENTIAL SALES, JUNE 2026
FRED: New One Family Houses Sold: United States
FRED: Table Data - Median Sales Price for New Houses Sold in the United States
Freddie Mac: PMMS
ICE: Mortgage Monitor Report
NAHB: NAHB/Wells Fargo Housing Market Index (HMI)
Redfin: Typical Homebuyer’s Down Payment Falls to $64,000 As Americans Hold Onto Cash