
The July ISM Manufacturing and Services reports are finally in (landing August 3 and August 5, respectively), giving us our first clean look at how US businesses entered Q3.
With investors desperately trying to figure out if the economy can keep humming without poking the inflation bear, these two reports carried way more weight than usual.
Long story short, cost pressure is flaring up again in services, and manufacturing is still expensive, although its Prices Paid Index actually eased in July.
At headline level, manufacturing did most of the moving, with its PMI jumping from 53.3 to 55.6. Services barely budged, edging from 54.0 to 54.1.
The real million-dollar question now is how much those costs rose, and how much gets dumped onto the consumer.
54.1 services headline hides much stronger demand and cost pressure
The Services PMI barely moved from 54.0 to 54.1. It averages four different indexes, and they pulled in opposite directions in July.
Business Activity surged 3.7 points to 59.1, its second-highest level since May 2024, New Orders climbed from 55.1 to 57.2, and 13 of the 18 covered industries posted outright growth.
Taken together, it looks like accelerating activity and stronger incoming work. Still, before we crown this as a genuine Q3 demand surge, it’s worth pointing out that at least part of July’s strength was tied to the World Cup.
Technically, this looks like a stronger Q3 kickoff than the main score lets on, so why did the headline lag?
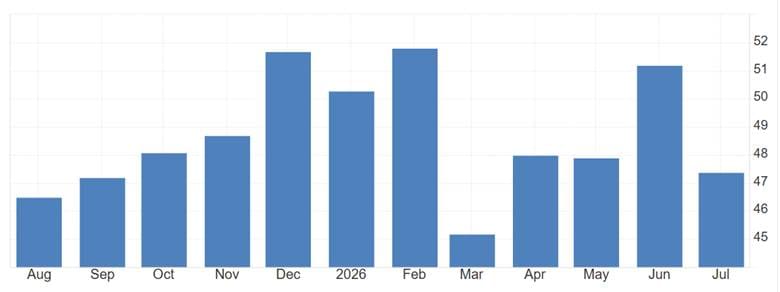
Source: Trading Economics – ISM Non-Manufacturing Employment
Employment dropped from 51.2 to 47.4, dragging the index down. On top of that, Supplier Deliveries dropped from 54.4 to 52.8. Anything above 50 means deliveries are slowing, but not as widespread as in June. Also, slower deliveries lift the overall PMI, so the improvement actually held the headline down. Simply put, service-sector supply became less bad.
This makes the price increase even more interesting because companies reported broader cost pressure even as delivery problems eased. The rise in services costs despite less widespread delivery deterioration suggests that factors beyond the month-to-month change in bottlenecks were also at work.
Although Prices Paid is not one of the components of headline PMI, it climbed from 67.7 to 70.3, marking its fourth reading above 70 in five months. So even if delivery pressure eased, companies were still paying more.
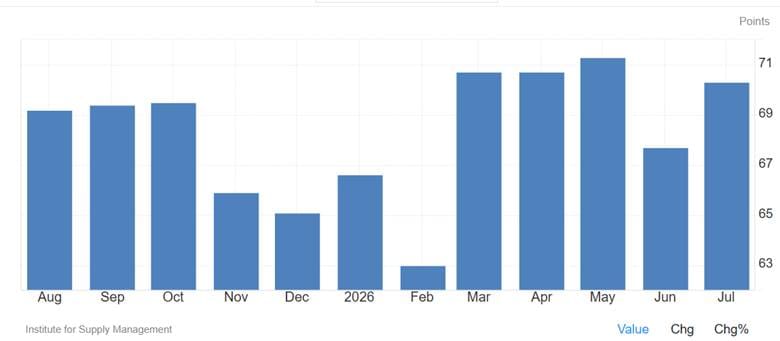
Source: Trading Economics – Services Prices
At the company level, 44.7% of respondents said they paid more in July, while 3.2% paid less and the remainder reported no change.
When ISM grouped those responses by industry, 17 of the 18 sectors registered higher prices and none recorded an overall decline. Some individual companies therefore found cheaper inputs, but they were too few to pull any industry into lower-price territory.
Manufacturing is expensive, but the read is a bit different
The headline PMI jumped from 53.3 to 55.6, the strongest reading in more than four years.
Manufacturing input inflation remains equally elevated, though it moved in the opposite direction. The factory Prices Paid Index eased from 73.0 to 71.1 in July, but Supplier Deliveries rose from 57.4 to 58.9, showing manufacturers faced longer delays even as price growth cooled slightly.
Stacked together, this isn’t a fresh, uniform supply shock. Factories are fighting worsening bottlenecks, while service providers are enjoying smoother deliveries yet getting slammed with broader price increases. Fuel explains part of it (especially post-oil disruptions), but systemic cost pressure is popping up everywhere else, with ISM also listing beef, copper, software licensing, steel products and transportation among the items rising in price.
What would convince you that July’s cost pressure is more than a one-month flare-up?
Prices Paid leaves out the most important transaction
There is a main flaw in relying purely on the ISM cost number, it measures breadth rather than magnitude. A tiny 1% cost bump at one firm counts the exact same as a 50% surge at another. More importantly, it tells you zero about what the final retail customer pays.
In all likelihood, companies intend to pass the bill to you eventually. In ISM’s planning survey, 59% of service companies plan to transfer (at least some) tariff/input costs to buyers, and 77% of manufacturers plan to do the exact same thing.
But will consumers accept it? Individual comments in the July survey illustrate where resistance is emerging:
- Construction: One firm reported falling sales despite offering bigger discounts.
- Wholesale: Builders are fighting back against price increases.
- Transportation: Fuel and labor are spiking, but one transportation respondent described demand as stable.
When businesses face higher costs but customers refuse to pay higher prices, the business has to eat the difference, which is known as a margin squeeze.
For equity investors, the truth will come out in Q3 earnings: higher selling prices with stable sales volume means pricing power; flat prices, heavy promotions, or shrinking gross margins mean corporate earnings are swallowing the blow.
The hiring drop is awkward, but not straightforward
The Employment Index has now spent 12 of the last 18 months in contraction territory. July’s drop to 47.4 suggests service firms are soaking up heavy demand without hiring at the same pace.
This doesn’t automatically mean official job reports are going to crash. In fact, historical data shows ISM Services Employment is a notoriously poor predictor of official Bureau of Labor Statistics (BLS) payrolls.
What it does point to is a push for efficiency. Second-quarter productivity rose at a 1.4% annualized rate, more than double the 0.6% consensus forecast, while unit labor costs increased 1.3% versus the 2.1% economists expected, so there is at least some evidence that companies are getting more from each hour worked.
So, one question would be: are efficiency and AI saving the day?
Sort of, but we don’t have nearly enough data yet to credit AI for this efficiency gap. The fact that the Employment Index contracted means companies are meeting this massive surge in demand without hiring more workers. Cost-cutting, outsourcing, and plain old hiring caution could also explain this gap.
For now, all we can really say is that businesses appear to be getting more output without starting another broad hiring cycle.
Here is what I would watch next
The July employment report arrives on August 7. If payrolls come in under ~80k and unemployment ticks past 4.2%, the ISM hiring warning becomes harder to brush off. If it comes in hot with high wage growth (average hourly earnings rise by 0.4% or more on the month), inflation fear comes back with a vengeance.
If CPI and PPI both surprise higher, front-end yields and the dollar would probably move up, while long-duration technology stocks could come under pressure. If PPI accelerates while CPI stays contained, that would strengthen the case that upstream price pressure had not yet fully reached consumer prices. Attention would then shift toward corporate margins, as investors assess whether businesses are absorbing some of that pressure rather than passing it fully to customers.
The early warning starts to break down if August’s Services Prices Paid Index falls below roughly 65, delivery times move closer to normal (the neutral 50 level), and the official inflation reports remain contained.
Upcoming earnings calls will reveal the truth: who has real pricing power, and which companies are left holding the bag.
Which risk do you think markets are underpricing after the July ISM reports?
Sources
Institute for Supply Management: July 2026 ISM Manufacturing PMI Report
Institute for Supply Management: July 2026 ISM Services PMI Report
Institute for Supply Management: Seasonal Adjustment Factors and Diffusion-Index Methodology
Institute for Supply Management: ISM Supply Chain Planning Forecast Is Another Sign of the Economy’s Resilience
Institute for Supply Management: ISM Report Release Date Calendar
Reuters: US Manufacturing Activity Hits More Than Four-Year High; Input Prices Elevated
Reuters: US Service Sector Maintains Strong Growth Pace in July
Reuters: US Productivity Rises Faster Than Expected in Second Quarter
US Bureau of Labor Statistics: Schedule of Selected Releases for August 2026
US Bureau of Labor Statistics: Schedule of Releases for Productivity and Costs