This is the third and final article in my Hormuz Strait March 2026 Analysis Series.
In the series, I break down the wider architecture of vulnerability behind Hormuz, trace the real transmission channels from Gulf disruption into the global economy, explain how different prediction markets are pricing different slices of the same crisis, and test whether these contracts have genuine economic value as hedging instruments.
💡 Sign up to Receive Future Updates and Articles if You Haven’t Done So.
 Bennet Caldwell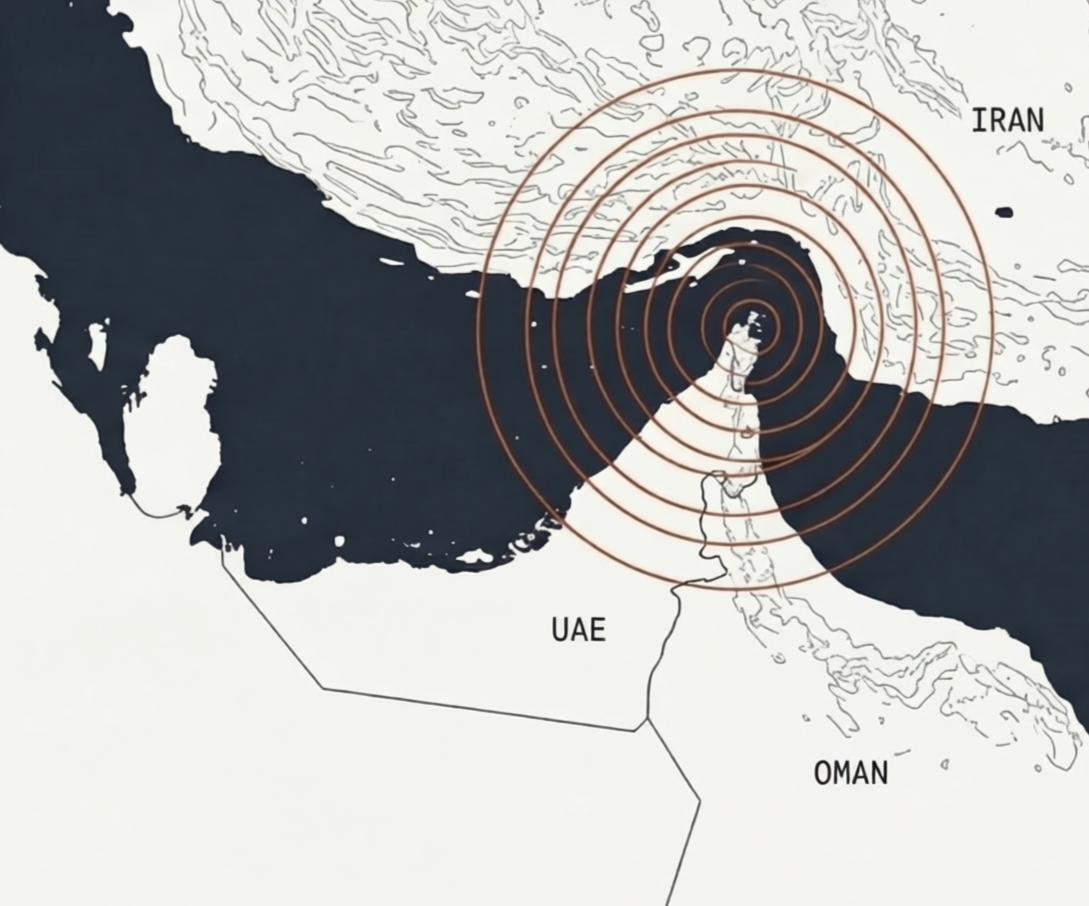
Click on the Bookmark to read Article 1 of the Series
 Bennet Caldwell
Click on the Bookmark to read Article 2 of the Series
This piece asks a simple question: do Hormuz event contracts actually work as hedges? I test them against real commodity-linked exposures and compare where they help, where they fail, and why.
The answer is more conditional than it first appears. Some contracts do contain real hedging value. But they are also highly volatile instruments, and the contracts that look best on paper do not always protect the portfolio when stress actually hits.
Setup
The aim of this article is to assess the effectiveness of using Hormuz-related event contracts to hedge against conventional commodity exposure (i.e. usual business exposure) from the perspective of different economic agents, namely: an Asian airline operator, a crude oil exporter in the gulf, and a European oil trading company.
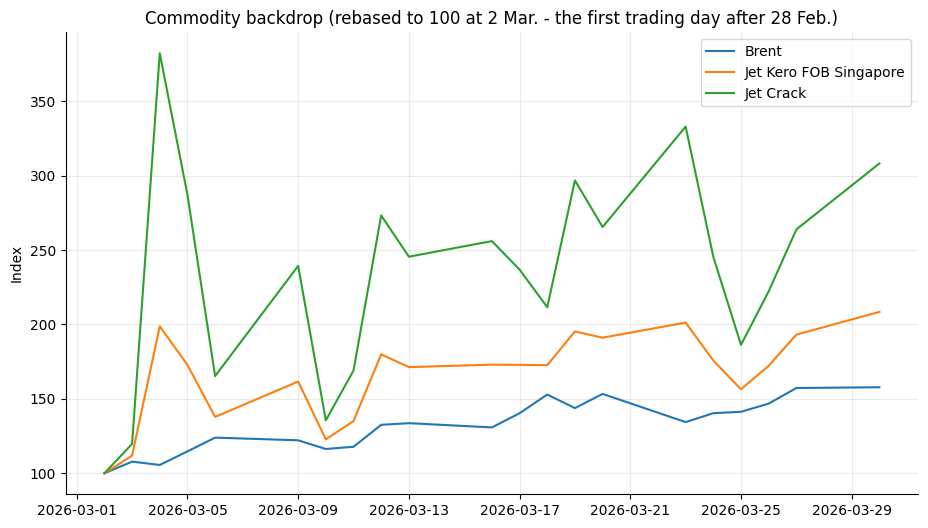
In practical terms, this exercise compares an unhedged commodity-only position with a two-leg portfolio that adds the event contract. Daily P&L is measured using changes in the commodity price and changes in the event-contract price (which approximates the probability of the event happening).
Estimating hedge ratio
In the two-leg portfolios, the event contract notional is multiplied by a factor (i.e. the hedge ratio), so that the event leg is large enough to matter in the portfolio to provide a hedging effect.
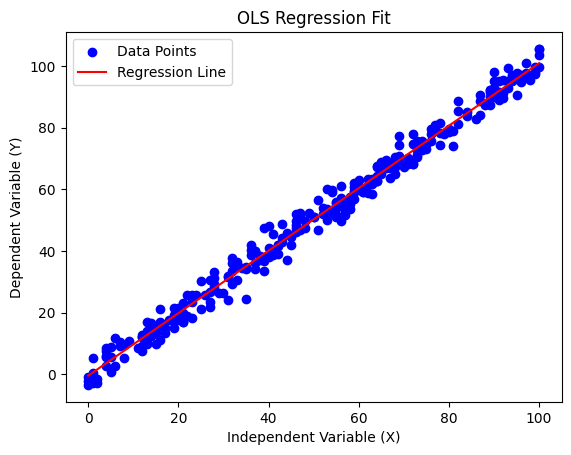
The OLS method is used. It estimates the hedge ratio by regressing daily commodity-leg P&L changes on daily event-contract price changes, then uses the fitted coefficient to size the event leg. This is closer to a standard minimum-variance hedge and usually gives more stable, easier-to-interpret results.
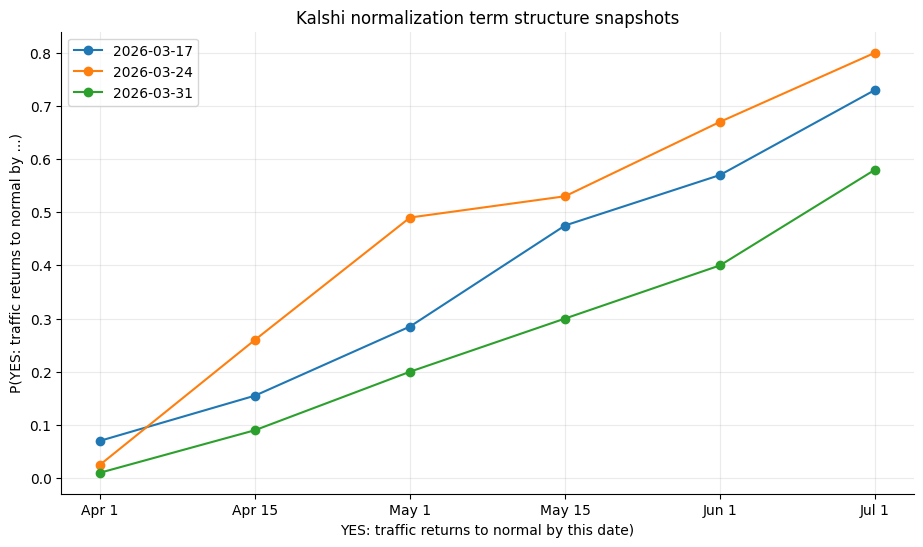
Portfolio demo using Kalshi's strait normalization contract
Asian airline operator
The airline portfolio is defined as short Jet Kero plus long NO on strait normalization.
The economic intuition is straightforward: if Hormuz disruption persists, prompt aviation fuel stress should remain elevated, hurting the fuel consumer but helping a position that benefits from delayed normalization.
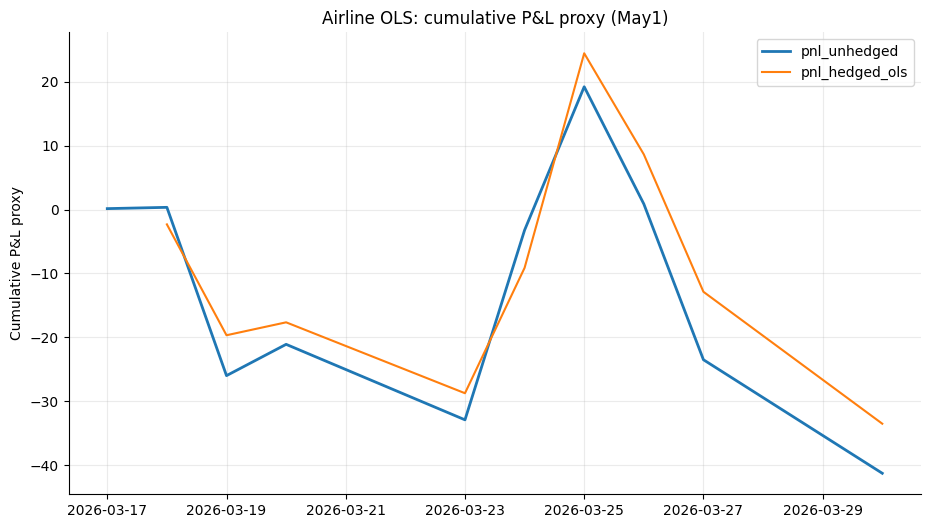
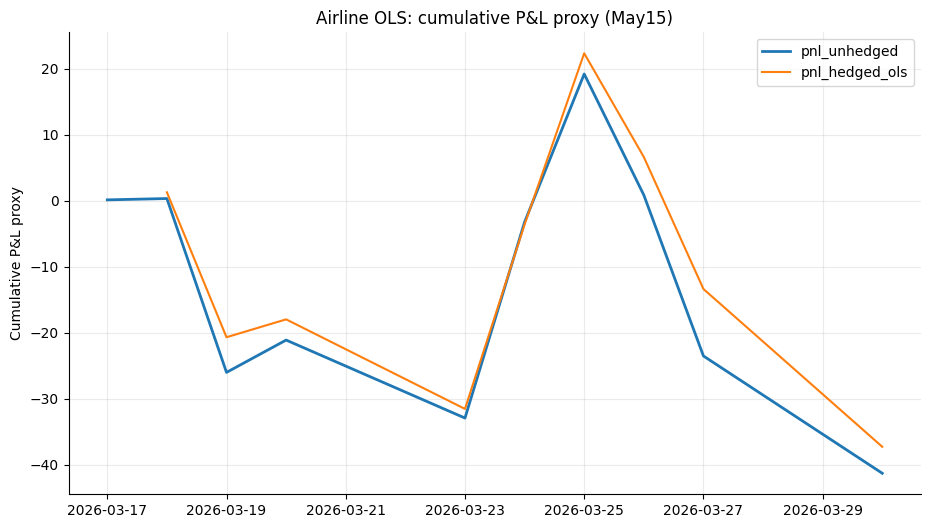
For short Jet + long NO on normalization, the 15 May tenor reduces volatility only marginally, from 19.15 to 18.26, but it does improve the worst day from -26.35 to -23.96. That is a meaningful tail improvement, even if the overall variance reduction is modest. In contrast, the 1 May tenor increases both portfolio volatility and worst day loss.
The implication is that the airline case does not support the idea of event contracts as a full daily hedge for jet exposure. At best, the normalization contract works as a small persistence overlay or tail-risk buffer.
This fits the economics. Airline fuel costs are driven not only by the existence of disruption, but also by refinery margins, regional product balances, and aviation-specific supply conditions. A normalization contract is therefore directionally relevant, but it is not tightly enough linked to prompt jet fuel pricing to serve as a strong day-to-day hedge.
Crude oil exporter in the gulf
The Gulf exporter portfolio is defined as long Brent plus long YES on strait normalization.
This is not a conventional hedge in the usual sense. Instead, it is a stylized way of mapping the exporter’s two opposing exposures: a Gulf disruption can support crude prices, which is helpful, but it can also impair physical export access, which is harmful. The event leg is therefore meant to capture the route-access side of the business.
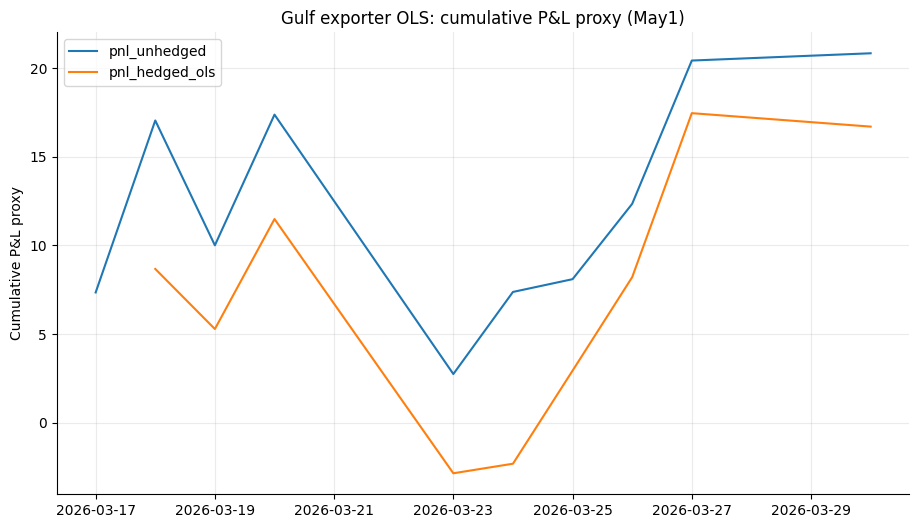
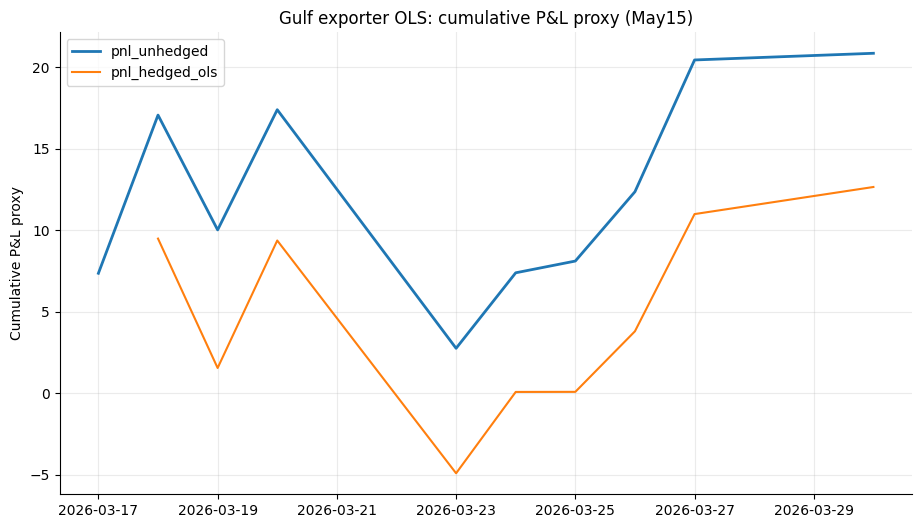
For Brent-linked portfolios, normalization contracts do show some hedge content. In the 1 May OLS results, long-Brent portfolios reduce volatility from 7.27 to 7.00, but the improvement in worst-day loss is very small, from -14.63 to -14.34. The 15 May tenor does better on the worst day, limiting the loss to -14.27. But it also increases the portfolio variance from 7.27 to 7.40.
The result is therefore best read as conceptually useful but quantitatively modest. The business logic is strong: Brent and normalization do map onto the two sides of the exporter’s exposure. But the event contract is not powerful enough, in this short sample, to generate a dramatic hedge improvement. It works better as a way to decompose the exporter’s risk into price and access, rather than as a stand-alone risk-reduction tool.
European oil trading company
The European crude trading company is defined as short Brent plus long NO on strait normalization.
This is the cleanest case economically. A trader exposed to higher crude replacement costs suffers when disruption persists and crude prices rise. The portfolio therefore combines a commodity leg that loses when Brent rises with an event leg that gains when normalization is delayed.
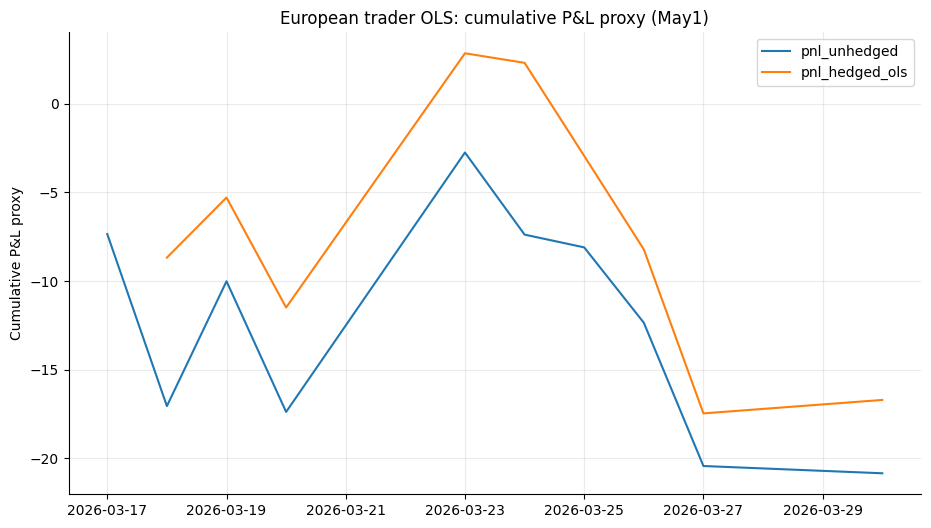
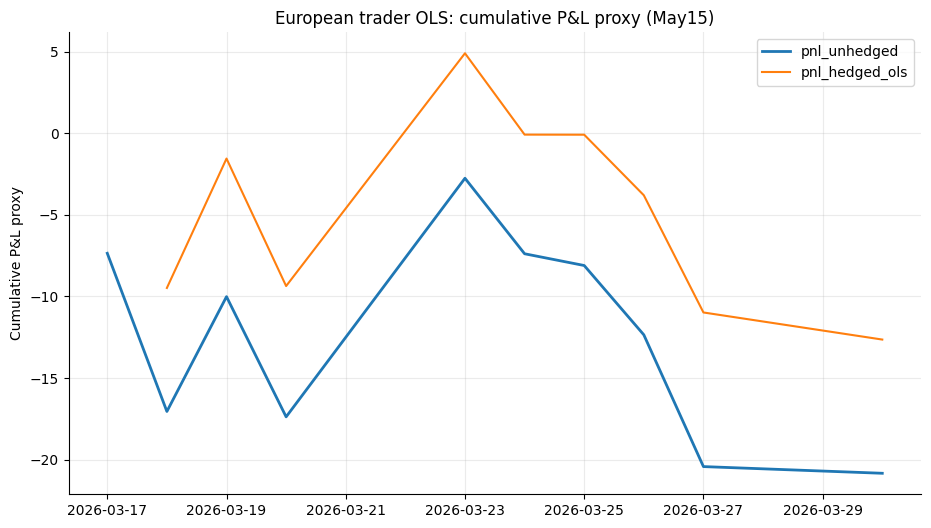
The results show that this portfolio is actually the most convincing of the three.
The 1 May tenor reduces volatility from 7.27 to 7.00, and the worst day improves from -9.70 to -9.25. The improvement is not large, but it is consistent across both volatility and tail loss. This is the cleanest example of a normalization contract acting like a real hedge rather than just a directional overlay. However, the 15 May tenor increases the portfolio variance from 7.27 to 7.40, but the worst day loss reduces from -9.70 to -9.48.
Limitations
- The commodity legs are only proxies for real business exposure. Platts Jet Kero FOB Singapore Price is used to represent airline fuel risk exposure, and Europe Spot Brent Price (data from U.S. EIA) is used to represent crude-linked exporter and trader risk. In practice, each business would face a much more complex exposure set.
- The sample window is short and event-specific. The portfolio tests are concentrated in a narrow March 2026 window, which means the estimated relationships are heavily shaped by one crisis regime. This is especially important for the OLS results, since the fitted hedge ratios reflect co-movement within this particular episode instead of a stable long-run relationship.
From curious to confident. Join the sharpest forecasters online, get top contracts, platform updates & market signals - free.
Portfolio demo with other Kalshi contracts
The section above uses the data for the event 'When will traffic at the Strait of Hormuz return to normal?' on Kalshi for illustration. To see how the portfolios perform when the commodity leg is combined with other Hormuz-related contracts on Kalshi, I conducted more analysis and summarized the metrics in the Excel file below.
Across all 74 combinations, 62 reduces the overall portfolio volatility. On the other hand, 45 improves the worst-day performance, while 18 worsens the worst-day loss and the remaining 11 has the same worst-day performance.
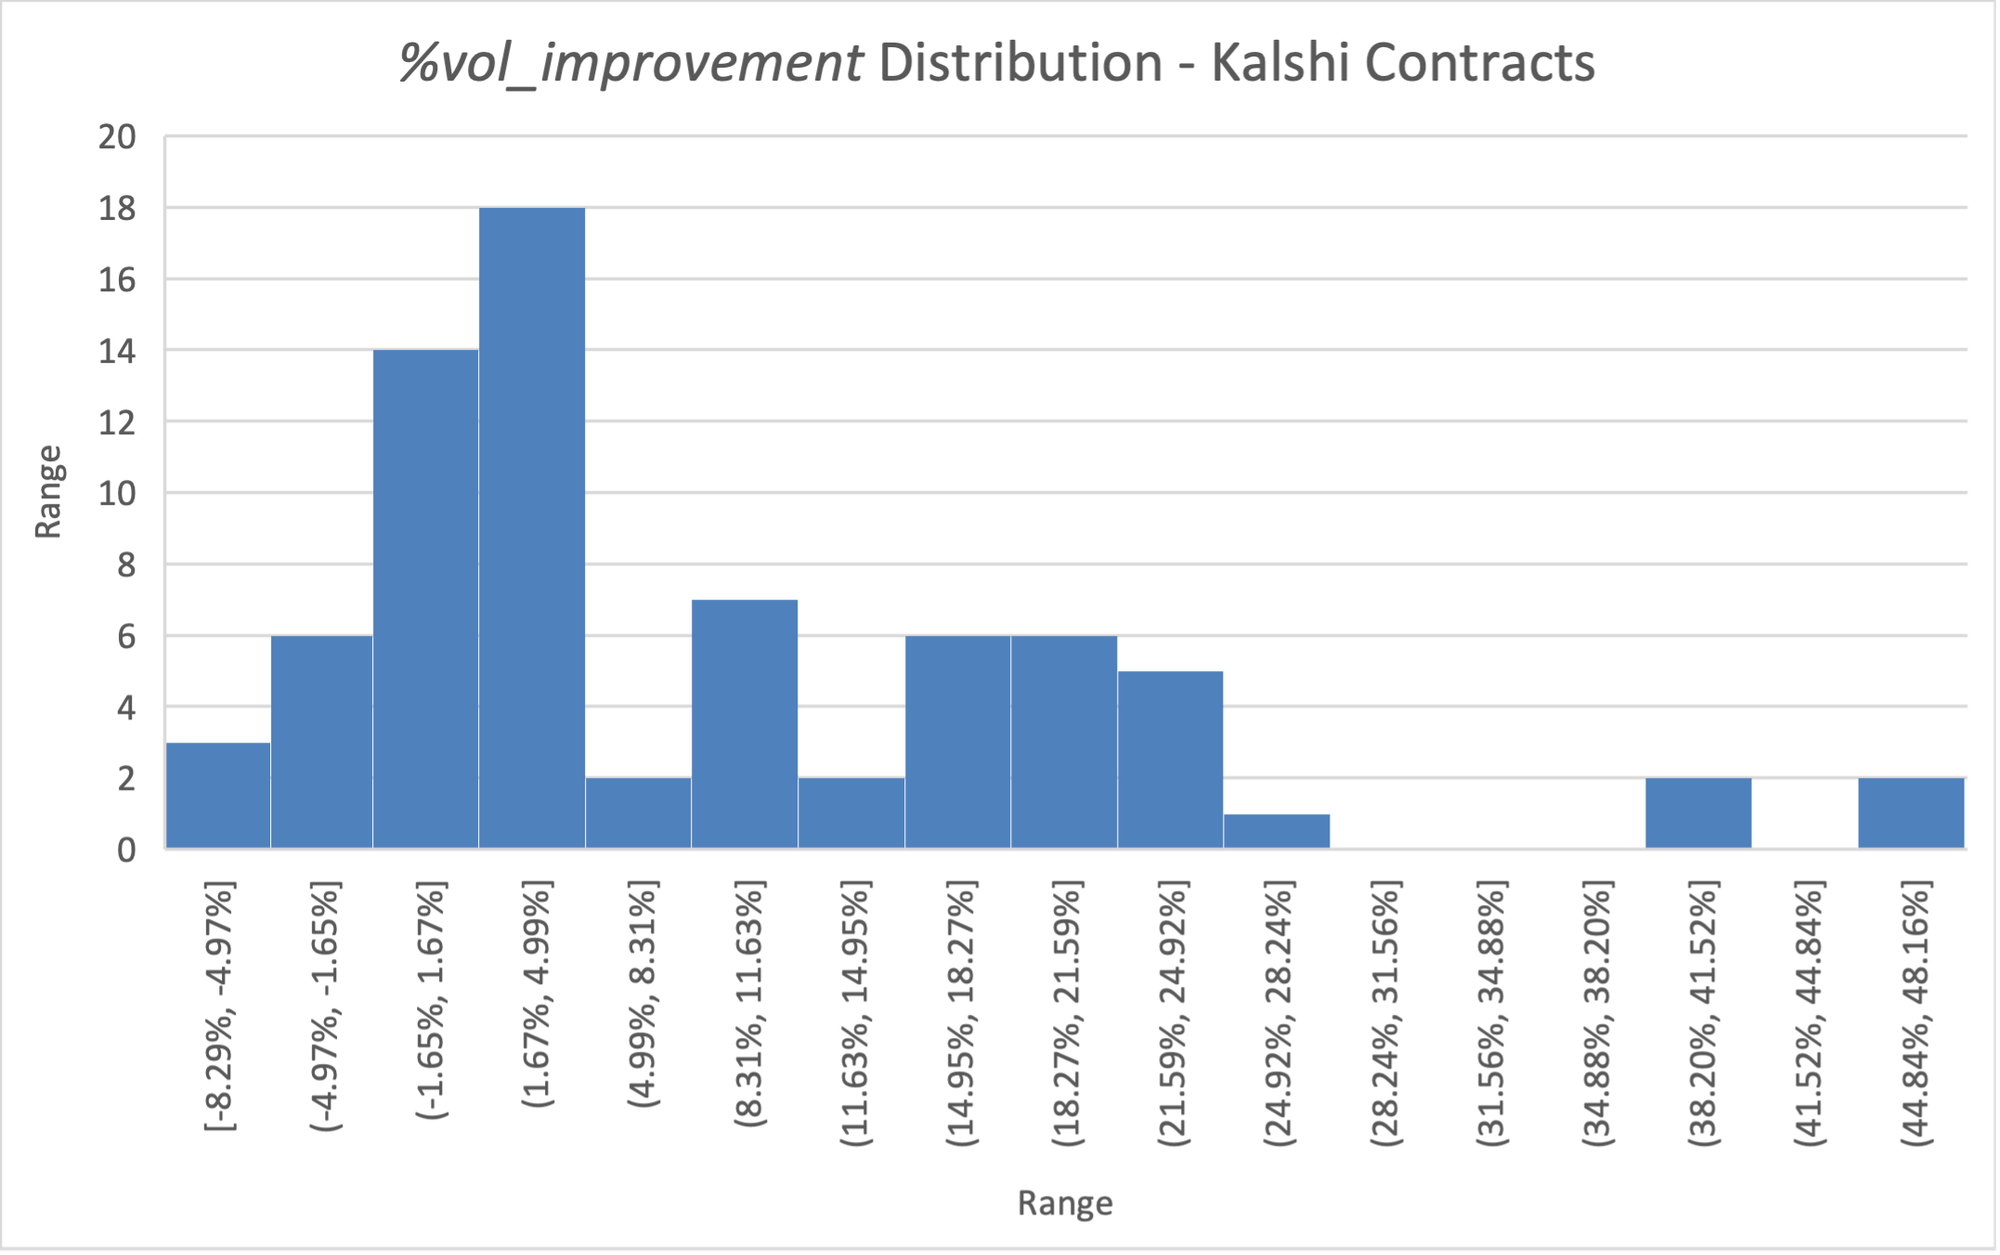
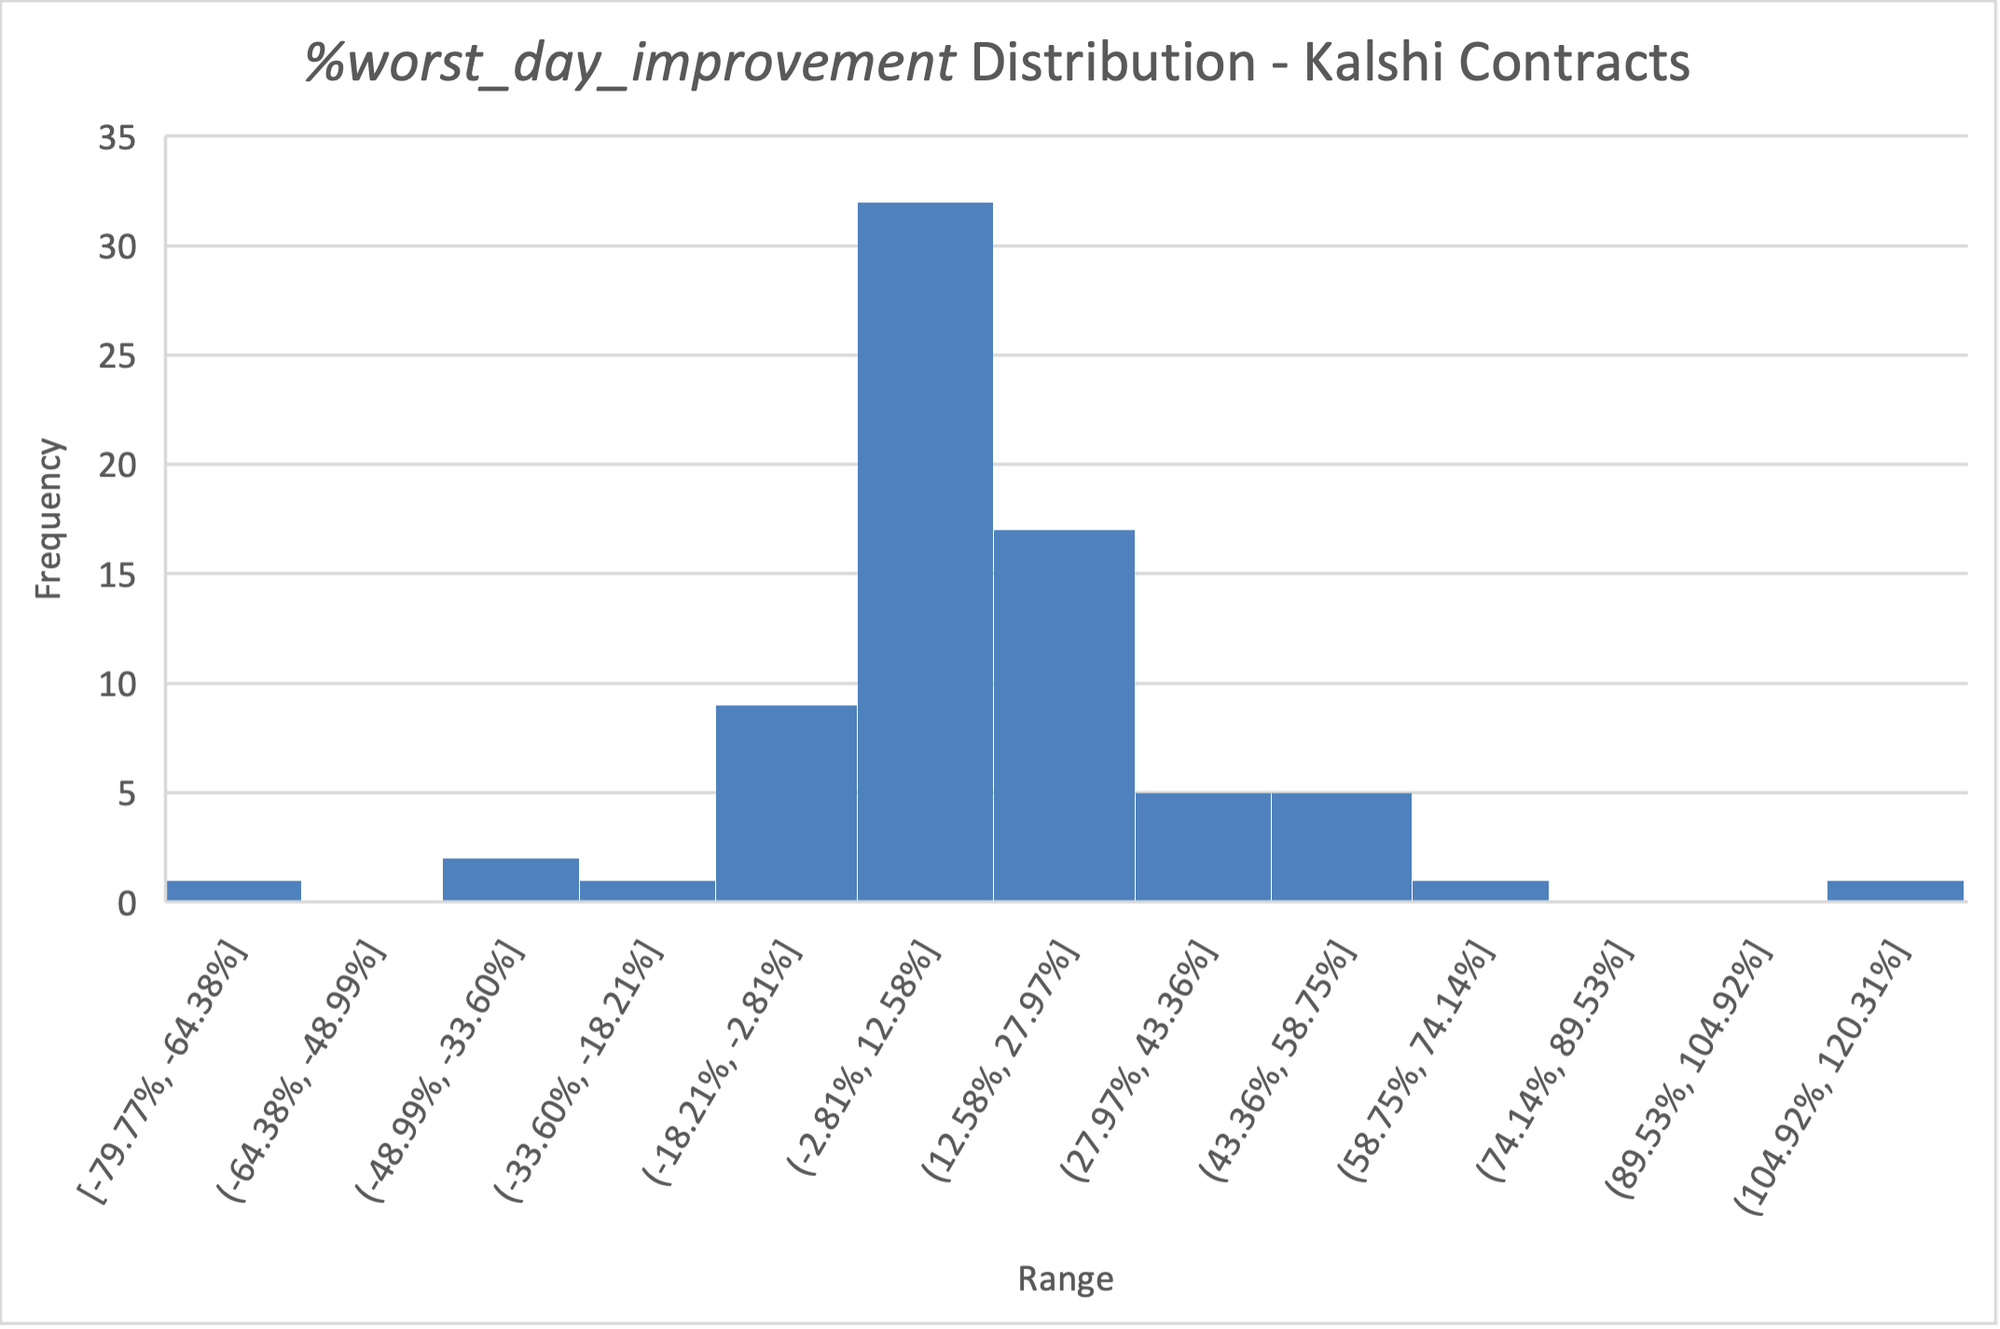
The comparison shows three main patterns.
First, not all event contracts hedge equally well. The strongest headline improvements in volatility often come from traffic-based contracts, but many of these results are based on very short effective samples of only 6 observations as many contracts are weekly contracts, and some of the best-looking volatility reductions are paired with worse worst-day outcomes. That means some contracts look attractive on variance alone but do not actually protect the portfolio on the most adverse days.
Strait normalization contracts
Strait traffic contracts
All contracts
Second, the results confirm that Brent-linked portfolios are easier to hedge than jet-linked portfolios. Across the tested combinations, event contracts generally fit better with crude-related exposures than with outright jet fuel exposure. The airline-style cases often show either weak volatility improvement or a trade-off in which volatility falls but worst-day loss deteriorates.
'Long Brent' portfolios
'Short Brent' portfolios
'Short Jet Kero' portfolios
All portfolios
Third, the more stable and economically interpretable results tend to come from normalization contracts, even though their raw improvements are smaller than the traffic-related contracts. These contracts usually do not deliver dramatic hedging gains, but they are less likely than short-lived traffic thresholds to produce extreme metrics. In that sense, they seem more useful for representing the broader state variable of disruption persistence, rather than for mechanically minimizing short-window variance.
Strait normalization contracts
Strait traffic contracts
All contracts
A practical implication follows. The “best” contract should not be chosen by volatility reduction alone. A more credible hedge candidate is one that improves both overall stability and stress-day performance, while also being supported by a reasonable sample length.
Portfolio Demo Using Polymarket Contracts
I combined the commodity leg with selected Hormuz-related contracts on Polymarket. The portfolio performance metrics are summarized in the Excel file below.
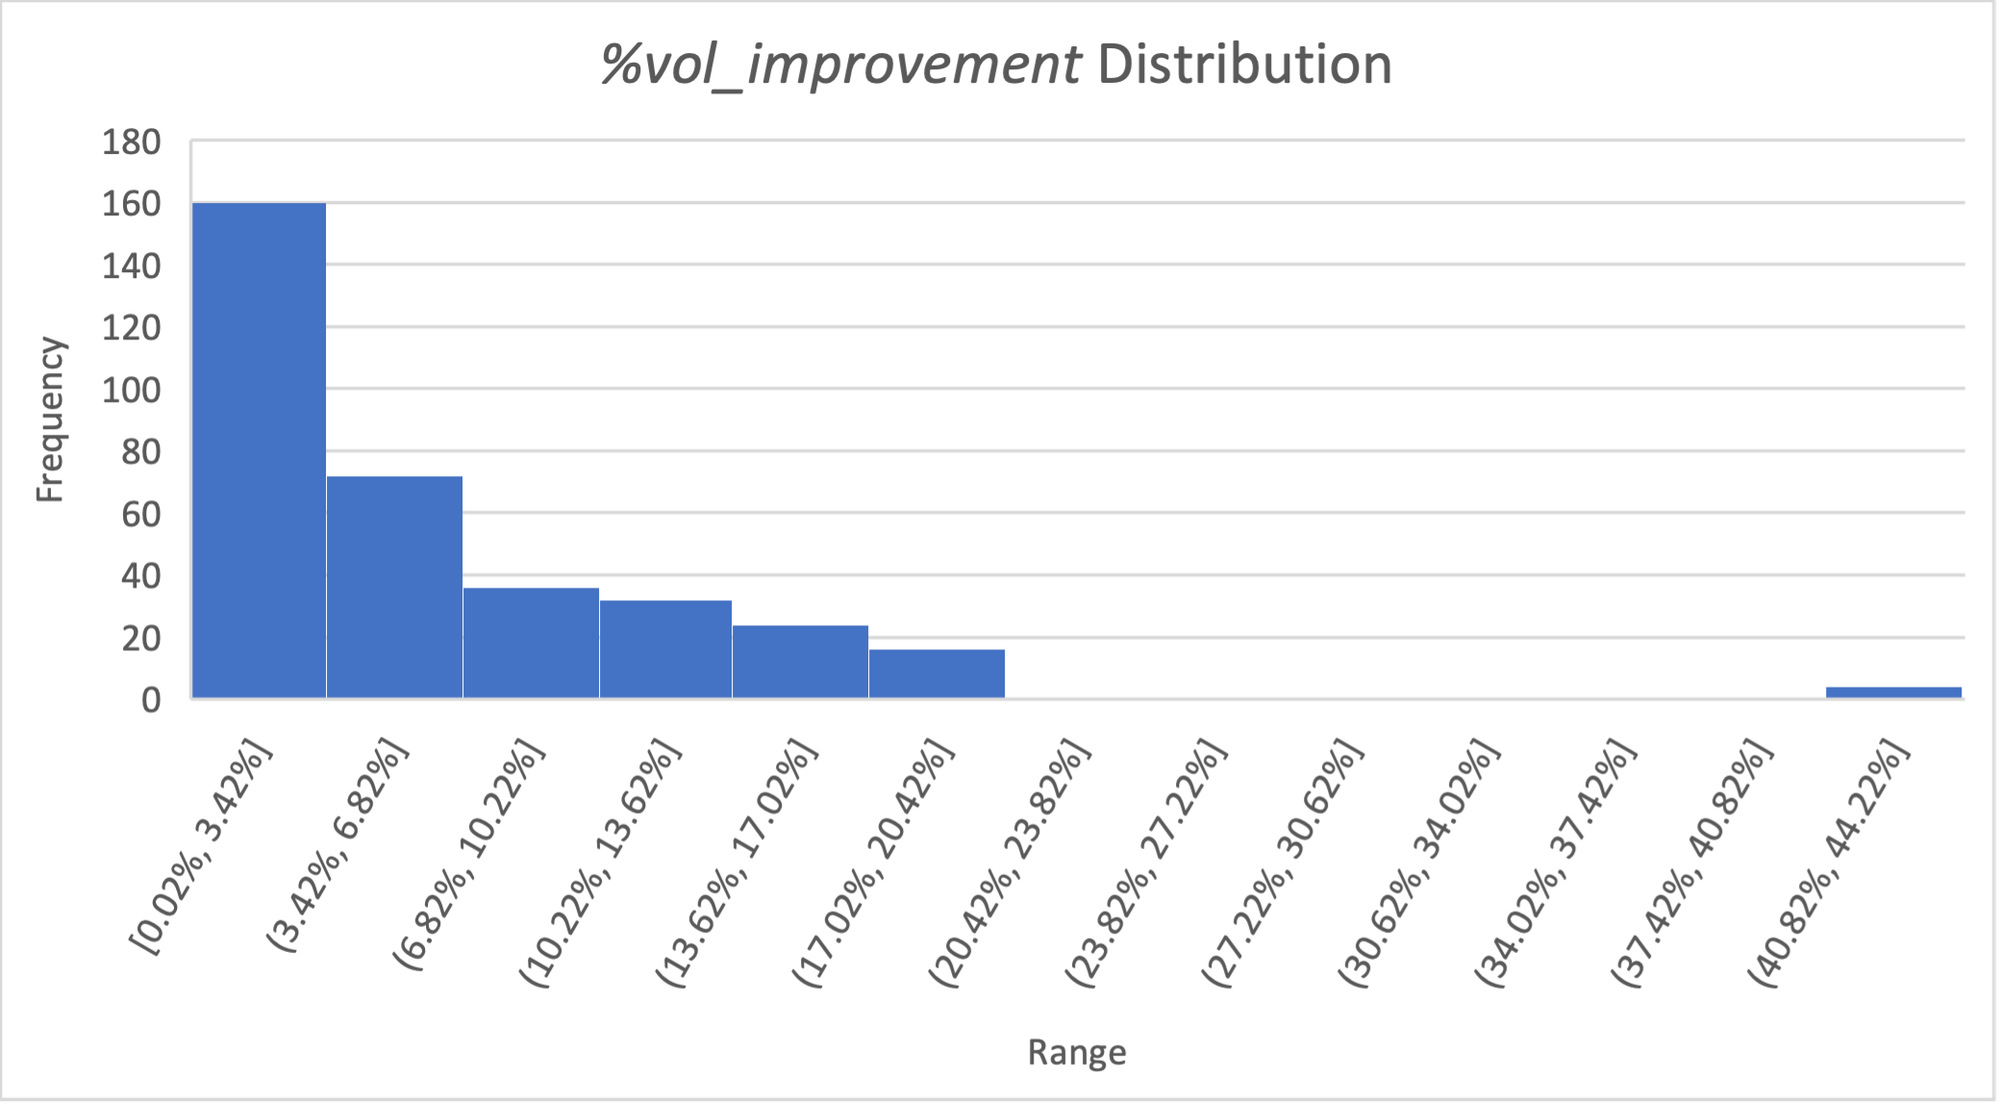
When using Polymarket contracts, the event contracts work much better as hedges for Jet Kero than for Brent. Across the eligible set, the average percentage volatility reduction is about 6.89% for both long and short Jet Kero, versus only about 4.51% for both long and short Brent.
The sample is also fairly short, with 344 eligible combinations ('eligible combinations' means combinations with number of observations greater than 5), a median of 11 observations, and a range of 5 to 22 days, so the strongest results should be treated as directional rather than definitive.
'Long Brent' portfolios
'Long Jet Kero' portfolios
'Short Brent' portfolios
'Short Jet Kero' portfolios
All portfolios
The best-performing hedges are concentrated in ship traffic / ship count contracts and ceasefire contracts. By contrast, the contract family “US escorts commercial ship through Hormuz by...?” looks much weaker on average.
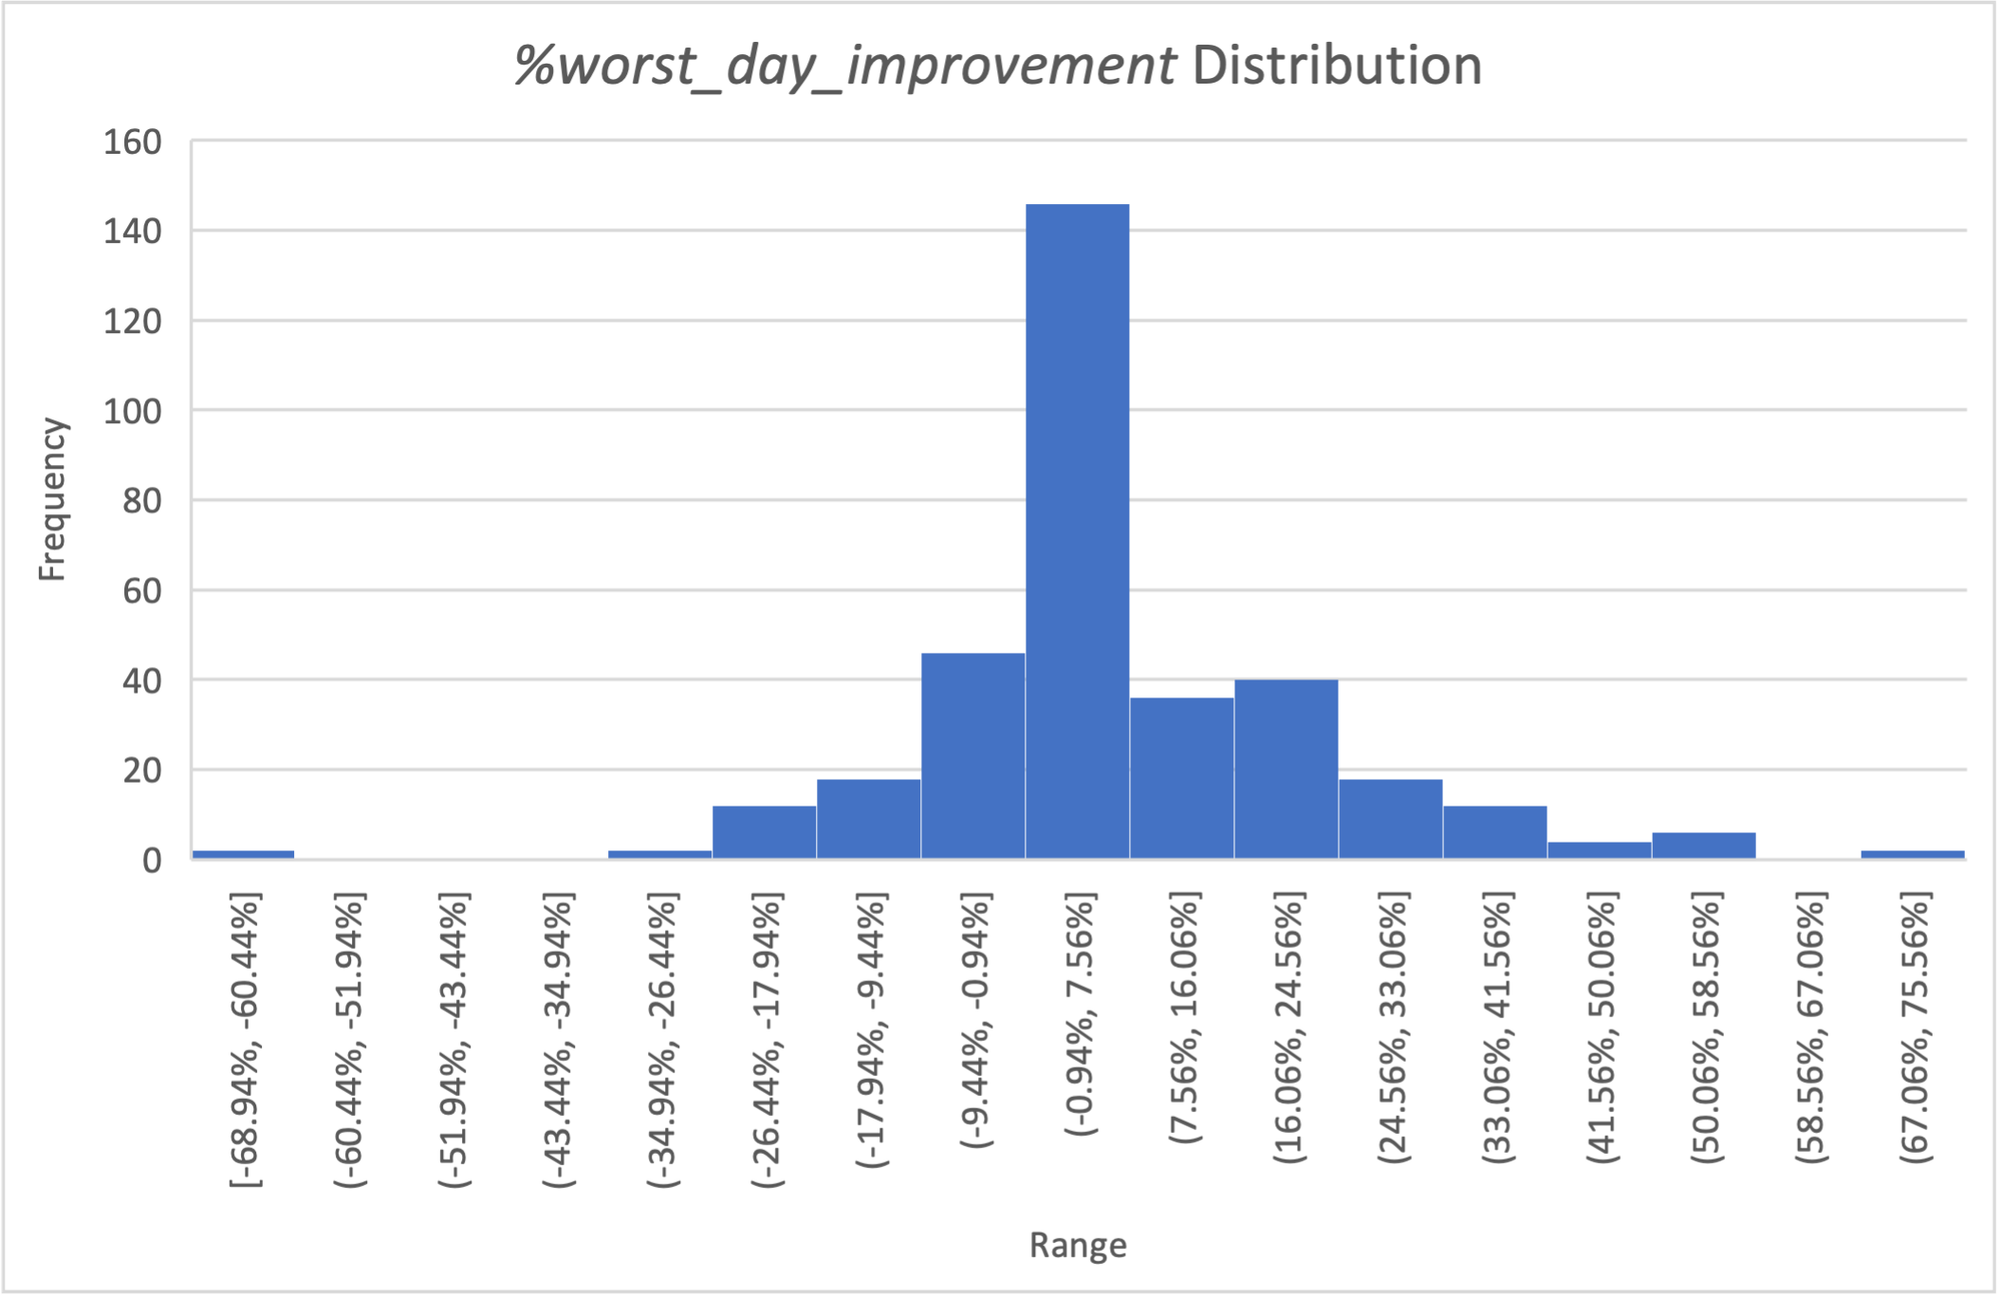
Every eligible combination shows a positive volatility reduction, which is reasonable because the hedge ratio is fitted in-sample by OLS. That means variance reduction is partly mechanical. The more informative metric is 'worst_day_improvement', and here the picture is mixed: 222 combinations improve the worst day, but 108 actually make it worse.
Bottomline
Hormuz event contracts are not fake hedges. But they are not clean hedges either. Their value is narrow, conditional, and highly path-dependent. They work best when they capture something ordinary commodity hedges miss, especially disruption persistence, recovery timing, or a specific operational state. That is why the strongest cases in the article are not broad “bet on Hormuz” trades, but targeted overlays tied to a clear business exposure.
The catch is that event contracts are highly volatile instruments in their own right. In many combinations, the hedge leg is so jumpy that adding it can raise total portfolio volatility rather than reduce it, even when the economic logic looks sound. That is exactly why some portfolios improve on the worst day while still becoming noisier overall. A contract can look brilliant in a summary table and still be a messy hedge in practice.
So the real lesson is not that Hormuz contracts “work” or “do not work.” It is that they work only when the contract design, the underlying exposure, and the sizing method all line up. Used carefully, they can hedge the state variable that commodity markets leave unpriced. Used carelessly, they just add another source of volatility to a book that was already hard to manage. These are not replacements for commodity hedging. They are precision tools, and precision tools cut both ways.
Weather Prediction Markets Are Booming. Can They Improve Forecasts?
Disclaimer: The content is for informational purposes only. You should not construe any such information or other material as legal, tax, investment, financial, or other advice. Nothing contained in this article constitutes a solicitation, recommendation, endorsement, or offer by the author(s) or any third party service provider to buy or sell any securities or other financial instruments in your or in any other jurisdiction in which such solicitation or offer would be unlawful under the securities laws of such jurisdiction. The author(s) report(s) no conflict of interest.