Federal Reserve officials will enter this week’s policy meeting facing a renewed surge in price pressures, making the decision over whether to hold or raise interest rates unusually close — and potentially contentious.
Escalating tensions in the Middle East have sent oil prices sharply higher, overshadowing a softer-than-expected June inflation report that had appeared to give policymakers room to keep rates unchanged. At the same time, strong demand linked to the artificial intelligence boom and the Trump administration’s latest tariff announcements have added to concerns that inflation could remain elevated.
As a result, Fed watchers see a growing risk of dissent at the July 28–29 meeting if officials once again vote to leave policy unchanged.
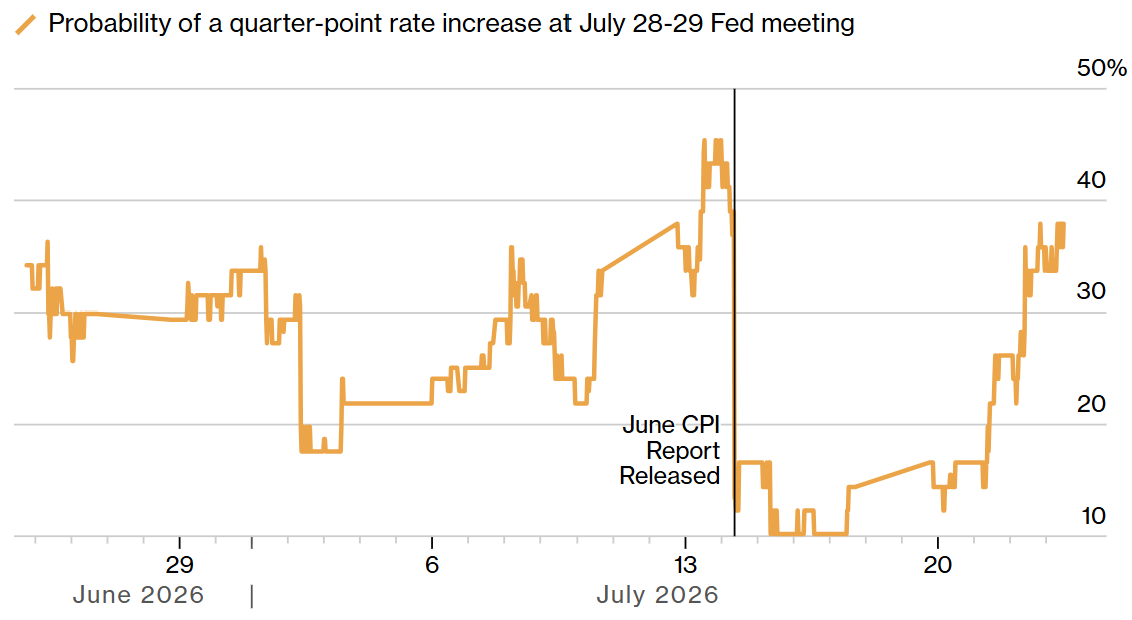
Investors have also increased their bets on an immediate rate increase. At one point last week, federal funds futures implied a probability of close to 40% that the central bank would raise rates at this week’s meeting, according to Bloomberg.
Based on pricing in federal funds futures contracts. Source: Bloomberg
A growing number of policymakers have outlined a rationale for why they support higher rates now, or could soon.
Dallas Fed President Lorie Logan earlier this month called for modestly higher rates, citing her view inflation isn’t heading sustainably back to the Fed’s 2% goal. Cleveland Fed President Beth Hammack also chimed in recently, saying “there is no conflict” in the Fed’s mandates and inflation is a bigger concern than employment currently. Both will vote on this week’s interest-rate decision and could dissent if officials opt to hold steady.
“It is clear listening to the Fed officials that you have a small group — like Logan, Hammack — who probably are ready to get going,” said Claudia Sahm, chief economist at New Century Advisors LLC. “And then there’s a pretty large group that wants to see more improvement — and soon.”
Fed Chairman Kevin Warsh has reaffirmed the Fed’s commitment to reducing inflation, vowing on Capitol Hill this month to use the central bank’s tools to achieve price stability. But his reluctance to offer specifics on how he plans to use those tools has kept markets guessing about where rates are headed — even in the near term.
Will the Federal Reserve raise interest rates at its July 28–29 meeting?
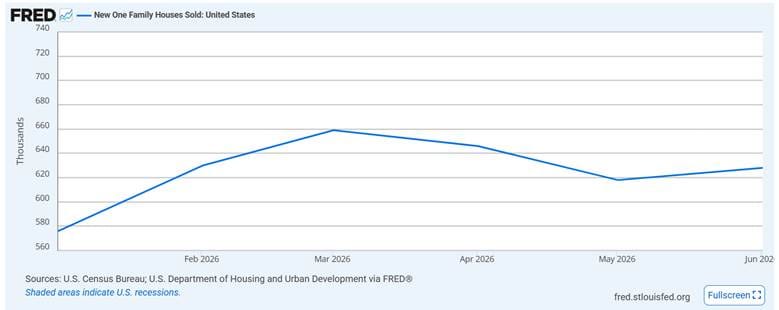
June’s gain partly reversed the declines in April and May, leaving the sales pace below its March peak.
On the surface, this looks like a housing market getting more affordable. But within a ±14.8% margin of error, it could just as easily disappear in the next revision.
The sticker price can fall without the home getting any easier to carry, so let’s follow June’s median home from the sales sheet to the buyer’s monthly bill.
June new-home sales: turning point or head fake?
Bullish: demand is starting to turnResult
30.73%
Cautiously positive: the decline may be stabilizingResult
26.49%
Neutral: it is probably statistical noiseResult
33.51%
Bearish: one small bounce changes nothingResult
9.27%
755 Polls
EndedTBD
The rate is doing more work than the price tag
The latest Redfin data puts the typical down payment among mortgage-financed buyers at 15%. Applied to the median new home, $398,300, down 2.7% from a year ago and down from $412,000 in May, that is $59,745 upfront and a $338,555 mortgage.
At the latest 6.58% average 30-year fixed rate, principal and interest comes to roughly $2,158 a month.
This is before property taxes, insurance or mortgage insurance.
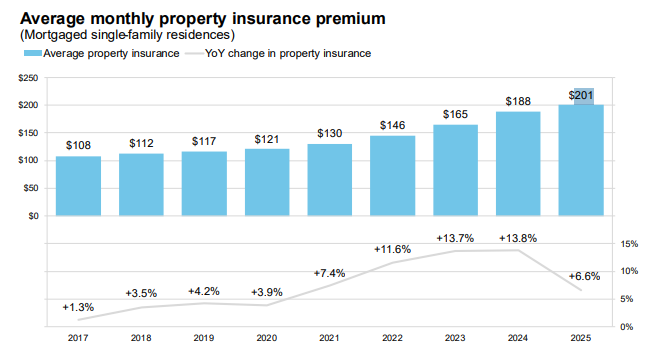
Using the latest 0.9% national effective property-tax rate adds about $299 monthly. The average homeowners insurance premium reached roughly $2,412 annually in 2025, adding another $201. Because the buyer put down less than 20%, an illustrative 0.6% private mortgage-insurance charge adds about $169.
The full monthly cost therefore lands near $2,827. Maintenance, HOA fees, utilities and closing costs are still outside this number.
Cost item
Amount
How it
affects the buyer
Purchase
price
$398,300
Headline
price
15% down
payment
$59,745
Paid upfront
Mortgage
$338,555
Amount
financed
Principal and
interest
$2,158/month
Mortgage
payment
Property tax
$299/month
Based on
illustrative 0.9% rate
Homeowners
insurance
$201/month
Based on 2025
average
PMI
$169/month
Illustrative
0.6% charge
Total
modeled payment
$2,827/month
PITI plus
PMI
So a home carrying a $398,300 price tag requires nearly $60,000 upfront and approximately $34,000 a year in mortgage-related payments.
Does a larger down payment solve the problem?
It lowers the payment, but it does so by moving more of the burden forward. Putting down 20% lowers the payment to about $2,533 by reducing the loan and removing PMI, but requires $79,660 at closing.
The 20% buyer saves almost $300 a month compared with the 15% buyer, but the 20% buyer also has nearly $20,000 less available for repairs, emergencies, or another investment.
This is a real improvement in monthly affordability, but it is not free. You tie up liquidity for a lower carrying cost.
The comparison with June 2022: The rate erased a $33,400 price discount
On price alone, today’s buyer gets the better deal. The latest revised Census data put the June 2022 median new-home price at $431,700, compared with $398,300 today. This makes the current home $33,400, or 7.7%, cheaper.
With 15% down, the lower price saves today’s buyer $5,010 upfront and reduces the mortgage by $28,390. But the rate is 0.88 percentage points higher, which consumes the benefit of that smaller loan and leaves the buyer paying about $28 more every month in principal and interest.
June 2022
June 2026
Difference
Median
new-home price
$431,700
$398,300
-$33,400
15% down
payment
$64,755
$59,745
-$5,010
Mortgage
$366,945
$338,555
-$28,390
Mortgage rate
5.70%
6.58%
+0.88 points
Monthly
principal and interest
$2,130
$2,158
+$28
The home got cheaper, yes, but financing it became expensive enough to take the entire saving back.
Builders are increasingly subsidizing the payment
The July NAHB survey showed 63% of builders using sales incentives. Separately, 37% reported cutting prices, with an average reduction of 6%.
A 6% reduction on the median home saves approximately $158 a month under the same assumptions. An illustrative permanent rate reduction from 6.58% to 5.58% saves about $219 in principal and interest.
Both make the home easier to carry. But they also reveal how weak the underlying affordability remains. If the deal only works after the builder lowers the rate or absorbs part of the upfront cost, the market-rate payment is still too high. The buyer is getting relief, but the builder is supplying it.
If mortgage rates stay around 6.5%, where does the next concession come from?
Bigger rate buydownsResult
4.70%
Deeper price cutsResult
16.71%
Smaller, cheaper homesResult
5.74%
Buyer demand breaks lowerResult
72.85%
383 Polls
EndedTBD
What would show genuine affordability relief?
As discussed above, a lower sale price reduces the amount borrowed, but this benefit can be (and was) absorbed by a higher mortgage rate, a smaller down payment, mortgage insurance and rising property taxes and homeowners insurance.
The relevant question is therefore whether the buyer’s total monthly cost begins falling, not whether the median price falls again.
The first trigger to look for is the 30-year mortgage rate, published weekly by Freddie Mac. At 6.58%, principal and interest on the median new home with 15% down is about $2,158 a month. A drop toward 5.7% would reduce this by roughly $190 and bring financing costs closer to their June 2022 level.
The second is builder incentives in the monthly NAHB survey. If sales hold up while incentive use moves below 60% and fewer builders need to cut prices, it would suggest buyers can carry the payment with less support. If incentives keep rising, the lower sale price is still not sufficient on its own.
The third is the combination of sales and months of supply in the next Census releases. A few months of stronger sales alongside supply falling from 9.3 months to below nine would indicate that lower prices and financing support are broadening demand. If prices continue falling while sales remain near 628,000 and supply stays above nine months, builders are making homes cheaper without making them affordable enough to clear the market.
These three indicators separate a lower home price from a real affordability improvement: financing costs must fall, buyers must need less support and lower monthly payments must begin translating into stronger demand.
Korean, global tech companies to pursue partnerships worth more than $950 billion in total
According to Korean news sources, the largest deals involve Samsung Electronics and SK Group, with the former signing a $200 billion deal with Broadcom and the latter a $750 billion agreement with Nvidia and other firms.
Korean companies and global technology giants agreed to pursue partnerships worth more than $950 billion combined during President Lee Jae Myung’s visit to San Francisco, the Blue House said on Friday. Chief presidential secretary for policy Kim Yong-beom announced the agreements — which he said emerged from discussions that took place at the San Francisco AI Summit — during a briefing at the San Francisco press center, some quantitative items as below:
· Samsung Electronics signed a memorandum of understanding with Broadcom to supply $200 billion worth of advanced memory chips over the next five years and cooperate on AI chip production.
· SK agreed to supply $750 billion worth of advanced memory chips to Nvidia and other global tech companies over the next five years.
· Korean and global companies also agreed to pursue projects involving multiple AI data centers with a combined capacity of about 5 gigawatts and around 2 million GPUs.
· Nvidia will support SK hynix in constructing and expanding data centers with a combined 2 gigawatts of capacity, while SK hynix will prioritize allocations of Nvidia’s latest Vera Rubin systems.
· SK Telecom will work with Anthropic on gigawatt-scale AI data center projects based in Korea and related investments.
What will KOPSI reacts in the last week of July 2026?
Intel beat by $1.7 billion, posted its fastest quarterly revenue growth since 2011, and still watched the stock's after-hours pop land short of the 12.52% swing options traders had already priced in for the day.
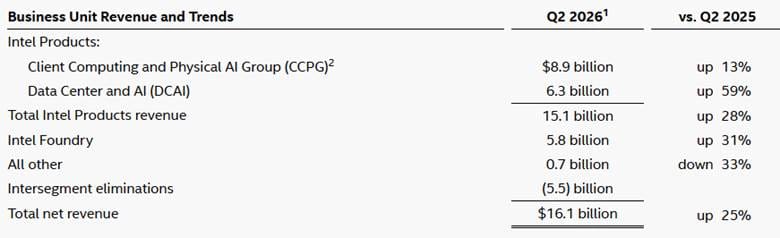
Data Center and AI (DCAI) revenue hit $6.3 billion, up 59% year over year, year-over-year growth accelerated from 22% in Q1 to 59% in Q2.
So does that settle it?
Not quite.
Nobody's arguing anymore about whether AI is pulling CPU demand higher. Agentic workloads add CPU-intensive orchestration, tool execution, data processing and security around the model inference that still runs primarily on GPUs. Intel management said training systems commonly use seven or eight GPUs per CPU, compared with roughly three or four for inference, while agentic and multi agent deployments could move toward parity or even become more CPU-intensive. AMD has described a similar shift from approximately 1:8 or 1:4 toward 1:1, although these remain company estimates rather than independently measured industry-wide ratios.
What the market is still deciding is whether Intel is winning sockets, or just standing in the way of a check written to the whole industry.
My read is that the demand is Intel's to bank, but the share is not yet Intel's to claim. These are two different clocks, and Thursday's call kept them running at two different speeds.
Intel just posted its best quarter in 15 years. Were you expecting a beat this big?
Yes, saw it comingResult
66.48%
No, this surprised meResult
33.52%
1,256 Polls
EndedTBD
The earnings beat was broader than DCAI
The CPU thesis is that deploying AI creates considerably more computing work around them, and Q2 results are consistent with this.
DCAI's operating margin hit roughly 40% of revenue, up from 31% just one quarter ago. Intel attributed the improvement to higher revenue, better product margins and lower operating expenses. At the company level, better yields, average selling prices and product mix lifted gross margin, while shorter factory cycle times created additional volume.
Together, these signals suggest AI-related CPU demand is extending beyond a narrow training buildout. This makes this a higher-quality beat than another quarter driven mainly by price.
This is exactly what the bull case ordered, but it's also a concentration risk. If DCAI cools from here, there isn't much elsewhere in the business to pick up the slack.
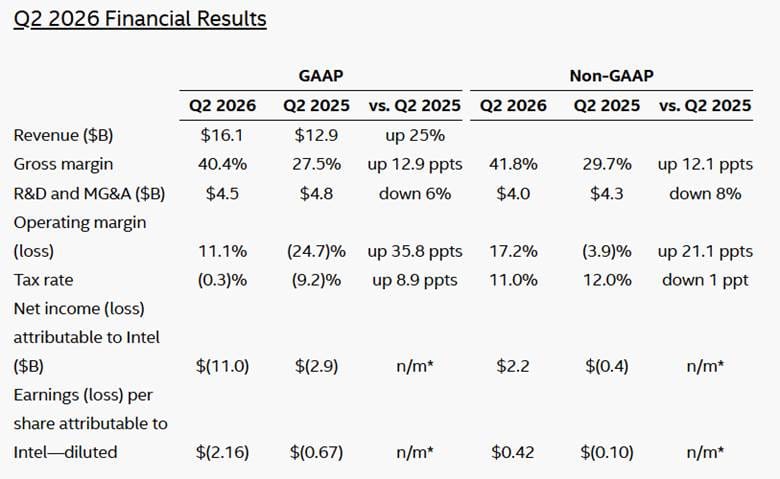
One number needs unpacking before it spooks anyone reading the release cold: GAAP EPS was a loss of $2.16, compared with a loss of $0.67 a year earlier, despite much stronger operating performance.
The headline $11.0 billion GAAP net loss did not represent an equivalent operating cash loss. Intel generated $1.8 billion of GAAP operating income and $7.0 billion in operating cash flow, but recorded a $12.5 billion non-cash mark-to-market charge on escrowed shares tied to its agreement with the U.S. government. Because the liability is linked to Intel shares, a higher stock price can increase the accounting charge, all else equal.
Non-GAAP net income of $2.2 billion therefore provides a clearer view of underlying operations, although it also excludes stock-based compensation, restructuring charges and several other items.
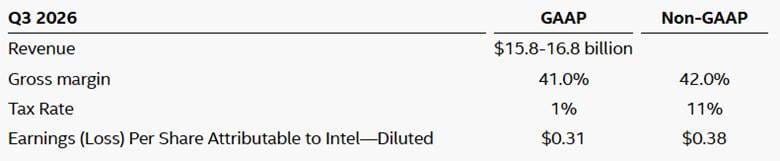
Q3 revenue guidance of $15.8-16.8 billion came in well above the roughly $15.1 billion consensus, and Intel raised its 2026 capex outlook from about $18 billion to more than $20 billion, with 2027 spending expected to run significantly higher still.
The increase is a meaningful signal of management’s demand confidence, particularly because Intel cited long-term customer agreements and stronger purchase commitments. It is not proof, however, that every dollar of additional capacity is covered by firm orders. Intel is now committing multi-year capital to capacity that only pays off if the demand it's currently rationing is still there in 2027 and 2028.
But there’s a gap: AI CPU demand vs. Intel share gain
Asked point-blank about server share against AMD and Arm, Tan said Intel is still behind on some performance metrics and pointed to Clearwater Forest, Diamond Rapids and Coral Rapids roadmap as the way to close that gap eventually; a project, not a result already on the books.
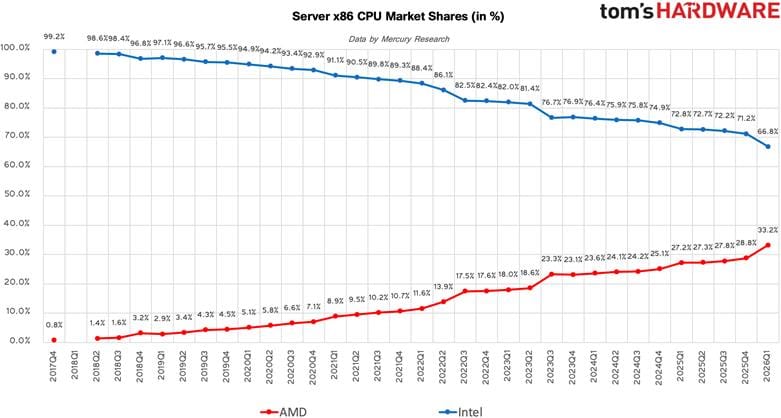
Mercury Research put AMD at 33.2% of x86 server units and 46.2% of x86 server revenue in Q1. This left Intel with 66.8% of units, but only 53.8% of revenue. Put simply, Intel still ships twice as many x86 server processors, yet AMD is close to matching it in sales because it captures more revenue per unit.
On Arm, his tone softened into something closer to a business partner than a rival, useful for foundry work and IP, not a threat to Xeon.
Pressed to quantify the CPU-to-GPU ratio shift underpinning the whole demand thesis, Zinsner declined to give a number, pointing instead to the long-term agreements Intel is now signing with server customers, some with locked-in pricing, others structured around volume. It’s real evidence of demand visibility, but it is not direct evidence that agentic AI is causing the growth. Nor is it evidence of Intel share gain, although management did not claim that it was.
Intel guided PC volumes sub-seasonal for the second half, pointing to memory costs and supply constraints. I made this same case last week: the physical shortage still has room to run, but the stocks trading on it have gotten pickier about rewarding good news. Intel just handed this same argument a second data point, from a different aisle of the same supply chain.
What to watch next
To confirm a broader CPU cycle, demand needs to stay strong after today’s supply constraints ease and as more inference and agentic systems enter production. Intel’s separate challenge is turning that demand into market share and better margins.
My earlier capex analysis made the same distinction: suppliers benefit while spending occurs; buyers must justify it later through revenue and productivity.
Mercury’s Q2 figures, once released, will be the cleanest test of whether Intel’s record DCAI growth stabilized its x86 share. They will not capture Arm-based servers, so they are an important test, not a complete one.
Third-quarter guidance hints that conversion may become harder. The $16.3 billion revenue midpoint is only slightly above the second quarter’s $16.1, while the 42% adjusted gross-margin forecast is just 0.2 percentage points higher.
Holding or beating these numbers would show the company can sustain the higher run-rate after the Q2 supply release. A miss would suggest the quarter pulled forward demand or exhausted the easiest manufacturing gains.
Chances are, we’re looking at a plateau next quarter, not an immediate second leg. This would not invalidate the broader CPU cycle, but it would show that Intel’s ability to capture it is still constrained by supply, product mix, and competitive share.
Following a similar pattern RTX's 2Q2026 results, like its peer Lockheed Martin, beat market expectations. Geopolitical uncertainties raise demand, while international orderbook build up is a tailwind. Engines/products issue are reported to be turning for better. Full-year outlook is raised.
Will RTX's order backlog increase again in 3Q2026?
YesResult
100.00%
NoResult
0.00%
2 Polls
EndedTBD
TL;DR:
Revenue and adjusted EPS both cleared the Street decisively. Adjusted EPS of $1.89 beat the Zacks Consensus Estimate of $1.66 by 13.9%, and revenues rose 14.5% year over year to $24.71 billion, beating the consensus mark of $22.83 billion by 8.2%.
Backlog hit a fresh record on broad-based order strength. Backlog surged 22% year-over-year to a record $289 billion, driven by sustained defense spending amid global conflicts and strong commercial demand, with $43 billion of new awards in Q2 alone, nearly $20 billion of that at Raytheon.
The GTF/powder-metal fleet issue is measurably improving, not just stabilizing. Aircraft-on-ground levels were down 25% year-to-date due to a 40% increase in MRO output, and the number of engines requiring open inspection came in faster and better than sell-side analysts had modeled — a genuine operational beat on the single biggest overhang for the stock over the past two years.
Defense bookings were exceptionally strong internationally. Raytheon's performance was bolstered by over $10 billion in international awards during the first half, and Raytheon this month announced a collaboration with multiple NATO nations to identify additional European suppliers for AMRAAM components to accelerate deliveries.
Guidance was raised on every metric, not just reaffirmed. Adjusted full-year sales guidance lifted to $95.0–96.0 billion, EPS to $7.10–7.25, and free cash flow to $8.50–8.75 billion — the EPS guide increase of $0.40 at the midpoint is large enough to signal real conviction in H2, not just conservatism being relaxed.
Key Debates:
Is the GTF/powder-metal saga actually resolved, or just past its worst quarter?
Is deleveraging or shareholder return the near-term capital priority?
How much of the defense growth is booked backlog versus not-yet-recognized framework demand?
RTX 2Q2026 segmental results
Check out our post of RTX's peer - Lockheed Martin results review:
Driven by geopolitical demand shock, strategic positioning towards technology, and increased operating efficiency, Lockheed Martin reported stronger-than-expected 2Q2026 results; full-year outlook is also raised.
Will Lockheed Martin report higher order backlog by 3Q2026?
YesResult
100.00%
NoResult
0.00%
2 Polls
EndedTBD
TL;DR:
Revenue and EPS both cleared the Street by a wide margin. The company reported profit of $1.84 billion, or $7.94 per share, on revenue of $20.06 billion, versus analysts' expectations of $7.22 per share on $19.43 billion — a beat of roughly 10% on EPS and 4% on revenue.
Free cash flow swung dramatically positive. Cash from operations reached $3.2 billion, up from $201 million a year earlier, and free cash flow was $2.9 billion, compared to negative $150 million in the prior-year quarter — one of the largest quarter-over-quarter cash generation reversals in recent memory for the name.
Backlog hit a record and is now the dominant part of the story. The company reported a record backlog of $230.4 billion, up from $193.6 billion at year-end 2025, boosted by $65 billion in new orders during the quarter, with total backlog up 38.3% from $166.5 billion a year earlier.
Operating margin expanded sharply. Operating margin came in at 12.4%, up 8.2 percentage points year on year, reflecting the absence of last year's program charges plus genuine production efficiency gains.
Guidance was raised across every major line, not just reaffirmed. Full-year 2026 sales outlook was lifted to approximately $79.75 billion to $81.75 billion, up from $77.5 billion to $80.0 billion, and full-year diluted EPS guidance was raised to $29.95–$30.65 from $29.35–$30.25. All major segments increased their sales outlooks, pointing to company-wide strength rather than a single-line story.
Key Debates:
Is the margin recovery structural or an easy comp?
How durable is the demand wave versus geopolitically-driven and potentially lumpy?
"These results are powered by consistent performance on the commitments we've made and by our investments to support the missions our customers will face next. Over the quarter, we took a major step forward in transforming munitions production, putting the framework agreements we announced earlier this year into action by signing a $35 billion multi-year contract with the Missile Defense Agency for THAAD. We continue to innovate at the speed our customers' missions demand, taking our Sanctum counter-drone system from concept to successful live fire testing in just 45 days by combining a battle manager, radar, launcher, and combat-proven missile into one engagement chain. And, we are investing strategically to strengthen global defense manufacturing capabilities through our collaboration with General Motors Defense in the U.S. and our agreement with Rheinmetall to co-produce ATACMS in Europe."
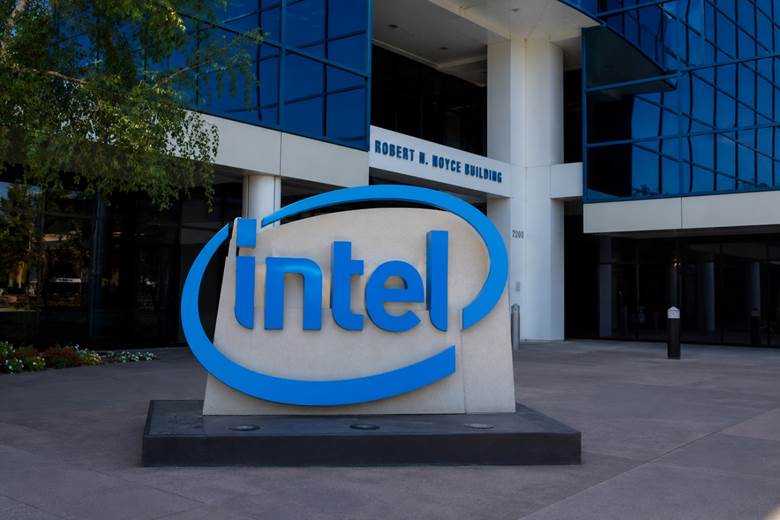
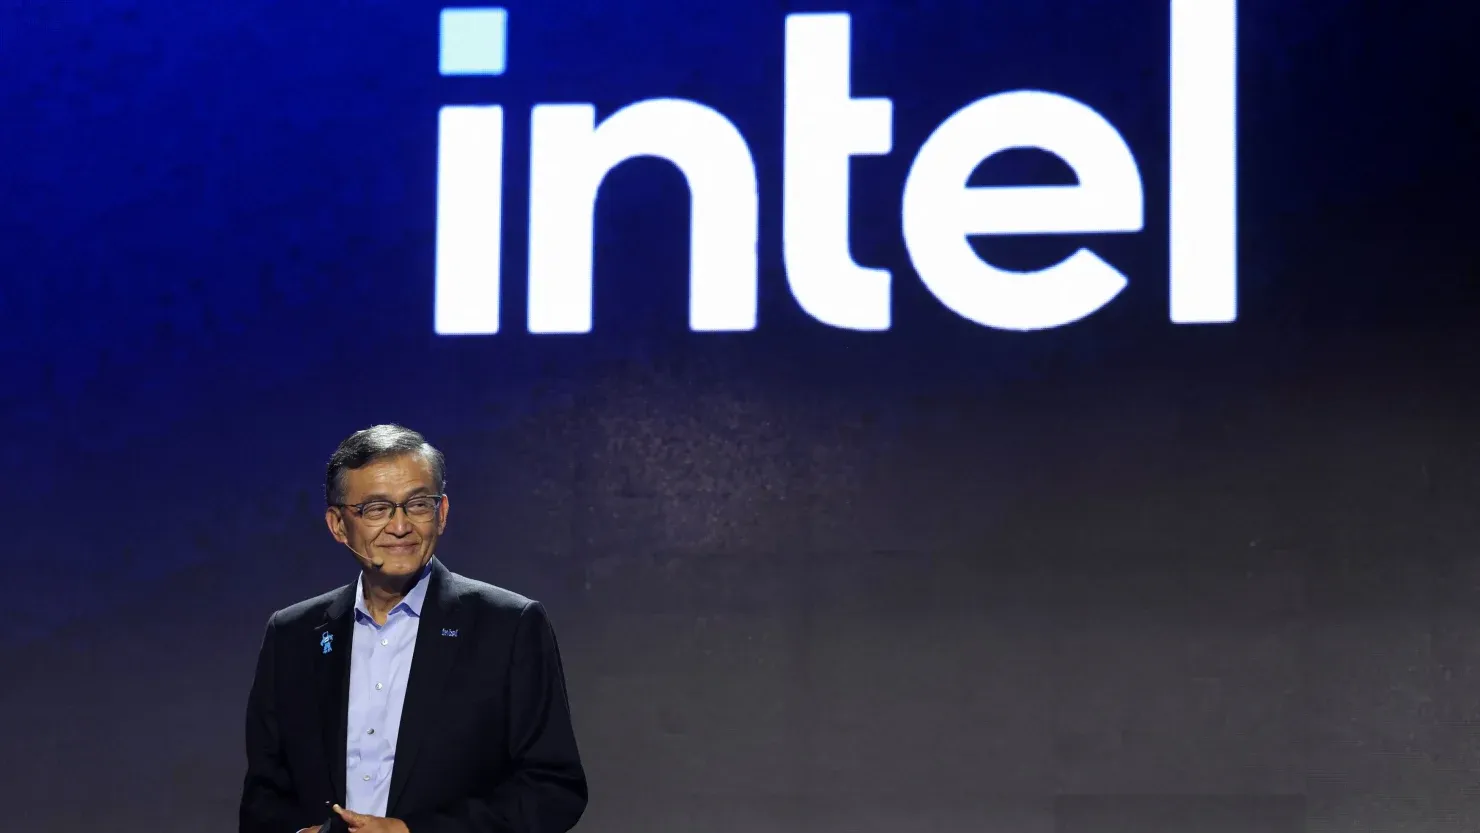
Intel’s stock jumps as chipmaker rides AI boom to fastest revenue growth in almost 15 years (July 23, 2026, after trading hours, local time).
In what price range will Intel's stock price close on July 24, 2026?
below 105Result
50.00%
105 to 110Result
0.00%
above 110Result
50.00%
2 Polls
EndedTBD
TL;DR:
AI/DCAI acceleration is real and broadening. AI-driven businesses collectively grew over 70% YoY and now contribute roughly 70% of total revenue, and Intel said its data center operations cannot keep up with orders, leaving the company unable to fully meet customer demand — a supply-constrained, not demand-constrained, problem.
18A yields are genuinely improving. Yields on 18A reportedly climbed to about 85%, up from roughly 65% the prior quarter, and Intel was the first company to deliver high-volume logic chips using High-NA EUV, per ASML, with 85% yields now comparable to TSMC N2's ~90%.
Credible external validation of foundry. Apple and Microsoft have both confirmed as 18A design partners, and Panther Lake shipped on 18A across 200+ OEM designs. External foundry revenue nearly doubled QoQ ($174M → $293M), the first real proof point that IFS isn't purely an internal cost center.
Beat quality was broad, not just a one-line surprise — CFO Dave Zinsner said the quarter exceeded guidance on higher factory yields and faster production cycles, and management is "meaningfully increasing investments in equipment, clean room space, and substrates" to chase demand rather than defend margin.
Key Debates:
Is 18A actually solving the yield problem, or is the market front-running a headline number?
What's the expectation on IFS going foward?
Intel vs AMD in AI/data center - how's the competition?
Does the CapEx ramp ($20B→more in 2027) get rewarded or penalized?
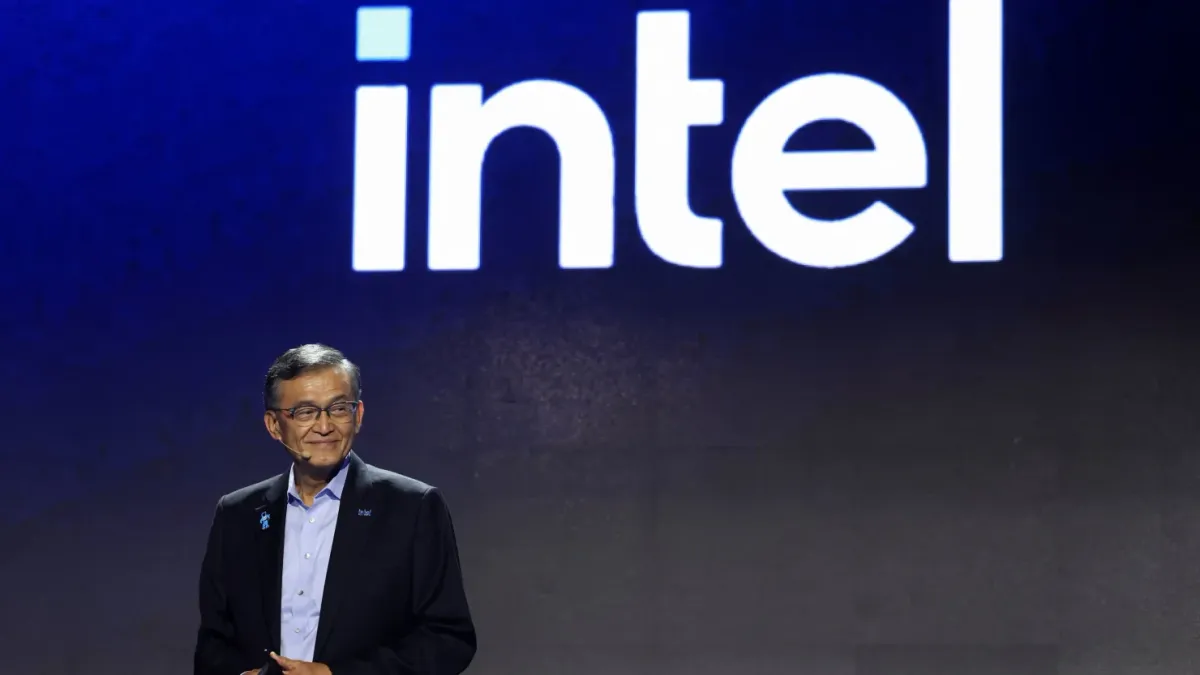
“AI is driving unprecedented demand for compute, and as we continue to execute, Intel is well-positioned to capture sustainable growth across our CPU franchise, ASICs, advanced packaging and vast wafer foundry network,” said Lip-Bu Tan, Intel CEO. “Our Q2 results represent our strongest revenue growth in more than fifteen years, enabled by greater speed, accountability, and customer focus.”
Intel also said it’s starting to craft long-term agreements with customers for its server CPUs, some with pricing locked in and others focused on chip volume.
It’s a move that’s becoming common, particularly in memory, as vendors try to preserve current high pricing and market power in case the AI market turns. Intel said it had reached 10 long-term agreements, and CFO David Zinsner said the company is supply constrained, with data center customers demanding more than it can produce.
“Customers continue to signal a strong and sustainable spending environment,” Zinsner said on an earnings call with analysts.
Revenue in the company’s client computing group, which makes chips for PCs, rose 13% to $8.9 billion. It’s still Intel’s biggest unit, but the robust growth is coming from its data center business, where revenue rose 59% to $6.3 billion. Intel said it expects flat PC sales in the third quarter because of the memory shortage.
Intel is boosting its capital expenditures, targeting a “meaningful increase” next year, as it aggressively tries to morph into a manufacturer of chips for other companies. Zinsner told CNBC’s Kristina Partsinevelos that the company’s latest manufacturing process, called 14A, is ahead of where older technologies were at the same point in the cycle. Intel said its foundry reported $5.8 billion in sales, up 31% on an annual basis.
Amkor Technology Announces Strategic Partnership with NVIDIA to Expand Advanced Packaging and Test for Next-Generation AI Infrastructure. $1.5 Billion Multi-Year Advanced Packaging and Development Agreement to Support Expansion of Amkor’s U.S. Advanced Packaging Capacity.
Do you think, will more of semiconductor supply-chain flow back to the U.S by the end of 2027?
“AI is driving a generational shift in technology, transforming every industry and creating a unique opportunity to reinvigorate American manufacturing and supply chains,” said Debora Shoquist, Executive Vice President of Operations at NVIDIA. “Amkor’s global capabilities, combined with their committed investment in the United States, are critical components of building resilient AI infrastructure and accelerating next-generation technologies.”
“This strategic partnership with NVIDIA underscores the central role advanced packaging plays in enabling the future of AI,” said Kevin Engel, chief executive officer of Amkor Technology. “Our agreement with NVIDIA accelerates our long-term roadmap and supports our ability to deliver full turnkey advanced packaging and test solutions, leveraging our global footprint while expanding U.S. capabilities to support critical AI infrastructure.”
The partnership also reflects a shared commitment to expanding full turnkey advanced packaging and test capabilities in the United States, strengthening domestic semiconductor manufacturing and supply-chain resilience for AI infrastructure. NVIDIA’s capacity agreement supports Amkor’s expansion of U.S. capacity in Arizona, complementing the company’s established manufacturing footprint across Asia, to create a geographically diverse and resilient global supply chain.
Polymarket offers separate markets on whether AfD will win the most seats in Sachsen-Anhalt(scheduled on Sep. 6), Mecklenburg-Vorpommern(scheduled on Sep. 20), and Berlin(scheduled on Sep. 20).
These contracts allow us derive benchmarks for "AfD wins exactly 2 states" and compare them with the directly traded price.
This article provides three ways to benchmark the price for "AfD wins exactly 2 states", without using any polling data, election correlation, or subjective probability. Time series of these benchmarks are plotted and compared to the actual Polymarket prices, using historical hourly data from 6 Jul 19:00 ET to 21 Jul 22:00 ET, fetched directly from Polymarket's public API.
6 Jul 19:00 ET was chosen as the starting time because the 'winning count' market was opened on Jul 6, 2026, 6:04 PM ET, while the individual state markets were open on Feb 11 (both Sachsen-Anhalt and Mecklenburg-Vorpommern) or Dec 2 (Berlin).
Some notations go first. Treating prices as implied probabilities, let S, M and B denote AfD victories in Sachsen-Anhalt, Mecklenburg-Vorpommern and Berlin. Let pS, pM and pB denote their respective prices, while qk denotes the price of AfD winning exactly k states.
The independence benchmark
If the three election outcomes are independent, the probability that AfD wins exactly two is:
q2=pSpM(1 − pB)+pS(1 − pM)pB+(1 − pS)pMpB
Equation 1
The three terms correspond to AfD winning S and M, S and B, or M and B, while losing the remaining state.
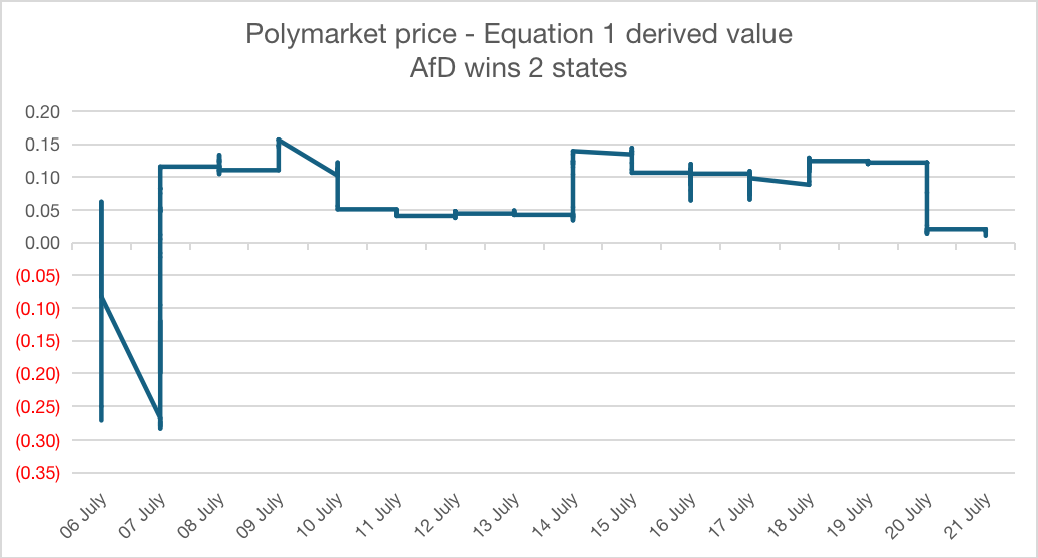
At the end of the sample period, pS = 98.45%, pM = 86.50% and pB = 13.05%. This equation produces a two-state probability of 75.96%. The traded price was 77%, leaving a relatively small difference of +1.04%.
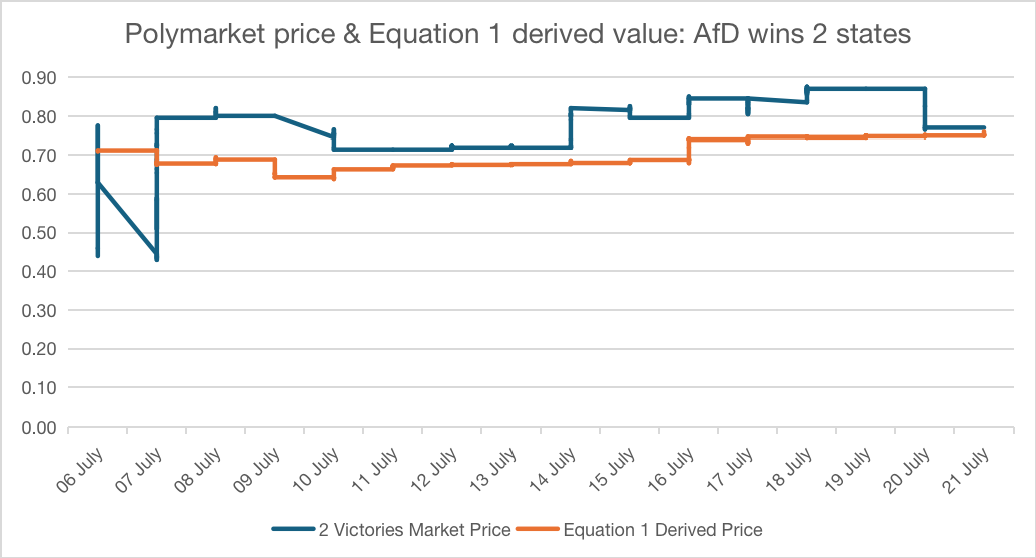
However, the chart below shows that this final agreement is not representative of the full period. After the first 24 hours (during which the price was volatile as the 'winning count' market was newly opened), the market price remained above the independence estimate in every hourly observation, with a median gap of about 9.84%, though the difference seems to converge to 0 as of the latest data.
If the prices were otherwise consistent, this pattern would suggest that joint AfD victories in exactly 2 states were being priced, most of the time, as less likely than independence would imply. But it could also reflect ordinary inconsistency between separately traded contracts.
Using the three-state contract as the intersection
The rationale behind the second model is simple. Because Sachsen-Anhalt was priced as an almost certain AfD victory (average price=97.74% during the sample period), exactly 2 total victories should be approximately equivalent to AfD winning exactly one of Mecklenburg-Vorpommern and Berlin. For two events:
P(exactly one of M, B)=P(M)+P(B)−2P(M ∩ B)
Equation 2
The three-state contract represents q3 = P(S ∩ M ∩ B). If P(S) is close to 1, then P(M ∩ B) ≈ q3, giving q3 ≈ pM + pB - 2q3.
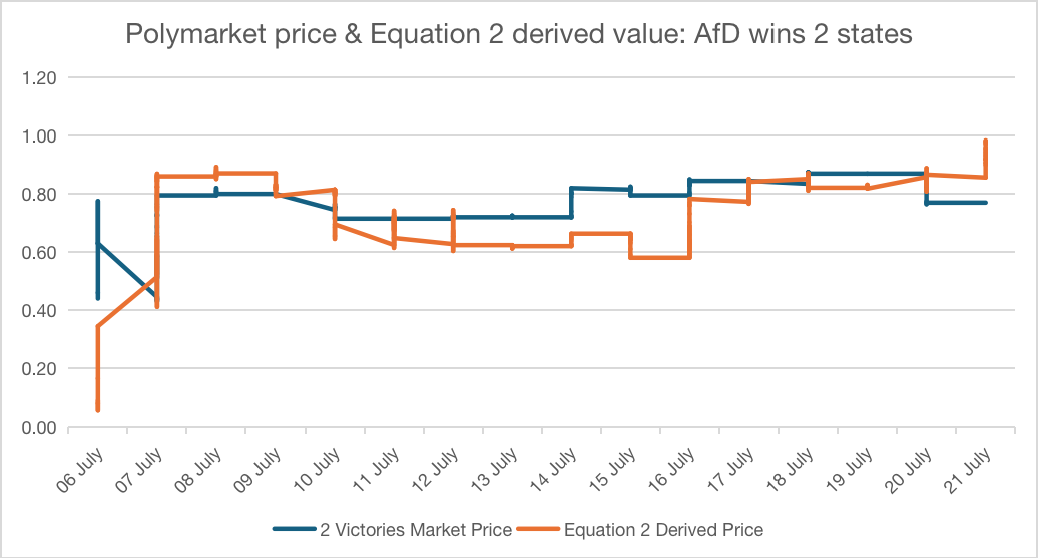
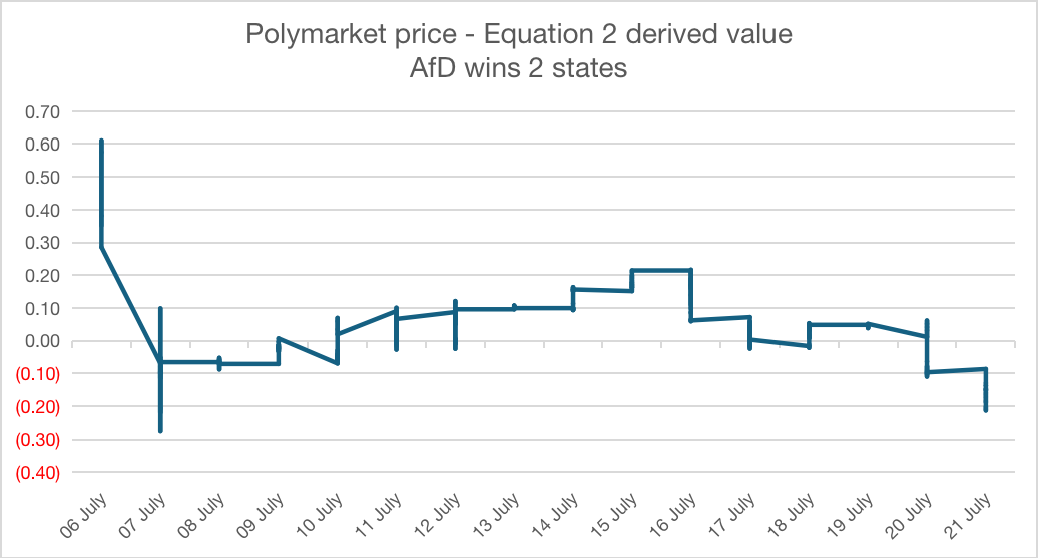
At the end of the sample period, q3 = 0.60%, so the equation gives 98.35%. That is 21.35% above the traded 77% price.
The chart showing the difference between the market price and equation-2-derived value is more volatile than the one using equation 1, because it inherits movements in the three-state contract. In the final 24 hours, the difference remained negative, with a median of approximately -16.90%.
Removing the independence assumption
Equation 1 assumes that election outcomes are independent, which may not be the case. The three elections are exposed to common national factors, including changes in AfD’s campaign developments and major political events. These shared influences are likely to generate positive correlation between the state outcomes.
A stronger benchmark can be derived without assuming any independence. Let N be the number of states won by AfD. Its expected value can be written in two ways:
E[N]=pS+pM+pB=q1+2q2+3q3
Because the count outcomes are mutually exclusive and exhaustive: q0 + q1 + q2 + q3 = 1
Subtracting the total-probability identity from the expected-value identity eliminates q1 and gives:
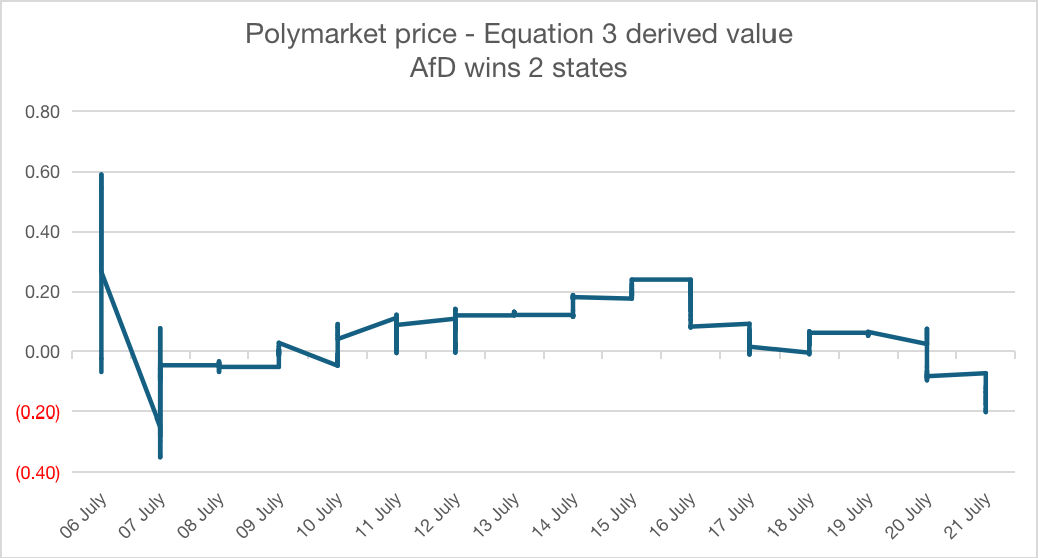
q2=pS+pM+pB+q0−2q3−1
Equation 3
This equation imposes no assumptions about independence between the elections.
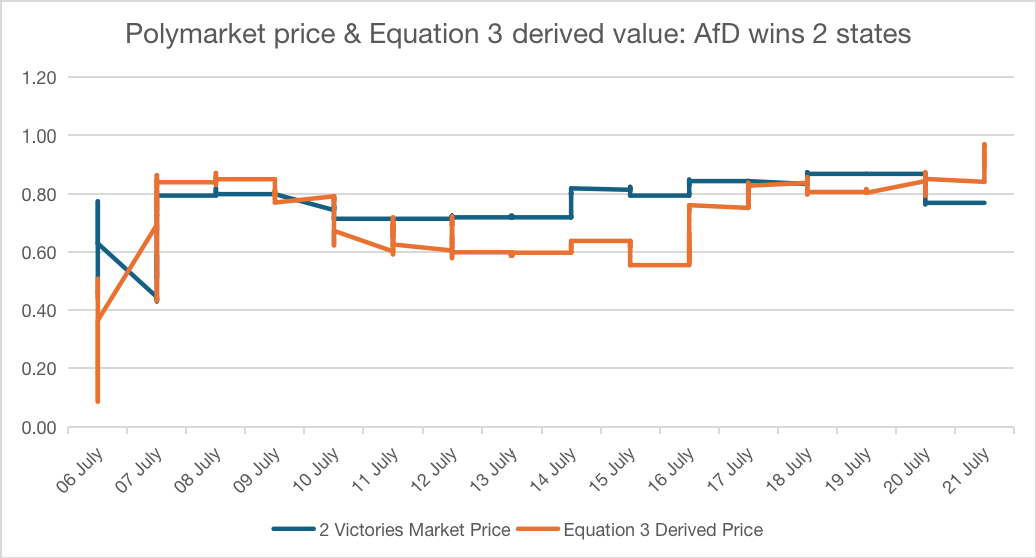
Using the final prices q0 = 0.45% and q3 = 0.60%, this equation gives 97.25%. The traded price was therefore 20.25% lower.
The close agreement between equations 2 and 3 is not accidental. Their difference is pS + q0 - 1. With pS = 98.45% and q0 = 0.45%, equation-2-derived value should be only few percentage points below the benchmark derived using equation 3.
Which benchmark(s) would you use? (Select all that apply)
Equation 1/Benchmark 1Result
25.94%
Equation 2/Benchmark 2Result
5.83%
Equation 3/Benchmark 3Result
64.35%
None of thoseResult
3.88%
720 Polls
EndedTBD
A small contractual caveat
The count market treats a tie for the greatest number of seats as an AfD victory. The individual state-winner markets instead apply tie-breaking rules to select one winner. In addition, the count market uses a different deadline (Dec 31, 2026) compared to the individual state markets (Jan 31, 2027) in the case where the elections are delayed. The common underlying assumption behind all 3 models is that the underlying event definitions are harmonised, however the impact is likely negligible. Bid-ask spreads, liquidity and execution costs also matter before positions are opened.
The charts could be read as a historical cross-market consistency test. Their clearest message is that the market price, the independence benchmark, and the prices incorporating the three-state contract currently imply very different probability distributions. Perhaps the market is underpriced? Or are the benchmarks flawed?
Disclaimer: The content is for informational purposes only. You should not construe any such information or other material as legal, tax, investment, financial, or other advice. Nothing contained in this article constitutes a solicitation, recommendation, endorsement, or offer by the author(s) or any third party service provider to buy or sell any securities or other financial instruments in your or in any other jurisdiction in which such solicitation or offer would be unlawful under the securities laws of such jurisdiction. The author(s) report(s) no conflict of interest.
The Amazon founder Jeff Bezos has held talks about joining the consortium that is seeking to buy around 30% of Liverpool.
Will Bezos' consortium deal on Liverpool FC finalize before 2026-2027 Premier League kick-off?
YesResult
71.77%
NoResult
28.23%
1,913 Polls
EndedTBD
The group led by the former Queens Park Rangers co‑owner Amit Bhatia has made a provisional offer of £1.35bn to buy a stake from Fenway Sports Group (FSG), and is talking to other potential investors over supplying funding.
Bezos has a personal fortune of around $257bn, according to Forbes, making him the fourth-richest person in the world.
Sources with knowledge of the talks have indicated that any deal with Bhatia’s consortium would see Bezos receive equity in Liverpool.
Amazon had live UK rights for 20 Premier League games each season for six seasons until the end of last year, and broadcasts the Champions League in several European countries, as well as NFL in the US.
July 22 (Reuters) - Private equity firm Platinum Equity is nearing a deal to acquire about a 50% stake in Nestle's European water business in a transaction that would value the joint venture at almost €5 billion ($5.71 billion), the Financial Times reported on Wednesday.
Will Nestle divest more unit(s) in the rest of 2026?
YesResult
0.00%
NoResult
100.00%
3 Polls
EndedTBD
The companies are aiming to finalise an agreement before Nestle reports first-half earnings on Thursday, the report said. Nestle declined to comment, according to Reuters.
The company has been reshaping its portfolio under CEO Philipp Navratil, who has sought to improve growth and profitability by focusing on the company's core brands.
Reuters reported in May 2025 that Nestle had hired Rothschild to explore a partnership or sale of a stake in its European water business while retaining part ownership. The unit includes brands such as Perrier, San Pellegrino and Acqua Panna.
Alphabet reported second-quarter revenue of $119.8 billion on Wednesday, up 24% year over year, as accelerating Google Cloud growth and a large investment gain lifted earnings. Net income reached $9.11 a share, well above Wall Street forecasts.
Yet the strong headline results failed to reassure investors. Alphabet shares fell as much as 5% in after-hours trading before recovering part of the decline, as attention quickly shifted from revenue growth to the company’s rapidly expanding capital expenditures.
Alphabet was the first of the big tech companies to report quarterly results, with Meta Platforms Inc., Microsoft Corp. and Amazon.com Inc. due next week. In April, the four companies indicated that they could spend as much as $725 billion this year on their AI ambitions. Alphabet’s revised outlook suggests that figure may rise further, even as the financial returns on those investments remain uncertain.
The quarter nevertheless provided some evidence that Alphabet’s AI spending is translating into demand. Google Cloud revenue rose 82% from a year earlier to $24.77 billion, comfortably exceeding analysts’ estimate of $22.46 billion. Cloud backlog, representing contracted revenue not yet recognized, increased to $514 billion from roughly $460 billion in the previous quarter.
Cloud demand was “powered by strong demand for AI infrastructure and AI solutions,” Chief Executive Officer Sundar Pichai saids. He added that most of the backlog came from conventional contracts across a broad mix of customers and that it expects to recognize more than half of the total as revenue over the next 24 months.
Google Cloud has therefore become one of the clearest tests of whether Alphabet’s AI investments can generate financial returns. Although the division still trails Amazon Web Services and Microsoft Azure, it is now one of Alphabet’s fastest-growing businesses, supported by AI startups and enterprises building and deploying AI applications.
However, the scale of the spending required to meet that demand remains the central concern. Alphabet raised its 2026 capital expenditure forecast to between $195 billion and $205 billion, up from a previous ceiling of $190 billion. The company said the increase would allow it to accelerate the expansion of AI computing capacity and capture more cloud revenue.
The higher outlook set a cautious tone for the rest of Big Tech earnings season, reviving concerns that fiscal discipline is being sacrificed in the race to dominate artificial intelligence.
Alphabet’s expanded spending plan “does not sit well,” Investing.com senior analyst Thomas Monteiro said. He argued that higher interest rates and continued supply constraints in AI infrastructure could challenge the assumption that the company will always be able to finance its investments entirely through internal cash flow.
Those concerns were reinforced by Alphabet’s cash-flow figures. The company generated $39.1 billion in operating cash flow during the quarter but spent $44.9 billion on capital expenditures, producing negative free cash flow of $5.8 billion—its first negative quarter as a publicly traded company.
Following the higher capex forecast, Alphabet is on track to spend roughly $120 billion in the second half of the year. Investors may therefore have to accept further periods of negative free cash flow while waiting for AI-related revenue to catch up.
That dynamic will intensify scrutiny of Alphabet’s AI strategy. Wall Street is looking for clearer evidence that the company’s spending—and similar investments by its rivals—is creating new, profitable growth rather than merely increasing costs.
Meanwhile, Alphabet has more potential uses for AI infrastructure than most of its peers. Its spending supports Google Cloud, the Gemini model family, consumer AI products and the core advertising business. The breadth of those applications may eventually justify the investment, but the timing and scale of the returns remain uncertain.
Google is continuing to expand Gemini, although delays to Gemini 3.5 Pro have raised questions about its competitive position in developer tools and AI coding. Pichai instead highlighted Gemini 4, a larger frontier model, and said Google plans to move toward an almost monthly release cycle.
YouTube revenue reached $11.1 billion, beating estimates, supported by connected TV, creator content and AI-powered tools. Alphabet also recorded nearly $100 billion in investment gains from stakes including Anthropic and SpaceX, sharply boosting net income.
Overall, Alphabet’s results showed that AI demand is already supporting exceptional cloud growth. But the market’s reaction made clear that revenue growth alone is no longer enough: investors increasingly want proof that the company can convert its enormous AI spending into durable cash flow and returns.
Will Alphabet return to positive free cash flow before the end of 2027?