Premier info portal for prediction markets. The start point of information market.
Energy Matrix - California Curtailed 4.5 Billion kWh of Green Electricity in Six Months. Why Is It Still Worried About Power Shortages?
Editorial
EnergyEnergy MatrixRenewable EnergyAI PowerIndustry PulseMust Read

Energy Matrix - California Curtailed 4.5 Billion kWh of Green Electricity in Six Months. Why Is It Still Worried About Power Shortages?

45 billion kWh of solar and wind power was curtailed in six months. Why does California still worry about blackouts?

Economics & FinanceTech

On August 4 Reuters reported that California had curtailed approximately 4.5 million megawatt-hours of wind and solar generation in the first half of the year, already exceeding the 3.77 million megawatt-hours curtailed during all of 2025.

At first glance, this appears absurd. On the one hand, electricity is sometimes so abundant that prices fall below zero. On the other hand, California continues to maintain several thousand megawatts of emergency resources to protect against summer heatwaves, wildfires and regional power shortages.

But this does not mean that California simultaneously has too much electricity and too little electricity at the same moment. Instead, the state is experiencing two entirely different forms of scarcity:

  • At midday in spring, it lacks the capacity to absorb, store or export surplus electricity.
  • During summer evenings and periods of extreme weather, it lacks capacity that can ramp up quickly, continue generating for extended periods and be delivered reliably to where it is needed.

What California truly lacks is not total annual electricity generation, but power that can be supplied continuously, at the right time and in the right place, and delivered to consumers through the grid.

The 4.5 Billion kWh of Curtailed Electricity

According to CAISO’s (California Independent System Operator) monthly data, a total of 4,502,385 megawatt-hours (or 4.502 billion kilowatt-hours) of wind and solar generation was curtailed between January and June 2026. Spread evenly across every minute of the first half of the year, this would be equivalent to a power plant with approximately 1.04 gigawatts of capacity operating continuously for 181 days.

Month Curtailed Wind and Solar Generation Share of Five-Minute Intervals with Negative Prices Maximum Three-Hour Net-Load Ramp
January 23,400 MWh 2.05% 16.43 GW
February 242,300 MWh 7.31% 17.76 GW
March 774,300 MWh 19.60% 20.86 GW
April 1,415,500 MWh 28.26% 18.42 GW
May 1,447,500 MWh 22.03% 20.07 GW
June 599,400 MWh 12.51% 20.93 GW

April and May alone accounted for approximately 63.6% of all curtailment during the first half of the year. The problem was most severe not during the peak summer demand season, but in spring, when temperatures were mild, air-conditioning demand was relatively low, and solar output was already high.

In April 2026, curtailed electricity represented about 18% of the utility-scale wind and solar generation that was available that month. The amount curtailed in that single month even exceeded the total curtailment recorded over the five years from 2014 to 2018.

CA Monthly Solar and Wind Curtailment in GWhs (Source: Energy Institute at HASS)

Curtailment, Negative Prices and Power Shortages Are Three Different Problems

Curtailment: The System Cannot Efficiently Accommodate the Next Unit of Electricity

Curtailment can result from either physical constraints or economic dispatch.

Physical curtailment usually occurs when transmission lines in a particular area are already operating at full capacity. Even if another city needs electricity, additional power generated in a solar-rich region cannot be transmitted out.

Economic curtailment occurs when there is insufficient demand in the market. Continued generation could cause supply to exceed demand, pushing market prices below zero and prompting generators to reduce output.

CAISO’s Department of Market Monitoring estimated that, across the Western Energy Imbalance Market in 2025, approximately 4.78 million megawatt-hours of downward dispatch of wind and solar generation was economic, accounting for 89% of the relevant reductions. Self-scheduled resources were forcibly curtailed by approximately 480,000 megawatt-hours, accounting for 9%. This indicates that most curtailment was not caused by emergency operators suddenly disconnecting generation. Instead, the market actively reduced output in response to supply, demand and generator bids.

Source: CAISO 2025 Annual Report on Market Issues and Performance

Negative Prices: The Next Unit of Electricity Has Negative Marginal Value at a Particular Time and Location

Negative electricity prices do not mean that the power system as a whole has no value, nor do they mean that households can consume electricity for free. They simply indicate that, at a particular node and during a particular five-minute or fifteen-minute trading interval, the system does not want to receive additional electricity.

Renewable energy projects may be willing to submit negative-price bids for several reasons:

  • The short-run marginal cost of generating wind and solar power is close to zero.
  • Projects may receive tax credits, renewable energy certificates or fixed contractual payments.
  • Some conventional power plants face high shutdown and restart costs, so they may also prefer to continue operating during periods of low prices.

As long as the loss caused by a negative market price is smaller than the subsidy or contractual revenue received, continued generation may remain profitable.

CAISO notes that negative prices occur most frequently when renewable generation is high and electricity demand is low. In 2025, negative prices occurred in 8.4% of five-minute intervals in the CAISO market, down from 10.7% in 2024. In April 2026, however, the share rose again to 28.26%. In other words, batteries and market reforms have reduced the problem on an annual average basis, but they have not eliminated extreme oversupply around midday in spring.

Frequency of 5-minute Market Negative Prices, Jan 2015 - Jun 2026 (Source: CAISO Monthly Renewables Performance Report June 2026)

Power Shortages: A Lack of Deliverable Capacity During Critical Periods

Reliability shortages are not determined by how much electricity is generated over the course of an entire year. The relevant question is whether the system can maintain the balance between supply and demand during its most difficult hours.

CAISO forecasts a peak load of 46,844 megawatts in 2026. Its probabilistic model indicates that, under normal planning assumptions, the system has an effective capacity surplus of approximately 2,547 megawatts and can satisfy the reliability standard of limiting the expected loss of load to no more than 0.1 days per year. In other words, California is not expected to face an inevitable power shortage under normal conditions.

The problem is that the model does not simultaneously simulate overlapping extreme events such as a prolonged drought, wildfires disrupting transmission, a heatwave affecting the entire western United States and failures at several large generating facilities. CAISO has explicitly stated that these risks, if they occur at the same time, could still lead to emergency conditions.

California’s decision to retain emergency generation is therefore not contradictory. For the summer of 2026, the state prepared up to approximately 4,500 megawatts of emergency and reserve resources to address extreme conditions that fall outside the assumptions of its standard planning model.

The Real Challenge Is What Happens Within Three Hours

At midday, when solar output is high, net load can fall to very low levels. After sunset, solar generation declines rapidly, but demand does not fall at the same pace. Net load therefore rises sharply.

The duck curve shows how high solar generation during the middle of the day pushes net load down, creating a “belly,” followed by a sharp ramp in the evening when solar output falls and demand remains high. This pattern makes it more challenging to operate the grid, because the power system needs flexible resources to ramp up quickly as the sun sets.

In June 2026, CAISO’s maximum three-hour net-load ramp reached 20,931 megawatts, equivalent to 44.7% of the forecast peak load for 2026. This means that the system sometimes has to rearrange enough electricity supply within three hours to meet nearly half of the grid’s peak demand.

This supply does not necessarily have to come entirely from newly started plants. It can be supplied through:

  • Batteries discharging
  • Existing facilities increasing output
  • Increased electricity imports from other states
  • Renewable energy sources that continue generating during the evening

Regardless of where it comes from, what the system needs is power capacity that can change its operating state quickly, not additional solar electricity when the grid is already unable to absorb it.

This explains why electricity generated by the same solar plant may have a negative value at midday, while storing that same unit of electricity and delivering it at 8 p.m. can significantly increase its value. Electricity is not a homogeneous commodity whose value is independent of time.

California Already Has More Than 17 GW of Battery Storage. Why Is Curtailment Still Rising?

By 2025, California’s installed battery storage capacity had exceeded 17,000 megawatts. Batteries have become an important source of electricity during the evening peak, rather than merely an experimental technology.

Within the CAISO system, the capacity of batteries participating in the market increased from approximately 500 megawatts in 2020 to 13,000 megawatts by the end of 2024.

In 2024, battery charging accounted for an average of 14.7% of system load between 10 a.m. and 1 p.m. Between 5 p.m. and 9 p.m., batteries supplied an average of 8.6% of the system’s electricity while meeting 84% of its frequency-regulation requirements.

These figures show that batteries have significantly reduced the severity of the duck curve. However, they have not eliminated curtailment entirely, for at least five reasons.

First, Megawatts Are Not Megawatt-Hours

The figure of 17,000 megawatts describes the maximum rate at which batteries can charge or discharge, not the amount of energy they can store.

Most existing utility-scale batteries in the CAISO system have a discharge duration of approximately 4 hours. A 100-megawatt, four-hour battery can store about 400 megawatt-hours of energy, which is not enough to support the system through several consecutive days of extreme heat or an extended period of cloudy weather.

Second, Curtailment and Batteries May Occur in Different Locations

When transmission lines in a solar-intensive region are already congested, batteries located near the Los Angeles load centre may not be able to absorb the electricity being curtailed there.

Only batteries located upstream of the congested transmission line, sharing the same grid connection as the solar facility, or connected through sufficient transmission capacity can directly reduce curtailment at a particular project. The location of battery storage is therefore just as important as the amount of capacity installed.

The market has already begun adapting to this problem. Approximately 41% of existing utility-scale solar capacity in the CAISO system is co-located with batteries, while about 93% of solar projects scheduled to begin operating before 2030 include battery storage.

Third, Batteries Cannot Use Their Entire Capacity to Absorb Curtailed Electricity

Batteries must also reserve energy for the evening peak, frequency regulation, reserve capacity and other ancillary services. Once a battery is fully charged at midday, it cannot absorb additional solar generation later in the afternoon. Conversely, if it does not preserve sufficient capacity because it is absorbing more low-priced electricity, it may not have enough energy available to discharge in the evening.

Fourth, Battery Dispatch Is Affected by Market-Design Problems

CAISO’s day-ahead market optimises operations over the following 24 hours. However, the 15-min real-time market looks ahead only about two hours, while the five-minute market has an optimisation horizon of only about 65 minutes.

When prices rise earlier in the afternoon, the real-time market may instruct batteries to discharge prematurely because its optimisation software cannot see the more severe evening peak several hours ahead. As a result, batteries may enter the critical period with an insufficient state of charge. CAISO’s Department of Market Monitoring has identified these limited optimisation horizons as an important problem affecting battery dispatch.

Fifth, Four-Hour Storage Solves Intraday Mismatches, Not Every Type of Mismatch

Four-hour lithium-ion batteries are highly effective at shifting electricity from midday to the evening, but they are not well suited to solving the following problems on their own:

  • Extended periods of heatwaves, low wind and cloudy weather
  • Seasonal mismatches between winter and spring
  • Reduced solar generation caused by wildfire smoke
  • Widespread transmission failures

California therefore needs a portfolio of resources with different discharge durations, rather than treating every problem as something that can be solved simply by building more batteries.

Transmission Capacity May Be Scarcer Than Generation Capacity

Renewable energy projects can usually be built within a few years, but large transmission lines require route selection, environmental assessments, land coordination, regulatory approvals, procurement and construction. The process often takes more than a decade.

The SunZia project illustrates the difference between generation capacity and deliverable capacity. The project has 3,650 megawatts of installed capacity, of which approximately 3,167 megawatts has been allocated to CAISO. However, in its summer 2026 reliability assessment, CAISO initially counted no more than 1,009 megawatts of additional import capability. The reasons included transmission rights, import capability limits and unfinished internal upgrades in Southern California. The relevant upgrades are not expected to enter service until around 2034.

In other words, building 3,650 megawatts of wind capacity does not mean that California receives 3,650 megawatts of reliable electricity when it is needed most.

This is also why simply counting newly installed solar, wind and battery capacity can easily overstate the actual improvement in the power system.

In 2026, CAISO approved 38 transmission projects with an estimated total investment of approximately US$6.7 billion over the next decade. More than half of the projects and more than half of the investment were driven by growth in electricity demand. The plan also includes 12 reconductoring projects, three of which will use advanced conductors to increase the capacity of existing lines without constructing entirely new transmission corridors.

By 2035, California’s electricity load is expected to increase by 15 gigawatts, while the system will need to add more than 74 gigawatts of resource capacity. By 2040, load is expected to increase by 20 gigawatts, while required resource capacity will rise by more than 107 gigawatts.

This does not necessarily mean that California is overbuilding power plants by a factor of five. The additional resources include solar and wind facilities that cannot maintain their nameplate output around the clock, as well as storage systems that must first be charged before they can discharge. To meet demand in every hour, the system requires higher nominal installed capacity, complementarity among different resources and substantial transmission redundancy.

Why Have Negative Electricity Prices Not Translated into Lower Residential Bills?

The California Public Utilities Commission identifies three major drivers of the state’s recent electricity-rate increases: wildfire-related expenditure, cost shifting associated with rooftop solar programmes, and increased investment in distribution infrastructure. In 2024, wildfire-related revenue requirements accounted for approximately 27% of PG&E’s total revenue requirement and about 17% of those of SCE and SDG&E. Rooftop solar programmes were estimated to shift approximately US$7 billion in costs to customers without solar systems.

Wildfire-Related Revenue Requirement Relative to Total Revenue Requirement, Year-End, $ Millions (Source: CA Public Utilities Commission)

The claim that “wholesale prices are negative, so households should receive electricity for free” is therefore incorrect.

A negative price means only that the marginal unit of electricity has no value at a particular location around midday. The transmission network, distribution grid, wildfire-prevention work and reliable evening capacity must still be paid for throughout the year. Those costs do not disappear simply because wholesale prices fall below zero for several hours around midday.

Curtailment does increase overall system costs because it reduces the utilisation of assets that have already been built and may require consumers to pay simultaneously for additional renewable generation, storage and transmission infrastructure. At present, however, California’s high residential electricity rates cannot primarily be attributed to curtailment. Official cost data indicate that wildfire-related and network costs have had a greater impact.

California Should Not Aim for Zero Curtailment

At first glance, curtailing 4.5 billion kilowatt-hours of electricity may seem to imply that California must build enough batteries and transmission lines to preserve every unit of generation.

From an economic perspective, however, zero curtailment is not necessarily the optimal objective.

Suppose extreme solar oversupply occurs for only a few dozen hours each year. Building an expensive transmission line or a long-duration storage facility that remains idle for most of the year simply to preserve the final unit of electricity may cost more than curtailing that generation directly.

CAISO’s transmission-planning process applies similar logic. It uses production-cost models to compare the cost of new infrastructure with the benefits to consumers from reducing congestion and decreasing the dispatch of higher-cost generation.

The concern for California is therefore not that any curtailment occurs, but that curtailment is increasing too quickly and that the share of available wind and solar generation curtailed in April alone has already reached approximately 18%. This indicates that the mismatch between renewable-energy expansion and the growth of electricity demand, storage and transmission infrastructure is becoming wider.

Disclaimer: The content is for informational purposes only. You should not construe any such information or other material as legal, tax, investment, financial, or other advice. Nothing contained in this article constitutes a solicitation, recommendation, endorsement, or offer by the author(s) or any third party service provider to buy or sell any securities or other financial instruments in your or in any other jurisdiction in which such solicitation or offer would be unlawful under the securities laws of such jurisdiction. The author(s) report(s) no conflict of interest.


Maritime Insights - Is Global Shipping Rewriting Its Trade Routes? Behind: Gemini Cooperation’s Suez Return, China’s Arctic Expansion, MSC’s Barcelona Setback, and Taiwan Carriers’ Revenue Growth
Analysis
MaritimeMaritime InsightsContainer ShippingPortsIndustry PulseTransportSupply Chain

Maritime Insights - Is Global Shipping Rewriting Its Trade Routes? Behind: Gemini Cooperation’s Suez Return, China’s Arctic Expansion, MSC’s Barcelona Setback, and Taiwan Carriers’ Revenue Growth

Global shipping is shifting again as Gemini returns more services to Suez, China expands Arctic routes, MSC retreats from its Barcelona terminal bid, and Taiwan’s major carriers post stronger revenues amid elevated freight rates.

Economics & Finance

Maersk, Hapag-Lloyd Resume More Sailings Through the Suez Canal

Maersk said another container service in its Gemini Cooperation with Hapag-Lloyd will resume sailing through the Red Sea and Suez Canal, extending the carriers’ gradual return to the route.

The two companies had already restored an Asia–Mediterranean–Europe service through Suez in July, while another service linking the Middle East with the U.S. East Coast is also set to return.

Container Carriers Eye Return to Red Sea Route
A.P. Moller-Maersk A/S and Hapag-Lloyd AG signaled confidence about resuming passage through the Red Sea, sending the container carriers’ shares down on expectation a return to the shorter route will ease capacity constraints and temper a surge in shipping rates.

The move is an important signal that carriers are becoming more confident about operating through the Red Sea after years of rerouting vessels around the Cape of Good Hope. A broader return to Suez would shorten voyage times and release effective container capacity that has been absorbed by longer diversions around Africa. That could ease vessel shortages and put downward pressure on freight rates, making the pace of further route normalization a key factor for the container shipping market.

MSC and BlackRock Withdraw Approval Request for Purchase of Stake in Barcelona Port

MSC and BlackRock formally withdrew their EU approval request on August 10, 2026 for the proposed acquisition of joint control of Barcelona Europe South Terminal (BEST) from CK Hutchison.

The deal, first notified to the European Commission on November 5, 2025, would have given Terminal Investment Limited (TiL) — jointly controlled by MSC and BlackRock — joint control of BEST alongside Hutchison Ports. Brussels subsequently opened an in-depth antitrust investigation over concerns that MSC’s presence in both container shipping and terminal operations could allow it to favor its own services through better access to berths, cranes or storage capacity.

The review was paused on January 8, 2026 while the Commission awaited additional information. After months of regulatory scrutiny, MSC and BlackRock withdrew the current approval application on August 10 rather than continue the review under the existing transaction structure.

Importantly, this does not necessarily mean MSC has permanently abandoned BEST. What has been withdrawn is the current version of the transaction and its EU filing. The parties could theoretically restructure the deal, offer additional competition remedies and refile, although no next step has been announced.

Will MSC or TiL formally announce a renewed bid for Barcelona’s BEST terminal by December 31, 2027?

Yes
42.66%
No
57.34%
218 Polls

The Barcelona deal is separate from the larger $22.8 billion CK Hutchison global ports transaction involving MSC and BlackRock. The BEST case has primarily centered on EU competition concerns over carrier-terminal vertical integration.

China Bypasses Shipping Chokepoints With ‘Ice Silk Road’ Through Arctic

China is moving to establish a regular container shipping service between Asia and Europe through the Arctic, expanding its “Ice Silk Road” as an alternative to traditional routes through maritime chokepoints.

The first scheduled service, operated by Sea Legend, is set to begin on August 12, 2026, linking Ningbo with Felixstowe in the UK via Russia’s Northern Sea Route.

The Arctic route can reduce the journey between China and northern Europe to roughly 20 days, potentially about half the time required on conventional routes in some conditions.

More importantly, it allows ships to bypass vulnerable chokepoints including the Strait of Malacca, Bab el-Mandeb and Suez Canal, whose strategic importance has been highlighted by repeated geopolitical and shipping disruptions.

However, the route remains highly seasonal and operationally challenging. Arctic shipping requires ice-capable vessels, faces limited emergency infrastructure and carries significant environmental risks.

Evergreen, Yang Ming and Wan Hai Post Positive Revenue Growth in the First Seven Months

Taiwan’s three major container carriers — Evergreen Marine, Yang Ming Marine Transport and Wan Hai Lines — all reported YoY revenue growth for the first seven months of 2026, supported by stronger freight rates.

Evergreen posted July revenue of NT$48.1 billion ($1.49 billion), up 43.1% YoY and 22.8% MoM. January–July revenue reached NT$239.8 billion ($7.43 billion), up 4.2% YoY.

Yang Ming reported July revenue of NT$20.8 billion ($644 million), up 34.6% YoY and 25.6% MoM. Seven-month revenue rose 5.8% YoY to NT$105.4 billion ($3.27 billion).

Wan Hai generated NT$18.6 billion ($576 million) in July, up 50.1% YoY and 15.3% MoM. January–July revenue reached NT$95.2 billion ($2.95 billion), up 12.8% YoY.

The figures show that recent freight-rate strength is still supporting carrier revenues. The key risk ahead is whether demand can absorb additional effective capacity as more vessels return to the Suez Canal and Cape of Good Hope diversions unwind.

Source:

  1. Reuters; https://www.reuters.com/business/maersk-hapag-lloyd-resume-more-sailings-through-suez-canal-2026-08-10/?utm_source=chatgpt.com
  2. Reuters; https://www.reuters.com/business/msc-blackrock-withdraw-approval-request-purchase-stake-barcelona-port-2026-08-10/?utm_source=chatgpt.com
  3. The Financial Times; https://www.ft.com/content/4456f475-f2c8-4cb7-8312-0c47c5f781b8?syn-25a6b1a6=1
  4. Worldports; https://www.worldports.org/evergreen-yang-ming-and-wan-hai-lines-report-month-on-month-revenue-growth-in-july/
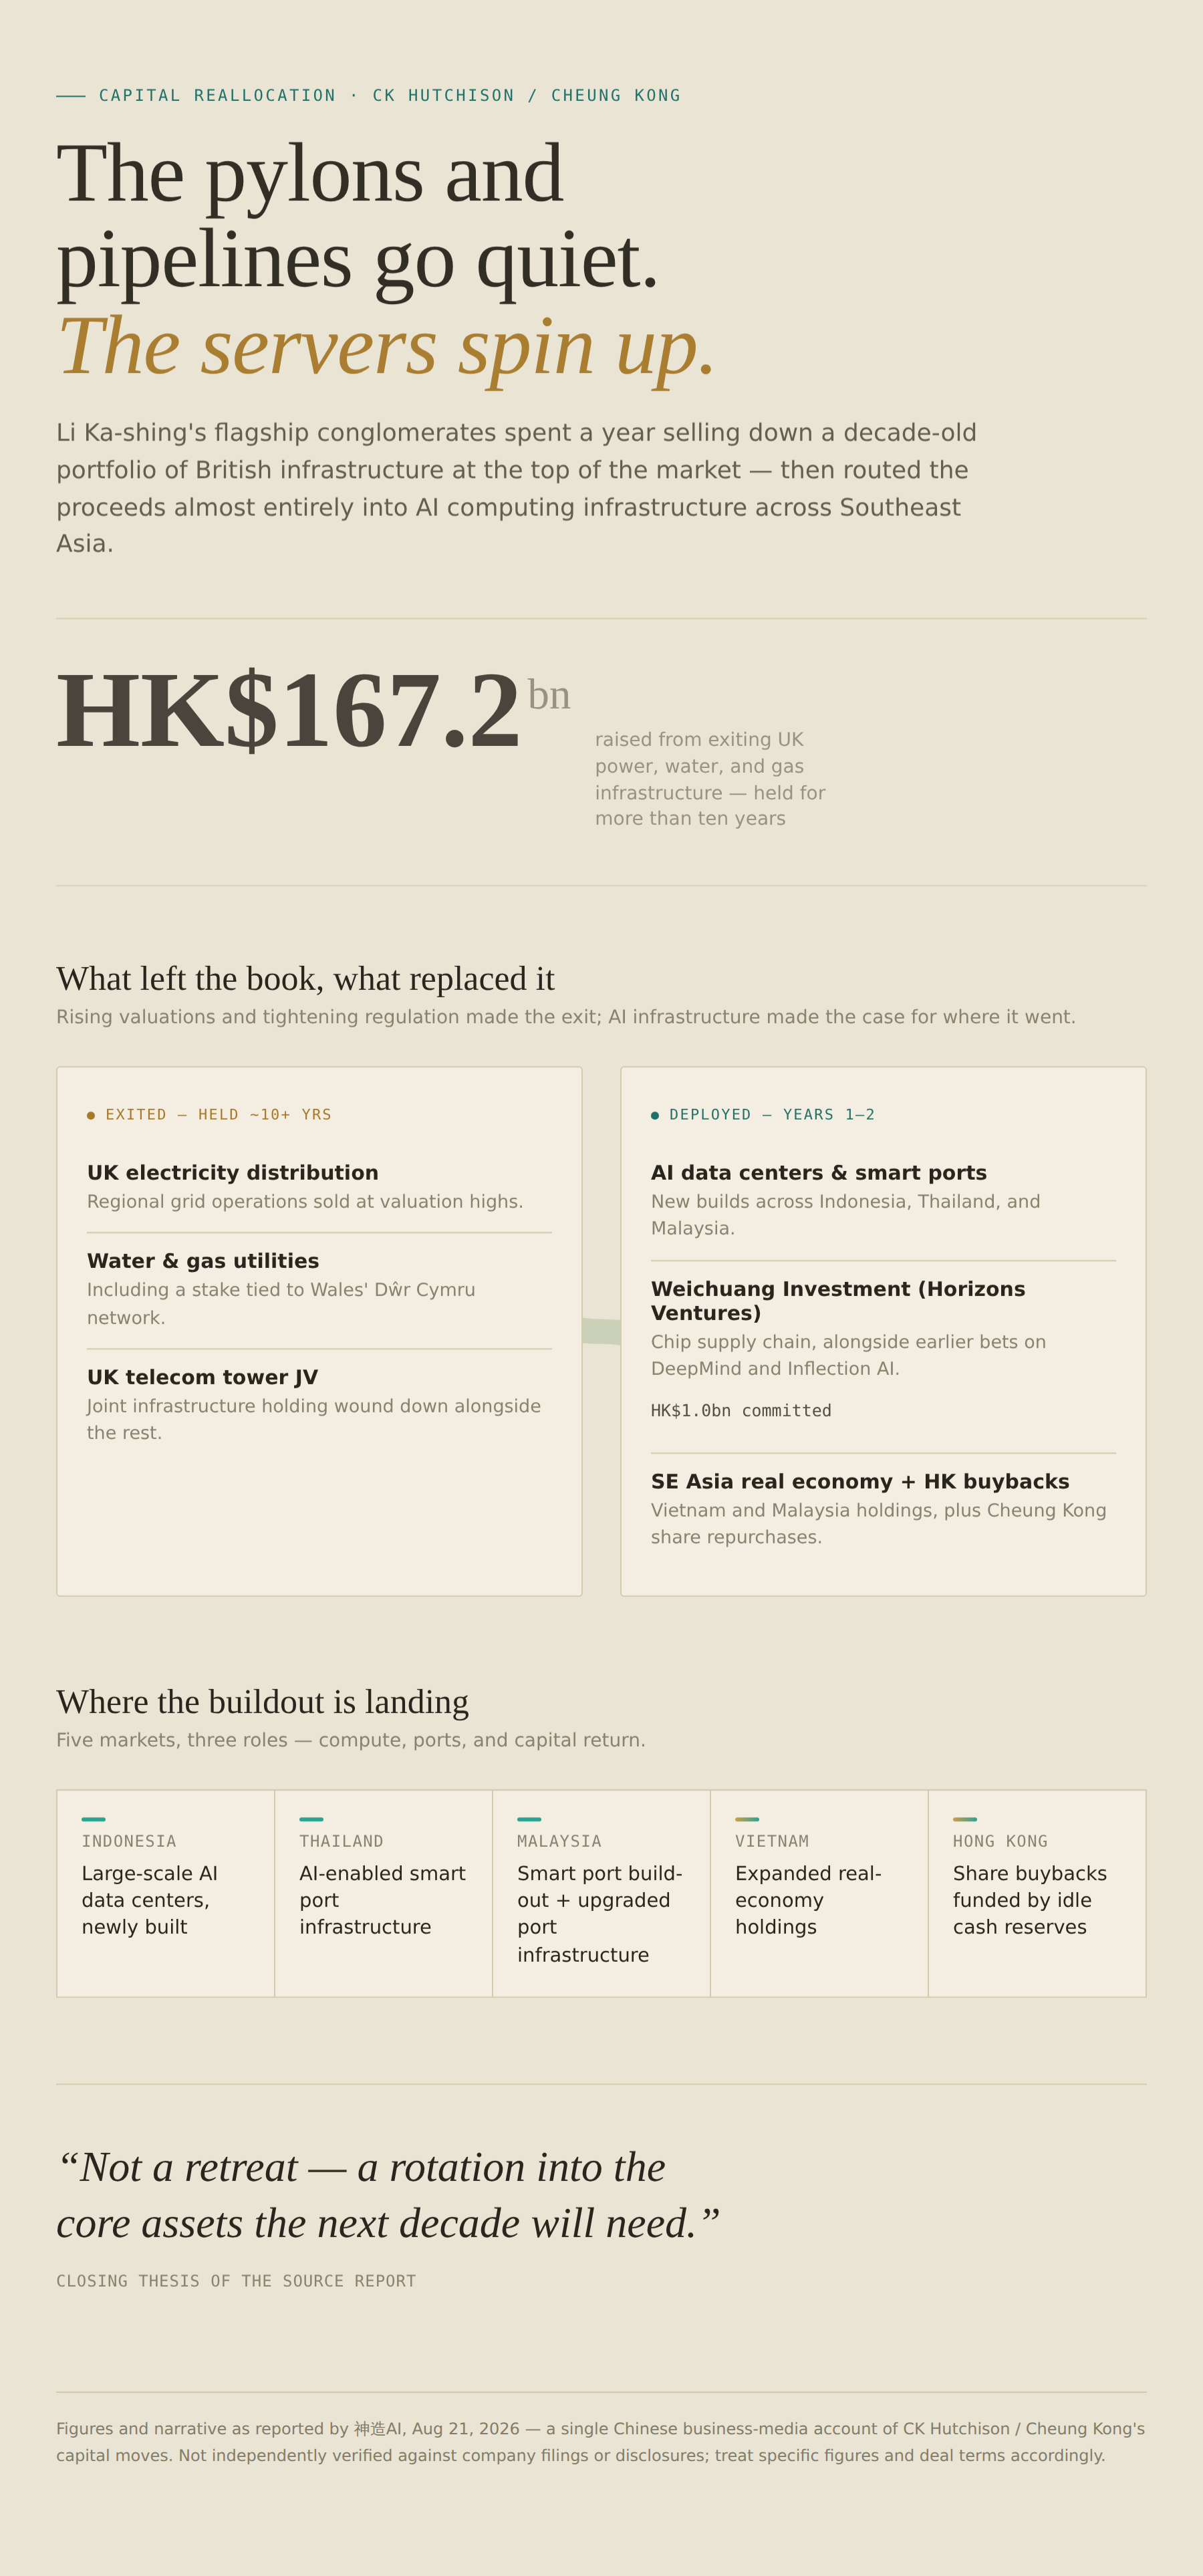
Breaking News - SK Hynix-Linked Vehicle Becomes Kioxia’s Top Shareholder
News
Memory ChipSemiconductorEquityCapital MarketsAI InfrastructureBreaking News Semi Analysis

Breaking News - SK Hynix-Linked Vehicle Becomes Kioxia’s Top Shareholder

Kioxia Holdings said on August 11 that a Bain Capital investment vehicle linked to SK hynix has become its largest shareholder after former parent Toshiba further reduced its stake.

Economics & FinanceTech

Kioxia Holdings said on August 11 that a Bain Capital investment vehicle linked to SK hynix has become its largest shareholder after former parent Toshiba further reduced its stake.

Will SK Hynix exercise its rights and pass all regulatory steps to become Kioxia's largest shareholder by the end of 2027?

Yes
0.00%
No
0.00%
0 Polls

Toshiba’s holding in the Japanese flash-memory maker fell to about 14.12% as of August 3, from 14.48%, leaving BCPE Pangea Cayman2 — a vehicle established by Bain Capital — as Kioxia’s biggest shareholder with a 14.19% stake.

The ownership structure is notable because SK hynix holds bonds that can be converted into substantially all of the voting rights of BCPE Pangea Cayman2. Kioxia has previously identified the arrangement as a potential conflict-of-interest risk, given that SK hynix is also one of its major competitors in the global memory-chip market.

The structure dates back to 2018, when a Bain-led consortium acquired Toshiba’s memory-chip business, later renamed Kioxia. SK hynix participated in the consortium but agreed to limit its voting rights in Kioxia to no more than 15% until 2028 unless Kioxia approves a larger stake.

The latest change does not mean SK hynix directly controls Kioxia, but it puts an investment vehicle closely tied to the Korean chipmaker at the top of Kioxia’s shareholder register. The arrangement could draw greater attention to governance, competitive conflicts and SK hynix’s longer-term position in Kioxia as the 2028 voting-right restriction approaches expiry.

Source:

  1. Bloomberg; https://www.bloomberg.com/news/articles/2026-08-11/kioxia-says-investment-vehicle-for-sk-hynix-is-top-shareholder
Market Rumor Follow Up  - Jeff Bezos nears deal to buy stakes in Liverpool FC (Aug 10, 2026)?
News Flash
Market RumorSports InsightCapital MarketsSports-SoccerCelebrities

Market Rumor Follow Up - Jeff Bezos nears deal to buy stakes in Liverpool FC (Aug 10, 2026)?

Amazon founder Jeff Bezos closing in on a deal to buy a roughly one-third stake in Liverpool, according to Sky News; Liverpool's controlling shareholder Fenway Sports Group preparing announcement this week; consortium is led by Amit Bhatia, son-in-law of steel billionaire Lakshmi Mittal.

SportsEconomics & Finance

Amazon founder Jeff Bezos closing in on a deal to buy a roughly one-third stake in Liverpool, according to Sky News; Liverpool's controlling shareholder Fenway Sports Group preparing announcement this week; consortium is led by Amit Bhatia, son-in-law of steel billionaire Lakshmi Mittal.

Will Liverpool FC or the consortium announce the deal before the beginning of 2026/27 Premier League?

Yes
0.00%
No
0.00%
0 Polls

This is the follow-up after our initial discovery, referring to our prior post:

Market Rumor - Amazon founder Jeff Bezos in talks to join consortium seeking 30% stake in Liverpool - July 22, 2026
The Amazon founder Jeff Bezos has held talks about joining the consortium that is seeking to buy around 30% of Liverpool.
Silicon Bakery - How Intensified Will the AI Infra Race Be? Behind: Intel's Capital Raising, Nvidia's AI Funding Plan, Microsoft's Bet on Indigenous Chips And More...
Analysis
SemiconductorMemory ChipIndustry PulseData CenterAI InfrastructureSilicon BakeryMag 7 Semi Analysis

Silicon Bakery - How Intensified Will the AI Infra Race Be? Behind: Intel's Capital Raising, Nvidia's AI Funding Plan, Microsoft's Bet on Indigenous Chips And More...

The AI infrastructure race intensifies as Intel raises capital, Nvidia builds a massive financing ecosystem, and Microsoft advances custom AI chips. Together, they signal a shift toward a broader AI supply chain powered by chips, capital, and scalable compute infrastructure.

Economics & FinanceTech

TL;DR:

  1. Intel Plans $20B Equity Raise
  • Intel is reportedly upsizing its share sale to around $20B, with demand exceeding $100B.
  • Shares are expected to price at ~$95 or above, about 6.5% below Friday’s close.
  • The fundraising supports CEO Lip-Bu Tan’s balance sheet cleanup strategy and comes amid a broader AI-driven capital raising wave.
  1. Nvidia Secures $500B AI Infrastructure Financing Network
  • Nvidia is partnering with Apollo, BlackRock, Blackstone, Brookfield, KKR, and Goldman Sachs to arrange up to $500B in AI infrastructure financing.
  • The plan focuses on debt financing for data centers and compute capacity using third-party capital.
  • The move highlights massive AI infrastructure demand but also raises concerns over AI spending sustainability and circular financing risks.
  1. Microsoft Prepares Maia 300 AI Chip Launch
  • Microsoft plans to unveil Maia 300 in September and is negotiating with TSMC for 300,000+ chips by 2027.
  • The custom AI accelerator aims to reduce reliance on Nvidia GPUs across Azure, Copilot, and OpenAI workloads.
  • Scaling risks remain due to TSMC capacity constraints, CoWoS packaging shortages, and rising competition from other custom AI chip developers.

Intel Is Said to Near Share Sale Upsize to Raise $20 Billion

Intel Corp. is seeking to increase the amount it’s raising in a share sale to about $20 billion, according to people familiar with the matter, a third more than it was targeting when it announced the deal Monday morning.

Will Intel Stock Price Recover to >US$105 by the end of August 2026?

Yes
61.89%
No
38.11%
530 Polls

The chipmaker is poised to price the offering at around $95 per share or above, the people said. At that level, the pricing would represent a discount of 6.5% to Friday’s closing price.

The offering could increase to well over $20 billion if a so-called over-allotment option is exercised, one of the people said. The share sale has drawn more than $100 billion in demand, they said.

Deliberations are ongoing and details including the size and pricing could still change, the people said. A spokesperson for Intel declined to comment.

JPMorgan Chase & Co., Goldman Sachs Group Inc., Morgan Stanley and Citigroup Inc. are working on the offering, according to a statement earlier. The deal is multiple times oversubscribed.

Intel’s shares were little changed in after-hours trading after falling 4.1% on Monday during normal market hours. They remain up roughly 164% this year, after Chief Executive Officer Lip-Bu Tan made cleaning up Intel’s finances a priority. The effort has included attracting outside investments from the US government and even chip rivals such as Nvidia Corp.

The year’s biggest US equity offerings have been dominated by companies riding the boom in artificial intelligence spending. Alphabet Inc. is in the process of raising as much as $85 billion through equity offerings, including so-called at-the-market share sales and equity-linked deals. And Oracle Corp.’s fundraising plans include a $20 billion at-the-market share sale program.


Nvidia Taps Wall Street for $500 Billion Funding Commitment

US investment giants including Apollo Global Management Inc., Blackstone Inc., BlackRock Inc. and Brookfield Asset Management are partnering with Nvidia Corp. to source $500 billion in financing for artificial intelligence infrastructure.

The coalition, which also includes Goldman Sachs Group Inc. and KKR & Co., will “create dedicated pools of capital at significant scale at attractive rates for Nvidia customers,” according to a statement Monday. Nvidia Chief Executive Officer Jensen Huang said in a CNBC interview that he approached only the six firms for the commitment, and none turned him down.

The effort comes with a huge headline figure but few details on the timing and structure of the financings, or how much the plan goes beyond the string of AI deals that are already driving a large chunk of Wall Street’s biggest transactions. Executives indicated that it will focus on debt financing to provide access to compute for Nvidia’s largest customers and that there are already many deals in the works that would qualify toward this commitment.

Nvidia has already signed hundreds of billions of dollars worth of deals with companies across the AI ecosystem, stoking concerns from some investors that the chipmaking giant is inflating demand and valuations across the industry through the circular nature of such agreements.

Nvidia Credit Risk Surges as $750 Billion AI Push Raises Financing Fears
The cost of protecting Nvidia Corp.’s debt against default surged by the most on record Monday, after reports of the chipmaker being in conversations on more than $750 billion of artificial intelligence infrastructure deals stoked fears about the company’s obligations.

Now, the firm is publicly tapping the biggest private markets firms to provide funding for its customers amid the trillions of dollars that are expected to be needed for the data centers, power stations and chips that will power the next era of AI.

The money will all be third-party capital, Huang said in the CNBC interview, which also featured executives from each of the six Wall Street firms.

“It’s a big infrastructure build, and the capital markets are signaling that there’s lots of capital available to support it,” Goldman Sachs CEO David Solomon said, adding that his firm is trying to find different ways of “getting the capital to the right places to extend this or accelerate this.”

Such deals are set to start coming to market within months, the person said.

As the only bank in the partnership, Goldman Sachs is positioning itself to be the lead bookrunner on the public debt deals coming to market for the deal. It will also gather investment returns from debt distributed through its asset-management arm, which oversees more than $4 trillion in assets.


Microsoft plans Maia 300 chip reveal in September

Microsoft is targeting a public unveiling of its next-generation Maia 300 AI accelerator as soon as September. It has also entered talks to secure manufacturing capacity for more than 300,000 units from TSMC, with delivery planned for 2027, The Information reported Monday.

Taiwan Semiconductor Manufacturing is the direct supply-chain beneficiary. Microsoft is negotiating with TSMC to fill an order that dwarfs the tens of thousands of Maia 200 chips produced to date. The longer-term ambition is capacity for more than one million units, though component supplies and ongoing packaging negotiations could constrain that target.

Will Microsoft or TSMC Officially Announce Maia 300 Partnership by end of 3Q2026?

Yes
21.93%
No
78.07%
538 Polls

The scale of the ambition marks a sharp turn from the Maia program's troubled recent history. The Maia 200 was delayed after early tests fell short of internal goals and has since been deployed in only a small number of data centers. CEO Satya Nadella told investors on Microsoft's Q4 FY2026 earnings call on July 29 that the chip delivers 30% better performance per dollar compared to existing hardware and is scaling to support OpenAI and MAI models. The limited footprint, however, underscores how far the homegrown silicon program still has to go.

Reducing dependence on Nvidia is a stated priority for Nadella. The Maia line is central to that effort. Microsoft believes its chips can run both in-house and OpenAI models at lower cost, and the company is ramping internal usage through Azure AI Foundry and Copilot while pitching the technology to large external cloud customers.

Anthropic is among the names Microsoft hopes to win over. That pitch has a complication: Anthropic confirmed earlier this month that it is forming its own internal semiconductor team to design custom chips for its Claude models, making the AI startup simultaneously a potential Maia 300 customer and an emerging long-term competitor in custom silicon.

Execution risks are real. J.P. Morgan analysts flagged that projects concentrated on TSMC's N3 process and CoWoS advanced chip-packaging technology face supply tightness through 2027, a constraint directly relevant to Microsoft's Maia 300 ramp.

All eyes will turn to Nvidia's Q3 FY2027 earnings, expected August 26, where management commentary on hyperscaler custom silicon competition will be parsed closely. A formal Maia 300 reveal in September, if it materializes, could serve as an early catalyst for that conversation — and a test of whether Microsoft's second-generation chip can deliver at a scale the first one never reached.


Source:

  1. Bloomberg; https://www.bloomberg.com/news/articles/2026-08-10/intel-is-said-to-near-share-sale-upsize-to-raise-20-billion?srnd=homepage-asia
  2. Bloomberg; https://www.bloomberg.com/news/articles/2026-08-10/nvidia-to-team-with-wall-street-on-500-billion-package-ft-says
  3. Yahoo!finance; https://finance.yahoo.com/technology/ai/articles/microsoft-plans-maia-300-chip-140432692.html
Breaking News - Micron's KeyBanc 2026 Takeaway: AI Boom Is Driving DRAM Shortage Beyond 2027
News
AI InfrastructureMemory ChipSemiconductorBreaking News

Breaking News - Micron's KeyBanc 2026 Takeaway: AI Boom Is Driving DRAM Shortage Beyond 2027

Micron Technology warned that the AI boom is creating a structural shortage in memory chips, with DRAM emerging as a critical bottleneck for AI infra expansion. The company expects supply constraints to continue beyond 2027.

Economics & Finance

Micron Technology warned that the artificial intelligence boom is creating a structural shortage in memory chips, with DRAM emerging as a critical bottleneck for AI infrastructure expansion. The company expects supply constraints to continue beyond 2027, as demand growth from AI applications continues to outpace industry capacity additions.

Will DRAM reports Q/Q Price Hike Again in 4Q2026?

Based on TrendForce data

Yes
87.33%
No
12.67%
529 Polls

At the KeyBanc Technology Leadership Forum, Micron Executive Vice President and Chief Business Officer Sumit Sadana said customers are increasingly facing constraints from DRAM availability rather than GPUs, power, data center space, or logic chips.

AI Infrastructure Faces a New Bottleneck: Memory

Micron said the current memory cycle differs from previous industry downturns and recoveries, as demand is being driven by a structural shift toward AI computing rather than traditional semiconductor cycles.

  • AI workloads require significantly higher memory bandwidth and capacity. Micron said processors, including GPUs and ASICs, can spend substantial amounts of time waiting for DRAM data, making memory performance a key limitation for AI system efficiency.
  • HBM production is tightening overall DRAM supply. Micron estimates that producing 100 bits of HBM requires approximately 300 bits of DDR supply to be redirected due to production trade-offs. With future generations such as HBM4E, the ratio could approach 4:1.
  • AI adoption remains in an early stage. The company expects enterprise AI deployment and AI agents to create additional demand, with agent-based AI workloads potentially requiring multiples of the computing resources used by current chatbot applications.

Supply Expansion May Not Catch Up Soon

Micron is accelerating investment to expand manufacturing capacity across multiple regions:

  • Japan, Taiwan, Singapore and India manufacturing expansion;
  • U.S. investment plan increased from $200 billion to $250 billion.

However, the company said it remains uncertain when supply will fully catch up with demand because AI-related demand continues to rise faster than new semiconductor capacity can be built.

Strategic Agreements Reshape Memory Market

To secure long-term visibility, Micron has introduced strategic customer agreements that differ from traditional memory contracts.

  • Multi-year commitments extending toward 2030;
  • Binding purchase obligations;
  • Upfront financial commitments from customers.

Micron said it had announced 16 strategic customer agreements involving $22 billion in cash and cash-equivalent commitments, including $18 billion in cash.

The company believes these agreements could fundamentally change the memory industry by creating a more stable, long-term supply model rather than relying on traditional spot-market cycles.

HBM Market Could Move Toward Fewer Suppliers

Micron also expects the HBM market structure to become more concentrated. The company said:

  • HBM development requires extensive engineering collaboration and long qualification cycles;
  • Customers are unlikely to work with three suppliers simultaneously across all AI platforms;
  • Many AI systems may ultimately rely on one or two HBM suppliers.

Beyond Data Centers: Physical AI Could Become the Next Demand Driver

Looking further ahead, Micron identified robotics and physical AI as another potential growth opportunity. The company expects humanoid robots to require significant local computing capacity, with each device potentially requiring:

  • Hundreds of gigabytes of DRAM;
  • Terabytes of SSD storage.

Micron said physical AI remains at an early stage but could become a major growth driver later this decade and beyond.

Market Implication

Micron’s comments highlight a potential shift in the AI supply chain: memory is moving from a cyclical semiconductor component to a strategic infrastructure constraint. As AI systems become more complex, the next limitation may not be computing power alone, but the ability to efficiently store and move data.

Source:

  1. Company press release; https://investors.micron.com/node/50806?
Market Rumor - Apple tests China's CXMT memory chips for iPhones and MacBooks
News
AI InfrastructureSemiconductorMarket RumorSupply ChainMag 7

Market Rumor - Apple tests China's CXMT memory chips for iPhones and MacBooks

Apple has been testing memory chips from China’s CXMT across products including iPhones and MacBooks as it seeks to ease supply pressures caused by booming AI demand.

Economics & FinanceTech

Apple has been testing memory chips from China’s CXMT across products including iPhones and MacBooks as it seeks to ease supply pressures caused by booming AI demand.

The company has also held early talks with CXMT about potentially supplying chips for devices sold in China, according to the Wall Street Journal.

Will Apple confirm CXMT as a memory-chip supplier by the end of 2026?

Yes
0.00%
No
100.00%
1 Polls

Global memory supplies have tightened as AI data centers absorb more capacity, increasing competition for components used in consumer electronics.

Adding CXMT could help Apple diversify beyond suppliers such as Samsung, SK hynix and Micron. However, any potential deal could face geopolitical scrutiny amid growing US restrictions on China’s semiconductor industry.

No final supply agreement has been announced.

Market Rumor - Apple seeks to buy memory chips from blacklisted Chinese company
iPhone maker wants Trump administration to sign off on purchases to ease pressure from rising semiconductor prices.

Source:

  1. Reuters; https://www.reuters.com/business/retail-consumer/apple-tests-chinas-cxmt-memory-chips-iphones-macbooks-wsj-reports-2026-08-09/?utm_source=chatgpt.com
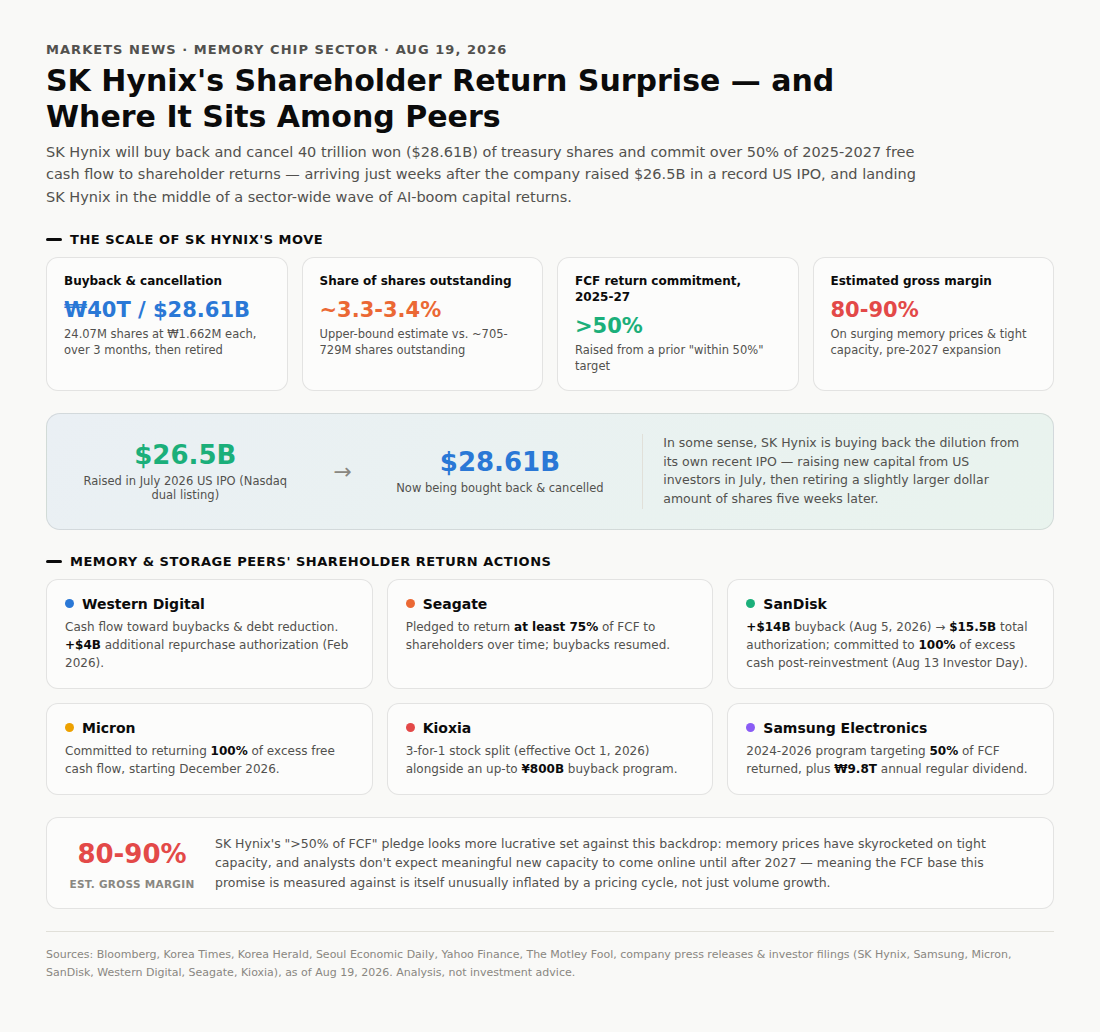
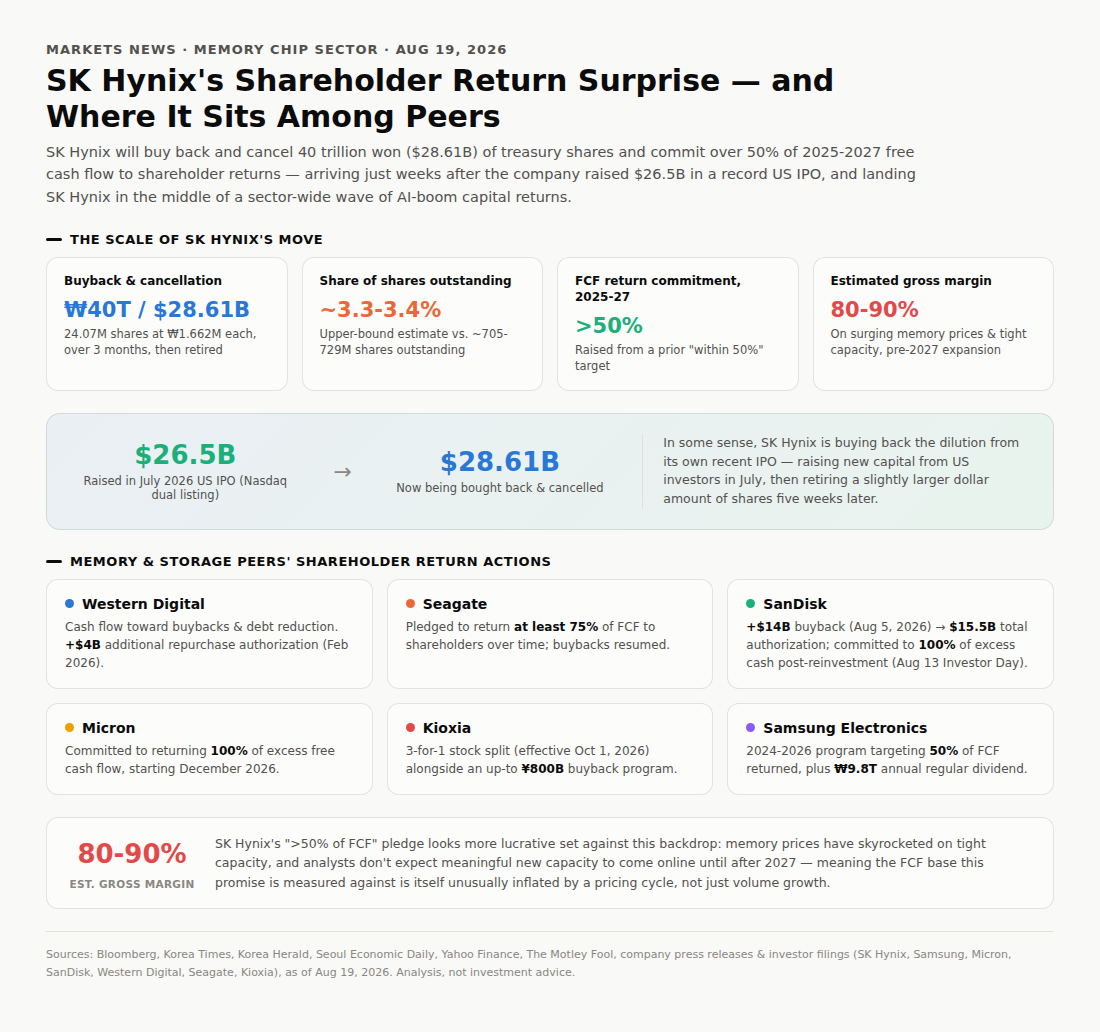
Market Rumor - SK Hynix Weighs Record Shareholder Returns
News
AI InfrastructureSemiconductorMemory ChipMarket Rumor

Market Rumor - SK Hynix Weighs Record Shareholder Returns

SK Hynix is considering a shareholder-return program that could become the largest in its history, according to Korean media reports, as earnings and cash generation increase alongside demand for high-bandwidth memory used in artificial-intelligence systems.

Economics & Finance

SK Hynix is considering a shareholder-return program that could become the largest in its history, according to Korean media reports, as earnings and cash generation increase alongside demand for high-bandwidth memory used in artificial-intelligence systems.

The reported package could total about 100 trillion won ($69 billion), with roughly 40 trillion won potentially allocated to share repurchases. SK Hynix has not confirmed those figures or the final structure of the plan.

Will SK Hynix announce a share buyback worth at least KRW 40 trillion by September 30, 2026?

Yes
0.00%
No
0.00%
0 Polls

The company said separately that it is reviewing additional measures aimed at enhancing shareholder value and expects to announce details in the third quarter. It has also declared a second-quarter cash dividend of 375 won per share, with Aug. 31 set as the record date.

The discussions come after a sharp increase in SK Hynix’s earnings, driven largely by sales of high-bandwidth memory, or HBM. The chips are used in AI accelerators and servers supplied to data centers operated by major technology companies.

SK Hynix reported record second-quarter operating profit as revenue increased from a year earlier. The company has also continued to expand production of advanced DRAM products as customers increase investment in AI infrastructure.

Management said HBM4, its sixth-generation high-bandwidth memory product, is expected to contribute more meaningfully to shipments in the second half of the year. Advanced DRAM shipments are also expected to increase over the same period.

At the same time, SK Hynix is continuing to invest in additional capacity. Capital expenditure is expected to rise this year as the company expands production infrastructure for HBM and other advanced memory products.

A potential increase in shareholder distributions would therefore take place alongside continued spending on manufacturing capacity. The balance between investment, dividends and possible share repurchases will depend on the structure of the additional shareholder-return measures due to be announced in the third quarter.

Results Review - Microchip Beats Q1 Estimates as Data Center and Defense Growth Accelerate
Quick Take
Earnings & OperationsAI InfrastructureSemiconductorData CenterIndustrials Semi Analysis

Results Review - Microchip Beats Q1 Estimates as Data Center and Defense Growth Accelerate

Microchip delivered a clear Q1 FY2027 beat and issued Q2 guidance substantially above expectations. Shares rose sharply following the release, consistent with a reset in near-term earnings expectations rather than revenue alone.

Economics & FinanceTech

Microchip delivered a clear Q1 FY2027 beat and issued Q2 guidance substantially above expectations. Revenue rose 38% yoy and 13.2% qoq to $1.485bn, above both the $1.456bn midpoint and the high end of management's prior range. Non-GAAP EPS was $0.76 versus management's $0.67-$0.71 outlook and ~$0.70 consensus. The larger surprise was forward-looking: Q2 non-GAAP EPS guidance of $0.91-$0.95 compares with ~$0.80 consensus, while the 66%-67% gross-margin guide moves above the company's 65% long-term model. Shares rose sharply following the release, consistent with a reset in near-term earnings expectations rather than revenue alone.

Will data center account for more than 20% of Microchip’s revenue in Q2 FY2027?

Yes
0.00%
No
0.00%
0 Polls

TL; DR: Key Takeaways

The earnings beat reflected operating leverage as well as stronger sales. Non-GAAP gross margin reached 63.8%, up 220 bps qoq and 55 bps above the high end of prior guidance, while non-GAAP operating margin expanded to 35.1%. Higher factory utilization, lower underutilization charges and product mix converted a 13.2% sequential revenue increase into a much larger profit improvement.

Q2 guidance exceeded expectations by an unusually wide margin. The $1.589bn-$1.618bn revenue range implies 7%-9% qoq growth and ~40.6% yoy growth at the midpoint. More importantly, the $0.93 non-GAAP EPS midpoint is ~16% above the cited consensus, suggesting estimates must move higher even without assuming another revenue beat.

Data center is becoming material, but the growth case extends beyond one end market. Microchip has said its Data Center Solutions unit should reach ~$500mn of calendar-2026 revenue, with another ~$500mn expected from data-center sales across power management, MCUs, analog, security, FPGA, timing and memory products. Management also described broad improvement across industrial, automotive and aerospace and defense, supporting a recovery-plus-structural-growth interpretation.

Source: Microchip

The 66%-67% gross-margin guide is notable, but not yet a new steady state. Favorable mix, licensing revenue, pricing, lower inventory write-downs and reduced underutilization costs all contribute. Some inputs can vary by quarter, and management cautioned against extrapolating further upside from this level.

Inventory and leverage are improving, but remain important constraints. Company inventory days fell to 175 from 185, while net debt declined by ~$170mn. The direction is positive, yet inventory remains elevated and long-term debt was $5.36bn at quarter-end, keeping cash deployment focused on deleveraging rather than buybacks.

Key Debates

  • Can non-GAAP gross margin remain near 66.5% after Q2?
  • How much of the current order strength reflects durable demand rather than supply-chain repositioning?
  • Can data-center revenue approach ~$1bn in calendar 2026 without becoming more concentrated?
  • Will industrial and automotive recovery add a second leg of growth?

Source:

  1. Company press release; https://ir.microchip.com/news-events/press-releases/detail/1409/microchip-technology-announces-financial-results-for-first-quarter-of-fiscal-year-2027
Defense & Aerospace Radar - Financing the Fortress: The European Defense Super-Cycle
Analysis
DefenseAerospaceDefense & Aerospace RadarIndustrialsIndustry Pulse

Defense & Aerospace Radar - Financing the Fortress: The European Defense Super-Cycle

Economics & FinancePolitics

Introduction: The End of the "Peace Dividend" and the Dawn of the Super-Cycle

The secular pivot in European defense is no longer a theoretical commitment; it is a structural reallocation of capital. For institutional investors, defense has completed a radical repricing, transitioning from an ESG outcast to a sovereign safe-haven asset. Following decades of post-Cold War atrophy—where spending collapsed from historical highs above 3% of GDP according to Funcas—the base-effect acceleration is now indisputable. Official data from the European Commission highlights that the bloc's combined defense budget expanded to €350 billion in 2024, establishing the institutional foundation for permanent military readiness, accelerated by the structural pivot of US strategic priorities away from the European theater. Confirming this immediate momentum, NATO's 2026 report documents a 19.6% real-term spending surge in 2025, pushing the average allocation across European Allies and Canada to 2.33% of GDP. This marks the definitive end of the peace dividend and the onset of an unprecedented multi-decade capital allocation super-cycle.

I. The Demand Shock: From Political Constraint to Structural Budgetary Rule

For institutional investors, the defense super-cycle represents a regime change driven by captive demand and multi-year revenue visibility, strictly decoupled from the civilian macroeconomic cycle. The catalyst is political: an EPRS report reveals that between 2022 and 2023, 78% of EU defense acquisitions were sourced outside the bloc. This capital flight forced a protectionist pivot, systematically locking public procurement within the European Defense Technological and Industrial Base (EDTIB).

Consequently, the budgetary execution is staggering. European Defence Agency (EDA) projections forecast a total defense budget of €454 billion for 2026, reaching 2.4% of GDP. Crucially, this is a hardware-driven Capex super-cycle. The EDA confirms €163 billion will be allocated strictly to equipment and investments in 2026, an explosive 158.7% increase compared to 2021. This permanently transforms European prime contractors into cycle-immune assets with guaranteed income.

II. Capacity Bottlenecks: Historical Book-to-Bills and Supply Rigidity

For institutional investors, the defense sector paradigm has decisively shifted from demand generation to execution risk. A massive influx of public capital is currently colliding with profound supply rigidity, exacerbated by a critical dependency on imported raw materials. The ReArm White Paper explicitly warns that the European supply chain is heavily constrained by slow production capacities and structural fragmentation, making industrial scale-up a critical operational challenge.

This severe inelasticity of supply is mathematically proven by recent corporate earnings, as prime contractors book contracts at an unsustainable velocity relative to their billing capabilities. Rheinmetall perfectly exemplifies this capacity saturation, reporting a record backlog of €63.8 billion, which represents a 36% year-over-year explosion. Concurrently, the firm maintained strong pricing power, achieving an exceptional 18.5% operating margin. Similarly, Thales recorded a massive €25.26 billion in order intake, aggressively driving its total backlog above the €50 billion threshold.

In light of the severe capacity bottlenecks across the European defense sector, what is your primary equity allocation strategy for H2 2026?

Strict Stock-Picking (Alpha). We are exclusively targeting Prime Contractors with proven delivery capabilities and resilient supply chains.
0.00%
Broad Sector Exposure (Beta). We are maintaining passive/ETF allocation to capture the aggregate €454bn institutional budget surge, regardless of short-term execution delays.
100.00%
1 Polls

III. The Sovereign Equation: Fiscal Space, Crowding-Out, and the Defense Eurobonds Bet

Financing the NATO defense mandates purely through national balance sheets is fracturing the eurozone. As Reuters highlights, sovereign heavyweights like France, Italy, and the UK face immediate budgetary strain, proving that isolated funding models are structurally exhausted.

This fiscal exhaustion triggers severe macro-financial risks. IMF Working Paper 26/53 (Furceri et al.) demonstrates that defense fiscal multipliers are highly asymmetric: while reaching 1.9 under optimal conditions, this efficacy collapses in high-spread environments. If heavily indebted peripheral states issue uncoordinated debt, skyrocketing borrowing costs will crowd out private investment and crush economic growth. Furthermore, market participants cannot simply rely on the European Central Bank’s Transmission Protection Instrument (TPI) to endlessly absorb defense-driven deficits without unanchoring inflation expectations.

Mutualization is therefore a mathematical necessity for yield curve stability. BBVA Research validates that the €150 billion SAFE instrument is vital to bypass the lethal "snowball effect" that compresses fiscal space. To protect peripheral issuers and prevent fatal spread widening across the continent, Defense Eurobonds remain an absolute necessity.

With European national deficits widening under the weight of accelerated rearmament, how are you pricing the eurozone sovereign risk?

Pricing in Fiscal Slippage. We are actively hedging against peripheral debt (e.g., Short BTP/OAT or Long Bunds), expecting national balance sheets to fracture under the defense burden.
0.00%
Betting on Mutualization. We are remaining neutral on spreads, anticipating the inevitable political consensus for EU-backed "Defense Eurobonds" to absorb the shock.
0.00%
0 Polls

Conclusion: The Binary Allocation Hour

The era of broad-brush defense exposure is dead. As Morgan Stanley’s June 2026 downgrade from "Overweight" to "Equal Weight" signaled, buying sector Beta no longer works amidst stretched valuations and fading momentum. The market has returned to raw fundamentals: Reuters’ Q2 2026 earnings reporting underscores that top-line narratives are over, and bottom-line execution is king. Investors must pivot to strict stock-picking (Alpha), targeting only high-conviction executors capable of converting backlogs into cash.

This execution mandate collides directly with BlackRock’s 2026 Midyear Outlook framework on the twin scarcity of materials and capital. Supply chain bottlenecks strangle unequipped contractors, while soaring debt issuance puts immense upward pressure on yields.

Our ultimate portfolio directive is binary: go long ultra-selective defense equities that master execution, while shorting or underweighting vulnerable European sovereign bonds as a hedge against fiscal slippage and unmutualized debt strain. Capital demands real delivery—position the desk where cash is collected, not spent.

References

I. Institutional & Policy Frameworks

  • BlackRock Investment Institute (2026). Mid-Year 2026 Global Outlook: Scarcity vs. Abundance (The Sovereign Cost of Security).
  • Consilium of the European Union & European Defence Agency (2026). EU Defence in Numbers.
  • European Commission (2024). European Defence Industrial Strategy (EDIS). Brussels.
  • European Commission (2025). White Paper on the Future of European Defense (ReArm Europe Plan).
  • European Parliamentary Research Service - EPRS (2024). Improving the quality of European defence spending. Briefing.
  • Funcas Intelligence (2025). EU defense spending and trade outlook. Policy Paper.
  • North Atlantic Treaty Organization - NATO (2026). Annual Report 2025–2026, presented by Secretary General Mark Rutte.

II. Economic Research & Sovereign Analysis

  • BBVA Research (2025). EU Priorities: Defence Spending & Multipliers. Economic Watch.
  • International Monetary Fund - IMF (2026). Furceri et al., Working Paper Vol. 2026, Issue 053: Macroeconomic Impacts of EU Defense Spending.

III. Corporate Disclosures & Market Intelligence

  • Morgan Stanley Research (June 2026). European Defense Shares Retreat Following Morgan Stanley Sector Downgrade. Equity Research Note.
  • Rheinmetall AG (March 2026). Financial Report: FY 2025 Results. Düsseldorf.
  • Reuters (Spring/Summer 2026). Analysis: NATO defence push already strains Europe's budgets & European corporate outlook continues to improve as earnings season gathers steam.
  • Thales Group (March 2026). Full-Year 2025 Financial Results. Paris.
Macro & Micro Compass - Southern Europe’s Structural Decoupling: A Macroeconomic Reassessment for Institutional Capital
Analysis
EnergyAI PowerCapital MarketsEconomicsMacro & Micro CompassMacroeconomics

Macro & Micro Compass - Southern Europe’s Structural Decoupling: A Macroeconomic Reassessment for Institutional Capital

Economics & FinancePolitics

The macroeconomic paradigm within the eurozone has structurally inverted. While the traditional Franco-German core faces industrial stagnation—with 2026 GDP growth forecasts capped at 0.8% and 0.9% respectively—Southern Europe is now driving regional expansion. Spain (2.1%), Portugal (2.0%), and Greece (1.8%) are demonstrating genuine volume expansion, net of price effects. This "Mediterranean Pivot" is forcing institutional investors to aggressively reassess their continental asset allocation.

The NGEU Liquidity Shield and Zero-Cost CapEx

This structural decoupling is insulated by the NextGenerationEU (NGEU) framework, which acts as a sovereign equity injection. In a restrictive monetary environment where European Central Bank (ECB) tightening typically triggers a crowding-out effect, NGEU grants bypass bond markets entirely. Spain’s €79.85 billion in non-repayable subsidies and Greece’s massive €35.95 billion allocation (15.96% of GDP) absorb initial CapEx risks for green and digital infrastructure, allowing private capital to co-invest at a zero-cost public financing basis. Italy’s €194.38 billion PNRR, while experiencing execution friction, remains the continent's largest modernization deployment, specifically targeting Industry 4.0.

Energy Arbitrage and Margin Expansion

The primary driver of inbound Foreign Direct Investment (FDI) into the Iberian Peninsula is now structural OPEX predictability, driven by an aggressive energy transition. Spain has crossed the threshold of 57.5% renewable electricity generation, with zero-marginal-cost wind and solar constituting over 41% of the mix. This translates to severe wholesale price deflation: the Iberian OMIE market cleared between €40 and €55/MWh in 2024–2025, compared to Germany’s €75–€90/MWh, which remains burdened by a fossil-heavy grid. This energy competitiveness spread justifies the strategic relocation of heavy industry. Capital flows reflect this arbitrage, with entities like Cepsa deploying €7 billion into green hydrogen in Andalusia, and Asian OEMs (CATL/Stellantis) executing €4.1 billion greenfield battery projects in Zaragoza. Energy sovereignty has fundamentally evolved from an ESG metric into a core catalyst for EBITDA margin expansion.

Labor Cost Decoupling and Transatlantic Capital Capture

This energy dividend is compounded by sustained wage competitiveness and optimized fiscal engineering. Eurostat’s 2025 estimates highlight a stark labor cost spread: Germany approaches €45.00 per hour, while Spain (€26.40), Italy (€32.00), and Portugal (€19.40) offer highly attractive cost-to-skill ratios for engineering and R&D talent. Concurrently, competitive corporate tax frameworks—Greece at 22%, Spain at 25%, and Portugal leveraging deep SIFIDE innovation tax credits—are driving robust capital inflows. In 2023, Spain captured $35.9 billion in FDI, establishing itself as the premier European holding hub for Latin American capital. LatAm FDI into Spain surged by 138% year-over-year to €2.83 billion, pushing the accumulated stock (including ETVE holding structures) to €66.88 billion. Madrid now functions as a highly capitalized, transatlantic corporate gateway, effectively bypassing Northern European financial centers.

Beyond NGEU public subsidies, what is the primary structural driver forcing Northern European industry to aggressively relocate operations to the Mediterranean basin?

The "Energy Arbitrage": Structural OPEX deflation driven by zero-marginal-cost renewables.
100.00%
The "Labor Decoupling": A highly competitive cost-to-skill ratio for engineering and manufacturing talent.
0.00%
2 Polls

Nearshoring and Digital Infrastructure

Geopolitical fragmentation and supply chain regionalization are physically reshaping the Mediterranean basin. As industrial players shift from just-in-time to buffer inventory models, Southern ports are absorbing the reallocated trade flows. While Rotterdam contracted by 0.7% in 2024, Valencia surged by 14.15% (5.47 million TEUs), and Piraeus expanded transshipment activity by 17.6%.

Simultaneously, the region is capturing massive digital infrastructure allocations. Driven by hyperscalers seeking available grid capacity and land, Milan is targeting 500 MW of data center capacity by 2026 (Knight Frank), with Microsoft separately committing €4.3 billion to AI and cloud infrastructure in the Milan/Turin area. Greece is following suit, anchoring the undersea cables connecting Europe to Africa and Asia.

Systemic Constraints and Risk Pricing

Despite this alpha-generating environment, institutional allocation requires rigorous risk pricing. The region’s structural headwinds remain severe. Elevated debt-to-GDP ratios—Greece at 149.7%, Italy at 137.8%, and Spain at 103.2%—create persistent vulnerability to sovereign spread widening under the ECB’s monetary normalization. Investors must price in a long-term fiscal risk premium, as heavily leveraged balance sheets limit future public co-investment capacity. Furthermore, a demographic contraction presents an acute supply-side labor shock. With fertility rates critically low (Spain at 1.10, Italy at 1.18) and old-age dependency ratios approaching 40 in Italy (39.0), Portugal (38.6), and Greece (37.4) - (Spain, 31.2), domestic consumption bases are shrinking while scarcity-driven wage inflation looms.

Conclusion: The Selective Institutional Mandate

Southern Europe is no longer a peripheral risk to be hedged, but the continent's primary engine for alpha generation. However, capturing this "Southern Premium" requires a surgical approach. For asset managers, the strategic mandate is strict and binary: overweight export-oriented automation, decarbonized heavy industry, and logistics real estate, while ruthlessly avoiding domestic retail exposure and sovereign debt vulnerability. In 2026, the smart money does not buy the Mediterranean broadly—it buys its infrastructure.

Given the tension between booming industrial growth and elevated debt-to-GDP ratios, what is the correct institutional playbook for the "Mediterranean Pivot"?

Overweight the Infrastructure: Aggressively buy physical real assets (logistics, data centers, green energy) to capture the alpha.
0.00%
Underweight the Region: Avoid the exposure entirely due to looming demographic winters and ECB crowding-out risks.
0.00%
0 Polls

Abridged Data Sources & Bibliography:

  • Macroeconomics & Fiscal Policy: International Monetary Fund (WEO 2026 Projections); European Commission (Recovery and Resilience Scoreboard, Q1 2026).
  • Energy & Industrial CAPEX: Red Eléctrica de España (2024–2025 data); Ember (European Electricity Review 2024); OMIE / EPEX SPOT.
  • Labor, Demographics & Sovereign Debt: Eurostat (2025 Estimates on Hourly Labour Costs, Debt/GDP, and Fertility Rates).
  • Capital Flows (FDI): UNCTAD (World Investment Report 2024); ICEX-Invest in Spain & SEGIB (VI Global LATAM 2024 Report).
  • Logistics & Digital Infrastructure: Port Authorities (Valencia, Piraeus, Rotterdam 2024 Reports); Knight Frank (Data Centres EMEA Report).
Macro & Micro Compass - The July ISM Breakdown: Are Business Costs Starting to Rise Again?
Analysis
Macro & Micro CompassIndustrialsSupply ChainEconomicsMacroeconomics

Macro & Micro Compass - The July ISM Breakdown: Are Business Costs Starting to Rise Again?

Businesses entered Q3 with stronger orders and higher costs, but little appetite to hire. July’s ISM data points to the next pressure on prices and margins.

Economics & Finance

The July ISM Manufacturing and Services reports are finally in (landing August 3 and August 5, respectively), giving us our first clean look at how US businesses entered Q3.

With investors desperately trying to figure out if the economy can keep humming without poking the inflation bear, these two reports carried way more weight than usual.

Long story short, cost pressure is flaring up again in services, and manufacturing is still expensive, although its Prices Paid Index actually eased in July.  

At headline level, manufacturing did most of the moving, with its PMI jumping from 53.3 to 55.6. Services barely budged, edging from 54.0 to 54.1.

The real million-dollar question now is how much those costs rose, and how much gets dumped onto the consumer.

54.1 services headline hides much stronger demand and cost pressure

The Services PMI barely moved from 54.0 to 54.1. It averages four different indexes, and they pulled in opposite directions in July.

Business Activity surged 3.7 points to 59.1, its second-highest level since May 2024, New Orders climbed from 55.1 to 57.2, and 13 of the 18 covered industries posted outright growth.

Taken together, it looks like accelerating activity and stronger incoming work. Still, before we crown this as a genuine Q3 demand surge, it’s worth pointing out that at least part of July’s strength was tied to the World Cup.

Technically, this looks like a stronger Q3 kickoff than the main score lets on, so why did the headline lag?

Source: Trading Economics – ISM Non-Manufacturing Employment

Employment dropped from 51.2 to 47.4, dragging the index down. On top of that, Supplier Deliveries dropped from 54.4 to 52.8. Anything above 50 means deliveries are slowing, but not as widespread as in June. Also, slower deliveries lift the overall PMI, so the improvement actually held the headline down. Simply put, service-sector supply became less bad.

This makes the price increase even more interesting because companies reported broader cost pressure even as delivery problems eased. The rise in services costs despite less widespread delivery deterioration suggests that factors beyond the month-to-month change in bottlenecks were also at work.

Although Prices Paid is not one of the components of headline PMI, it climbed from 67.7 to 70.3, marking its fourth reading above 70 in five months. So even if delivery pressure eased, companies were still paying more.

Source: Trading Economics – Services Prices

At the company level, 44.7% of respondents said they paid more in July, while 3.2% paid less and the remainder reported no change.

When ISM grouped those responses by industry, 17 of the 18 sectors registered higher prices and none recorded an overall decline. Some individual companies therefore found cheaper inputs, but they were too few to pull any industry into lower-price territory.

Manufacturing is expensive, but the read is a bit different

The headline PMI jumped from 53.3 to 55.6, the strongest reading in more than four years.

Manufacturing input inflation remains equally elevated, though it moved in the opposite direction. The factory Prices Paid Index eased from 73.0 to 71.1 in July, but Supplier Deliveries rose from 57.4 to 58.9, showing manufacturers faced longer delays even as price growth cooled slightly.

Stacked together, this isn’t a fresh, uniform supply shock. Factories are fighting worsening bottlenecks, while service providers are enjoying smoother deliveries yet getting slammed with broader price increases. Fuel explains part of it (especially post-oil disruptions), but systemic cost pressure is popping up everywhere else, with ISM also listing beef, copper, software licensing, steel products and transportation among the items rising in price.

What would convince you that July’s cost pressure is more than a one-month flare-up?

Prices Paid stays above 70 in August
0.00%
CPI and PPI accelerate
100.00%
Q3 corporate margins weaken
0.00%
New orders remain in the high 50s
0.00%
1 Polls

Prices Paid leaves out the most important transaction

There is a main flaw in relying purely on the ISM cost number, it measures breadth rather than magnitude. A tiny 1% cost bump at one firm counts the exact same as a 50% surge at another. More importantly, it tells you zero about what the final retail customer pays.

In all likelihood, companies intend to pass the bill to you eventually. In ISM’s planning survey, 59% of service companies plan to transfer (at least some) tariff/input costs to buyers, and 77% of manufacturers plan to do the exact same thing.

But will consumers accept it? Individual comments in the July survey illustrate where resistance is emerging:

  • Construction: One firm reported falling sales despite offering bigger discounts.
  • Wholesale: Builders are fighting back against price increases.
  • Transportation: Fuel and labor are spiking, but one transportation respondent described demand as stable.

When businesses face higher costs but customers refuse to pay higher prices, the business has to eat the difference, which is known as a margin squeeze.

For equity investors, the truth will come out in Q3 earnings: higher selling prices with stable sales volume means pricing power; flat prices, heavy promotions, or shrinking gross margins mean corporate earnings are swallowing the blow.

The hiring drop is awkward, but not straightforward

The Employment Index has now spent 12 of the last 18 months in contraction territory. July’s drop to 47.4 suggests service firms are soaking up heavy demand without hiring at the same pace.

This doesn’t automatically mean official job reports are going to crash. In fact, historical data shows ISM Services Employment is a notoriously poor predictor of official Bureau of Labor Statistics (BLS) payrolls.

What it does point to is a push for efficiency. Second-quarter productivity rose at a 1.4% annualized rate, more than double the 0.6% consensus forecast, while unit labor costs increased 1.3% versus the 2.1% economists expected, so there is at least some evidence that companies are getting more from each hour worked.

So, one question would be: are efficiency and AI saving the day?

Sort of, but we don’t have nearly enough data yet to credit AI for this efficiency gap. The fact that the Employment Index contracted means companies are meeting this massive surge in demand without hiring more workers. Cost-cutting, outsourcing, and plain old hiring caution could also explain this gap.

For now, all we can really say is that businesses appear to be getting more output without starting another broad hiring cycle.

Here is what I would watch next

The July employment report arrives on August 7. If payrolls come in under ~80k and unemployment ticks past 4.2%, the ISM hiring warning becomes harder to brush off. If it comes in hot with high wage growth (average hourly earnings rise by 0.4% or more on the month), inflation fear comes back with a vengeance.

If CPI and PPI both surprise higher, front-end yields and the dollar would probably move up, while long-duration technology stocks could come under pressure. If PPI accelerates while CPI stays contained, that would strengthen the case that upstream price pressure had not yet fully reached consumer prices. Attention would then shift toward corporate margins, as investors assess whether businesses are absorbing some of that pressure rather than passing it fully to customers.

The early warning starts to break down if August’s Services Prices Paid Index falls below roughly 65, delivery times move closer to normal (the neutral 50 level), and the official inflation reports remain contained.

Upcoming earnings calls will reveal the truth: who has real pricing power, and which companies are left holding the bag.

Which risk do you think markets are underpricing after the July ISM reports?

Another inflation spike
0.00%
Weaker corporate margins
0.00%
A sharper hiring slowdown
0.00%
None, the economy can absorb the pressure
0.00%
0 Polls

Sources

Institute for Supply Management: July 2026 ISM Manufacturing PMI Report

Institute for Supply Management: July 2026 ISM Services PMI Report

Institute for Supply Management: Seasonal Adjustment Factors and Diffusion-Index Methodology

Institute for Supply Management: ISM Supply Chain Planning Forecast Is Another Sign of the Economy’s Resilience

Institute for Supply Management: ISM Report Release Date Calendar

Reuters: US Manufacturing Activity Hits More Than Four-Year High; Input Prices Elevated

Reuters: US Service Sector Maintains Strong Growth Pace in July

Reuters: US Productivity Rises Faster Than Expected in Second Quarter

US Bureau of Labor Statistics: Schedule of Selected Releases for August 2026

US Bureau of Labor Statistics: Schedule of Releases for Productivity and Costs