Premier info portal for prediction markets. The start point of information market.
Defense & Aerospace Radar - US Defense Backlog Growth Looks Bullish. Manufacturing Capacity Says Otherwise
Analysis
Capital MarketsDefenseIndustrialsIndustry PulseGDPDefense & Aerospace Radar

Defense & Aerospace Radar - US Defense Backlog Growth Looks Bullish. Manufacturing Capacity Says Otherwise

Defense contractors keep winning, but the industrial base keeps losing time. A look at the budget data and what the market isn't pricing in on defense.

Economics & FinancePolitics

PwC's mid-year 2026 aerospace and defense outlook shows the five largest U.S. primes closing FY2025 with a combined $1.36 trillion backlog, up 23.7% year-over-year. Markets have priced this as record orders, rising budgets, primes trading at 20-25x forward earnings.

The Navy has been trying to deliver two Virginia-class submarines a year since 2011. It is currently delivering 1.3. The Congressional Budget Office puts the average delay at four years past the dates written into the original contracts, and this gap grew, not shrank, between 2025 and 2026, despite billions already spent trying to close it.

Current valuations appear to assume that most backlog converts with relatively limited execution risk. Delayed delivery doesn't shrink the backlog number itself, but it defers revenue recognition, pressures margins on fixed-price contracts, and slows cash generation. Basically, the things the multiple is actually being paid for. But step back and there's a simpler read hiding underneath all three: the market keeps treating a signed contract as a promise the industry can keep on schedule. Increasingly, it can't.

PwC's own report says as much: M&A is now being used as "a practical fix for capacity that organic investment cannot close quickly enough" across aircraft, engines, and shipbuilding.

Put simply, ships, engines, and munitions are stuck behind a wall of missing welders, pipefitters, and electricians.

So, can the industry staff the shop floor fast enough to fill them on schedule?

Where do you come down on defense backlog right now?

Backlog is real revenue
50.00%
Capacity gap is underpriced
25.00%
Depends on the name (some primes, not others)
0.00%
Waiting on Q2 earnings before deciding
25.00%
4 Polls

Here’s what the market is actually betting on

Defense budgets are expanding on both sides of the Atlantic. NATO members are treating higher spending as a durable planning assumption rather than a crisis response, and PwC notes that European revenue has grown by double digits across major US contractors this year.
Source: SPGlobal

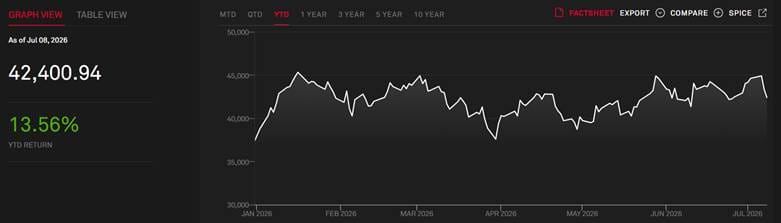
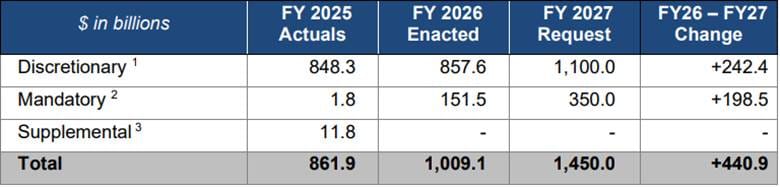
The sector itself has risen roughly 15% since early 2026, outpacing the broader market, and Wall Street's baseline demand assumptions keep getting revised up, not down, as the FY2027 NDAA authorizes $1.15 trillion in military spending, and President Trump has floated pushing the number to $1.5 trillion.
Source: Department of War

On paper, this is a sector with multi-year revenue visibility that few others in the market can match.

What's notable is what the skeptics are actually skeptical about. Wells Fargo's David Strauss cut his Lockheed target by 12% and his Northrop target by 23% this week, but his reasoning was multiple compression after a period of "meaningful underperformance" relative to the defense budget's growth, so a valuation call, not a delivery call.

Nobody on the sell side is downgrading these names because the Navy can't find welders. The debate happening in research notes is entirely about whether the stocks have gotten ahead of themselves on price.

The issue? The market is pricing contracts as if they were deliveries

Companies aren't buying market share. They're buying the physical and human capacity to build things they've already been paid to build. When M&A becomes a substitute for organic capacity expansion, that's a tell that internal capacity isn't growing fast enough on its own.

The clearest example of this problem, though not the only one, is in shipbuilding, where almost all US defense construction capacity sits. Navy Secretary John Phelan said this year that the maritime industrial base needs roughly 250,000 new shipbuilders over the next decade just to hit existing fleet plans.

McKinsey's read of Department of Labor data lands in the same range, estimating a shortfall of 200,000 to 250,000 workers. This isn't a hiring problem that money fixes quickly. According to the same source, about 27% of shipbuilders are already 55 or older, first-year attrition among new welders and electricians runs as high as 20-22%, and a welder qualified for nuclear submarine work takes years of certification, not weeks of training.

The Columbia-class submarine program, the Navy's top acquisition priority, was contracted for an 84-month build and is now tracking closer to 96 months, with delivery pushed toward 2028, according to Congress. The Navy has attributed part of this slip to late turbine generators and a delayed bow section, both manufacturing execution problems rather than funding or design issues.

The Constellation-class frigate program is the more dramatic case: the Navy cut the program from a planned 20 ships to 2 in November 2025, after delays of at least three years pushed the first delivery from 2026 to 2029, driven in large part by workforce shortfalls at the building yard in Wisconsin.

The Pentagon's own FY2027 budget request sets aside $3.1 billion specifically for "wage increases... to recruit and retain workers" at nuclear shipyards, and a separate workforce line for castings, forgings, and munitions plants. This is the government's own diagnosis of the bottleneck, not an outside critic's.

Four triggers to watch next

1.    Q2 earnings, late July

Lockheed and Northrop report the same week, RTX close behind. Backlog may rise again, but that's not the number that matters. Watch book-to-bill against free cash flow, and whether more fixed-price charges show up on the same programs that are already behind.

2.    Shipyard workforce data from the Department of Labor and Navy budget submissions

The Navy's Maritime Industrial Base program is now tracking hiring against its 250,000-worker target. If those numbers show meaningful progress by early 2027, some of this thesis weakens.

If attrition stays in the 20%-plus range and headcount growth stalls, expect more Columbia- and Constellation-style schedule resets across other programs, including Virginia-class submarines and the next tranche of destroyers.

These programs represent different segments of the industrial base (submarines, the surface combatants, and strategic deterrence), suggesting the issue is broader than a single contractor.

3.    Further M&A aimed explicitly at capacity rather than capability

PwC flags distressed acquisitions of qualified facilities and roll-ups of Tier 2/3 suppliers as an active 2026 trend. T3 Defense Inc. (NASDAQ: DFNS) raised $20 million in February specifically to keep buying suppliers it describes in SEC filings as sitting at "critical bottlenecks at the sub-OEM level."

An acceleration of these deals, especially forced or distressed transactions rather than strategic ones, would confirm capacity scarcity is worsening, not stabilizing.

4.    Munitions: Delivered units, not stated capacity

The Pentagon's targets call for PAC-3 MSE output rising from roughly 600 to 2,000 units a year by 2030 and PrSM output roughly quadrupling. Lockheed says its PAC-3 ramp is currently running ahead of commitments. If that holds across other programs, and if NATO's roughly sixfold increase in 155mm shell capacity since 2022 keeps translating into delivered rounds rather than just announced capacity, this is the strongest evidence the market has this right rather than wrong.

The gap between capacity announcements and delivered units program by program is the one number that settles this either way.

The bottom line

The market is paying a premium for hardware that doesn't exist yet, on a delivery timeline the industrial base keeps failing to hit, and nobody pricing these stocks is discounting for this gap.

Submarines are four years late.

Munitions ramps depend on workers who don't exist.

Fixed-price programs are bleeding cash on the exact contracts the backlog is supposed to convert.

Until delivery data starts closing the gap, this trade is a bet on an industrial base that hasn't earned the multiple yet.

Which trigger will you actually be watching?

Q2 earnings
0.00%
Shipyard workforce data
0.00%
Capacity-driven M&A activity
0.00%
Delivered munitions units vs. stated capacity
0.00%
0 Polls

Sources

  1. Breaking Defense: What the Constellation-class frigate’s cancellation means for Navy, Fincantieri
  2. CBO: Testimony on Challenges Facing the Navy’s and Coast Guard’s Shipbuilding Programs and the Shipbuilding Industrial Base
  3. Congress.Gov: Navy Columbia (SSBN-826) Class Ballistic Missile Submarine Program: Background and Issues for Congress
  4. CSIS: Is the Industrial Base on a Wartime Footing? A Progress Report
  5. Department of War: Budget Overview Book
  6. ExecutiveGov: Trump Wants $1.5T Defense Funding for FY 2027 to Build ‘Dream Military’
  7. GlobeNewswire: T3 Defense Inc. Announces Private Placement of up to $20 Million to Accelerate Acquisition Strategy
  8. McKinsey & Company: Helming a sea change: Building the future workforce for US shipbuilding
  9. PwC: A&D dealmaking reprices around capability, backlog, and production certainty
  10. USNI News: SECNAV: Shipbuilders Need to Hire 250,000 Workers Over the Next Decade for ‘Golden Fleet’
  11. USNI News: Virginia Subs Will Hit 2-A-Year Build Rate in 2030s, CNO Caudle Says
Consumer Pulse - Sold Out, Soon Illegal: Inside China's AC Export Boom
Analysis
GeopoliticsIndustry PulseConsumer SpendingConsumer Pulse

Consumer Pulse - Sold Out, Soon Illegal: Inside China's AC Export Boom

Chinese air conditioners keep flying off European shelves, but the product driving this year's boom won't legally exist in Europe by 2029. Here’s what the market isn't pricing in on the China AC trade.

Economics & FinancePolitics

Europe's worst heatwave on record has turned into a genuine earnings boom for Chinese appliance makers. Midea, Haier, and Gree are all reporting strong 2026 growth into a market that's suddenly desperate to cool down.

Chinese AC exports to the EU hit $3.76 billion in the first half of 2026, up 43.2% year-over-year. Midea's PortaSplit line has shipped more than 200,000 units this year alone, doubling sales every year since launch. Gree's installation backlog in France now runs into late August.

None of this growth accounts for what happens to the product itself in two and half years.

Most of the units driving this boom run on R32 refrigerant, with a global warming potential of 675. The EU's F-Gas Regulation bans split air-conditioning systems under 12 kilowatts (basically all standard home AC units fall under this line) from using any refrigerant above a GWP of 150, starting January 1, 2029. R32 at 675 is more than 4x over this line.

So, is this year's export boom built on a product line that has a legislated shutoff date?

Where do you land on China's AC export boom to Europe?

I'd buy the momentum
50.00%
I'd be cautious
50.00%
Depends entirely on which manufacturer
0.00%
Need more data before I'd take a position
0.00%
4 Polls

The demand case: Nobody can bet against a heatwave

The demand case is real and well-documented. Samsung told Reuters it expects "sustained demand through the peak cooling season."

Only about one-fifth of European households currently own air conditioning, against a continent the World Meteorological Organization says is warming at more than twice the global average.

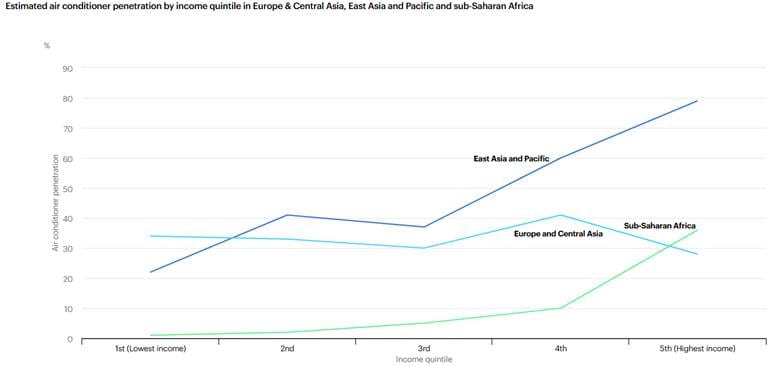
The IEA estimates that AC ownership remains highly income-dependent in Europe, with penetration still well below East Asia even among wealthier households.

Source: IEA

Morningstar is forecasting a "meaningful" boost to Chinese manufacturers' second- and third-quarter revenue specifically from this trade.

There's a political layer too, and it's arguably bullish, not bearish. Brussels wants to narrow its trade deficit with China by October, but can't act aggressively against a product category that's currently keeping European households from heat stroke.

European Trade Commissioner Maros Sefcovic has said "the status quo is not an option" on the broader trade imbalance, yet no formal anti-dumping case has been opened against AC imports specifically, even as some EU lawmakers have floated tariffs of 15-25%.

For now, Europe needs the units too badly to restrict them.

But there’s a blind spot: The refrigerant deadline

R32 isn't a minor technical detail, it's the refrigerant charge inside the exact split units currently selling at record volume. Once the EU's GWP 150 threshold takes effect for split systems in 2029, existing installed systems can continue operating, but manufacturers cannot place newly produced non-compliant split systems on the EU market after the deadline.

The fix exists, but it isn't free. R290 (propane) has a GWP of 3, comfortably under the threshold, and Chinese manufacturers aren't starting from zero either because Midea has been developing R290 compressor technology since 2004 and has sold Blue Angel-certified R290 split units in Germany since 2021.

But R290 is flammable, requiring explosion-proof design work that industry estimates put at a 20%-30% cost increase per unit.

And per Danfoss's own read of the regulation, a Danish refrigeration manufacturer with no obvious stake in flattering China's position, the split-system replacement is a "serious problem," one "raised by many industry associations." To reiterate, it's not a Chinese outlet arguing its own manufacturers have an edge, it's a European supplier to the same industry admitting nobody has a clean, cost-competitive answer yet.

This leaves a real question sitting underneath a growth trade everyone's already pricing as durable: how much of today's export volume is riding a refrigerant line that has two and a half years left, and how cleanly does that volume convert to the compliant product once the deadline actually bites.

What actually tells you which way this breaks

1.     Manufacturer roadmap disclosures. As of this writing, Midea, Haier, and Gree all already sell R290 units in Europe, but what none of them have disclosed is what share of this year's export surge, the actual R32 volume driving current earnings, is converting.

2.     R290 unit pricing versus R32. If the 20%-30% cost premium narrows meaningfully as volume scales, the transition risk shrinks. If it holds or widens, expect margin pressure to show up in future guidance before it shows up in headlines.

3.     The EU-China October trade deadline. A tariff or import-restriction outcome here could compress the runway to 2029 significantly, layering political risk on top of the regulatory one.

4.     Manufacturer or third-party disclosure of finished-unit refrigerant mix. Chinese export codes track bulk refrigerant chemicals (R32, R290, etc.) separately from finished air conditioners, with no code that says what's charged inside the units actually shipped. The only way this number surfaces is if a manufacturer, industry body, or market research firm discloses it directly. Right now, that data isn't public, so its absence is itself worth noting.

The bottom line

The heatwave is real, and so is the demand, but what isn't being priced is that the product generating those beats has a shelf life set by EU law, not by weather.

Chinese manufacturers may be better positioned than anyone to make this switch. Midea's decade-plus head start on R290 is a genuine advantage, and history suggests EU trade barriers alone haven't been enough to dislodge a scaled Chinese cost advantage once it's established.

In fact, the EU's 2013 anti-dumping tariffs on Chinese solar panels are the clearest precedent: the European Commission's own 2018 review found domestic manufacturers never recovered the market share the tariffs were meant to protect, while a leading German producer went bankrupt anyway.

But "well positioned to eventually comply" and "already compliant at the volume being sold today" are different claims, and current earnings expectations appear to assume a relatively smooth transition, even though manufacturers have not disclosed enough evidence to verify that assumption.

Which signal will you actually be watching?

Manufacturer production-share disclosures (R290 vs. R32)
2.80%
R290 cost premium narrowing or widening
14.02%
The EU-China October trade deadline outcome
78.51%
Manufacturer or third-party disclosure of finished-unit refrigerant mix
4.67%
107 Polls

Sources:

  1. Business Standard: Europe's heatwave lifts demand for China's portable air conditioners
  2. China Daily: Chinese cooling appliances ride Europe's heat wave with smart, installation-free designs
  3. CNBC: Europe wants to rebalance trade with Beijing, but can’t quit Chinese air conditioners
  4. Danfoss: Refrigerant policies and regulations
  5. European Central Station: Chinese air conditioners are selling like hotcakes in Europe, and European air-conditioner merchants have issued a warning: if they cannot beat Chinese manufacturing, they will change the rules.
  6. European Commission: Air conditioning
  7. European Commission: Press remarks by Commissioner Šefčovič on the EU-China Trade and Investment Consultations
  8. IEA: Staying cool without overheating the energy system
  9. Reuters: As Europe roasts in a heat wave, Asia's air-con makers grab some cool cash
  10. ScienceDirect: Protectionism's adverse impact on renewable energy deployment: evidence from the European Union's import duties on China-made photovoltaic panels
  11. United Nations: Energy efficient and climate-friendly split air conditioners now on sale in Europe
  12. World Meteorological Organization: Temperatures in Europe increase more than twice global average
Arbitrage Traders Face Tougher Challenge With SK Hynix Than TSMC
News
SemiconductorCapital Markets

Arbitrage Traders Face Tougher Challenge With SK Hynix Than TSMC

Arbitrage desks looking to trade SK Hynix Inc.’s new American depository receipts are dusting off playbooks from Taiwan Semiconductor Manufacturing Co. But many say the comparison only goes so far.

Economics & Finance

Arbitrage desks looking to trade SK Hynix Inc.’s new American depository receipts are dusting off playbooks from Taiwan Semiconductor Manufacturing Co. But many say the comparison only goes so far.

Unlike TSMC, whose ADRs have decades of trading history that provide investors with a sense of where the premium to local shares tends to settle, SK Hynix’s ADRs begin trading for the first time on Friday. That leaves arbitrage investors without a historical benchmark for what constitutes a normal premium, making it far harder to judge when a spread is attractive or stretched.

The challenge extends beyond the lack of price history.

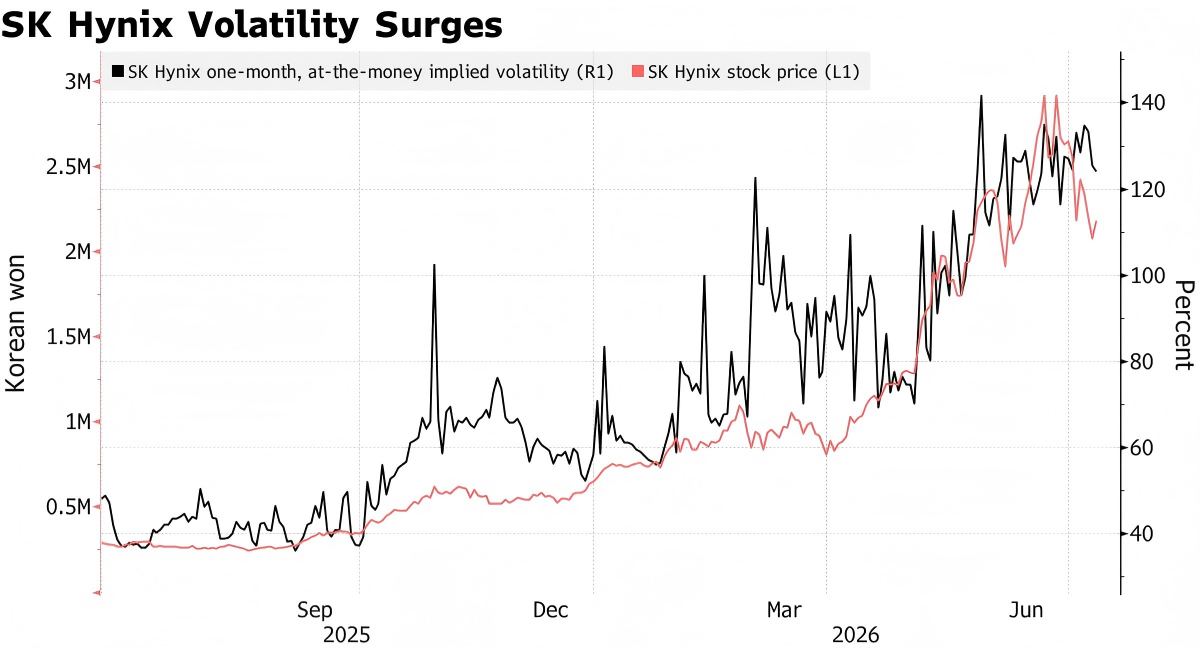
SK Hynix has become one of Asia’s most volatile large-cap stocks, regularly posting outsize daily swings as investors pile into AI-linked memory names and leveraged products tied to the shares. Those sharp moves increase the gap risk — the danger that the ADR and Seoul-listed stock diverge significantly from the trend the arbitragers were betting on.

“With SK Hynix’s volatility, the gap risk is much higher,” said Alex Au, managing director at Alphalex Capital Management HK Ltd., who traded TSMC’s ADR spread for years. “So for someone putting on this trade to capture the premium, you’d demand higher returns.”

Source: Bloomberg

Another uncertainty is the extent to which Seoul-listed shares can be converted into American depository receipts. According to a July 6 filing, holders of the US instruments will be able to cancel them and receive the corresponding number of Seoul-traded shares. But investors may not be able to later exchange the common stock for ADRs as such a transaction could require approvals such as permission from Korean regulators.

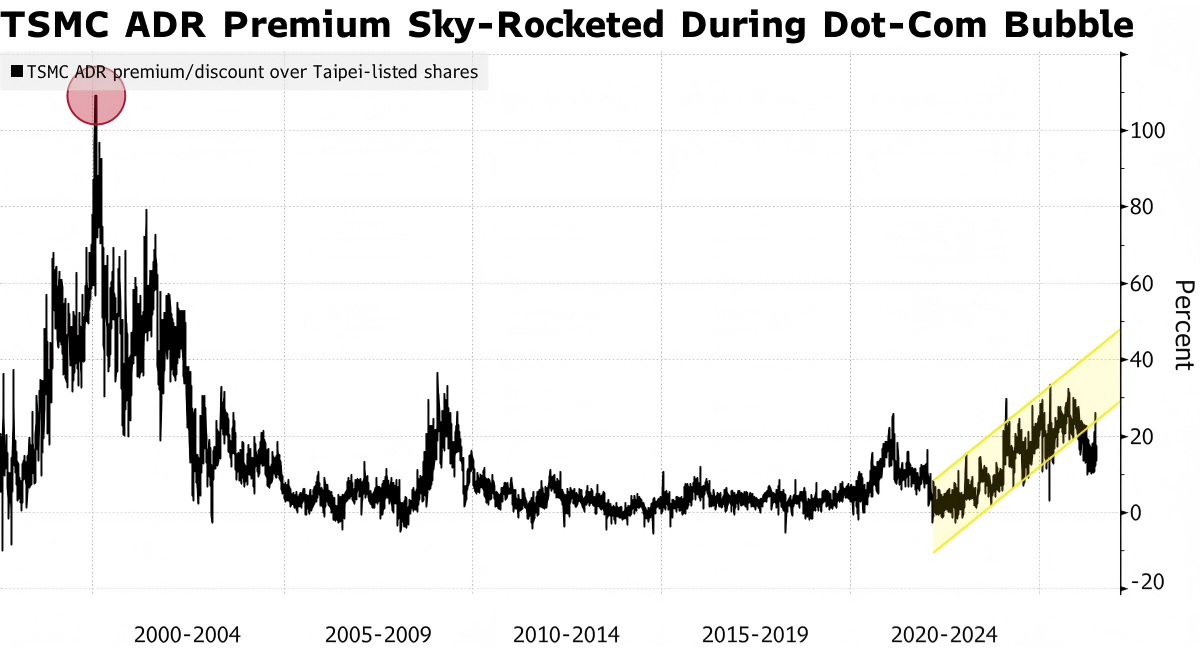
By comparison, traders have years of experience with TSMC’s partially fungible shares. Even though the spread has widened during the AI boom, investors have historical patterns to help assess when premiums become excessive and are likely to mean-revert.

TSMC’s ADRs traded at an average premium of 16% over the past month, according to data compiled by Bloomberg. The price difference largely showed a mean-reversion trend, which made it one of the most popular relative value trades before the current AI frenzy distorted the dynamic.

Source: Bloomberg

Institutional investors have floated estimates for an initial premium for the SK Hynix ADR ranging from about 5% to more than 30%, underscoring just how uncertain the market remains ahead of the debut. Morgan Stanley’s sales and trading desk on Wednesday estimated the gap in the 5% to 10% range, with scope to increase if the ADR is included in US indexes or exchange-traded funds, according to a note to institutional clients seen by Bloomberg.

Will SK Hynix ADR close at a premium of at least 16% to its Seoul-listed shares on its first trading day?

Yes
66.67%
No
33.33%
3 Polls
TBD

“Until it has seasoned, nobody will know what that premium is worth from day to day,” said Travis Lundy, an independent special situations analyst who publishes on Smartkarma. “History shows they can go high but don’t stay super high.”

Source: https://www.bloomberg.com/news/articles/2026-07-09/arbitrage-traders-face-tougher-challenge-with-sk-hynix-than-tsmc

Macro & Micro Compass - Japan’s borrowing costs soar to 30-year high on debt fears
News
EconomicsCapital Markets

Macro & Micro Compass - Japan’s borrowing costs soar to 30-year high on debt fears

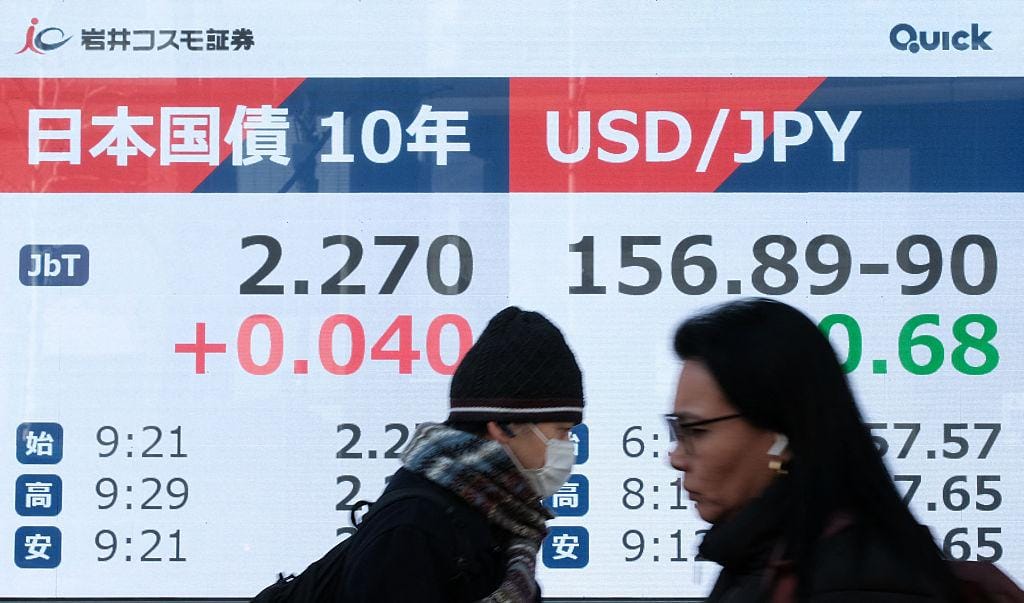
Japan’s borrowing costs have climbed to their highest in 30 years as investors grow increasingly concerned about the country’s heavy debt burden, weakening yen and a $2.3 trillion long-term spending plan proposed by Prime Minister Sanae Takaichi.

Economics & Finance

Japan’s borrowing costs have climbed to their highest in 30 years as investors grow increasingly concerned about the country’s heavy debt burden, weakening yen and a $2.3 trillion long-term spending plan proposed by Prime Minister Sanae Takaichi.

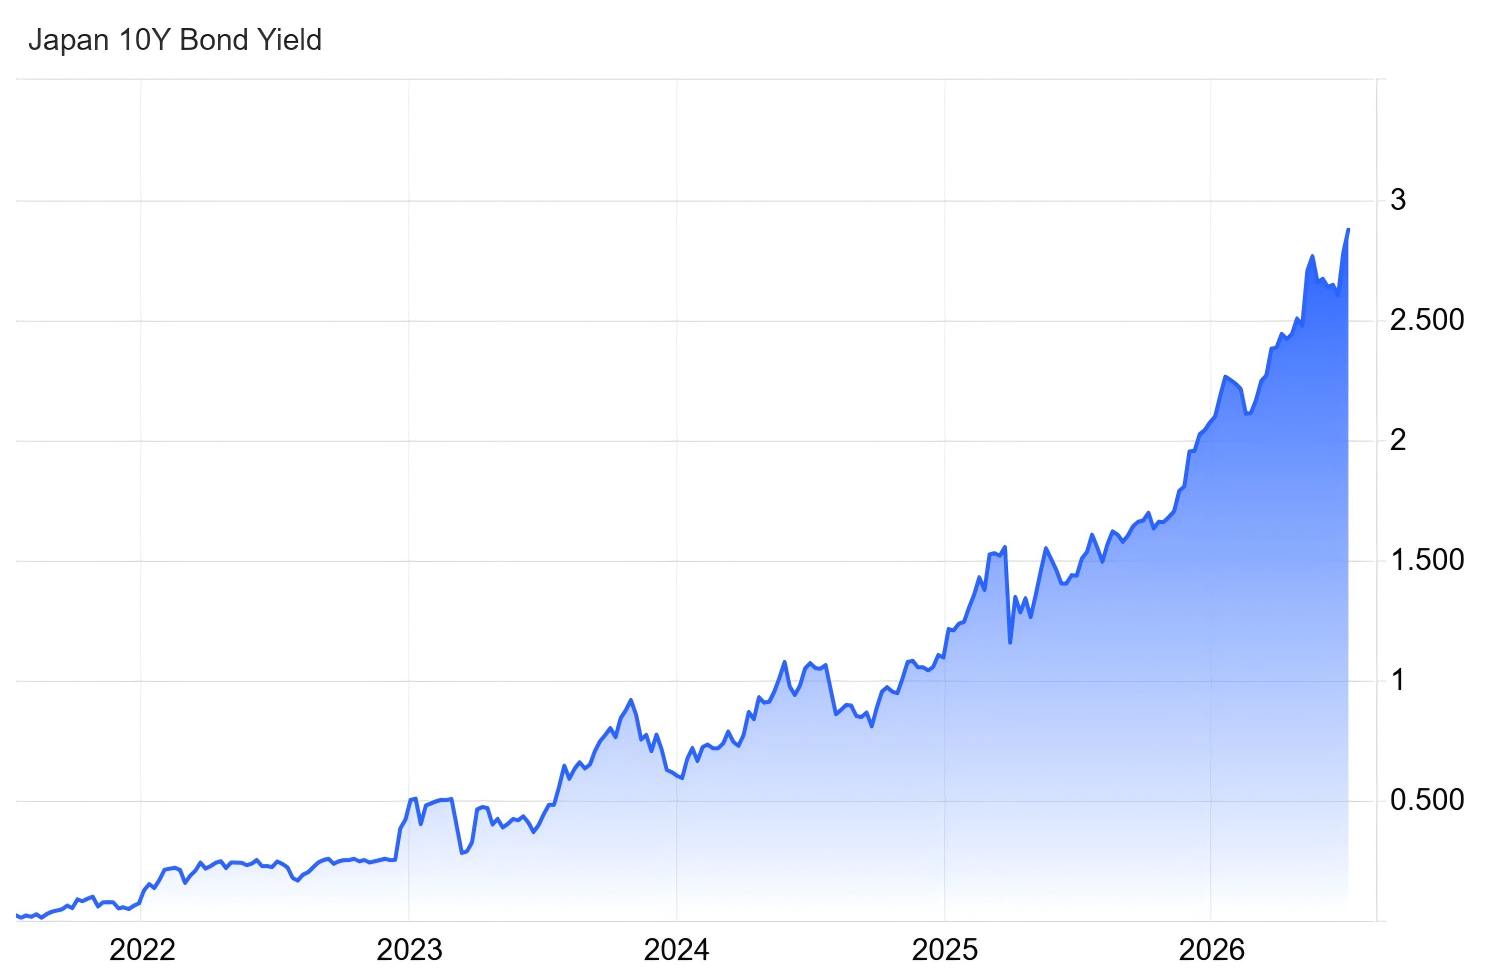
A sharp sell-off in Japanese government bonds has pushed the benchmark 10-year Japanese Government Bond (JGB) yield to 2.87%, its highest level since 1996. The 30-year JGB yield has risen above 4.0%, hovering close to its record intraday high of 4.2% reached in May 2026. Meanwhile, the Bank of Japan (BOJ) raised its short-term policy rate to 1.0% last month, the highest level in 31 years, as inflation remains above its 2.0% target.

Source: TradingEconomics

For decades, Japan was able to sustain government debt exceeding 200% of GDP because ultra-low interest rates and the BOJ's large-scale purchases of government bonds kept borrowing costs exceptionally low. That model is now being tested as the central bank normalizes monetary policy and gradually reduces its support for the bond market, prompting investors to demand higher yields on long-term government debt.

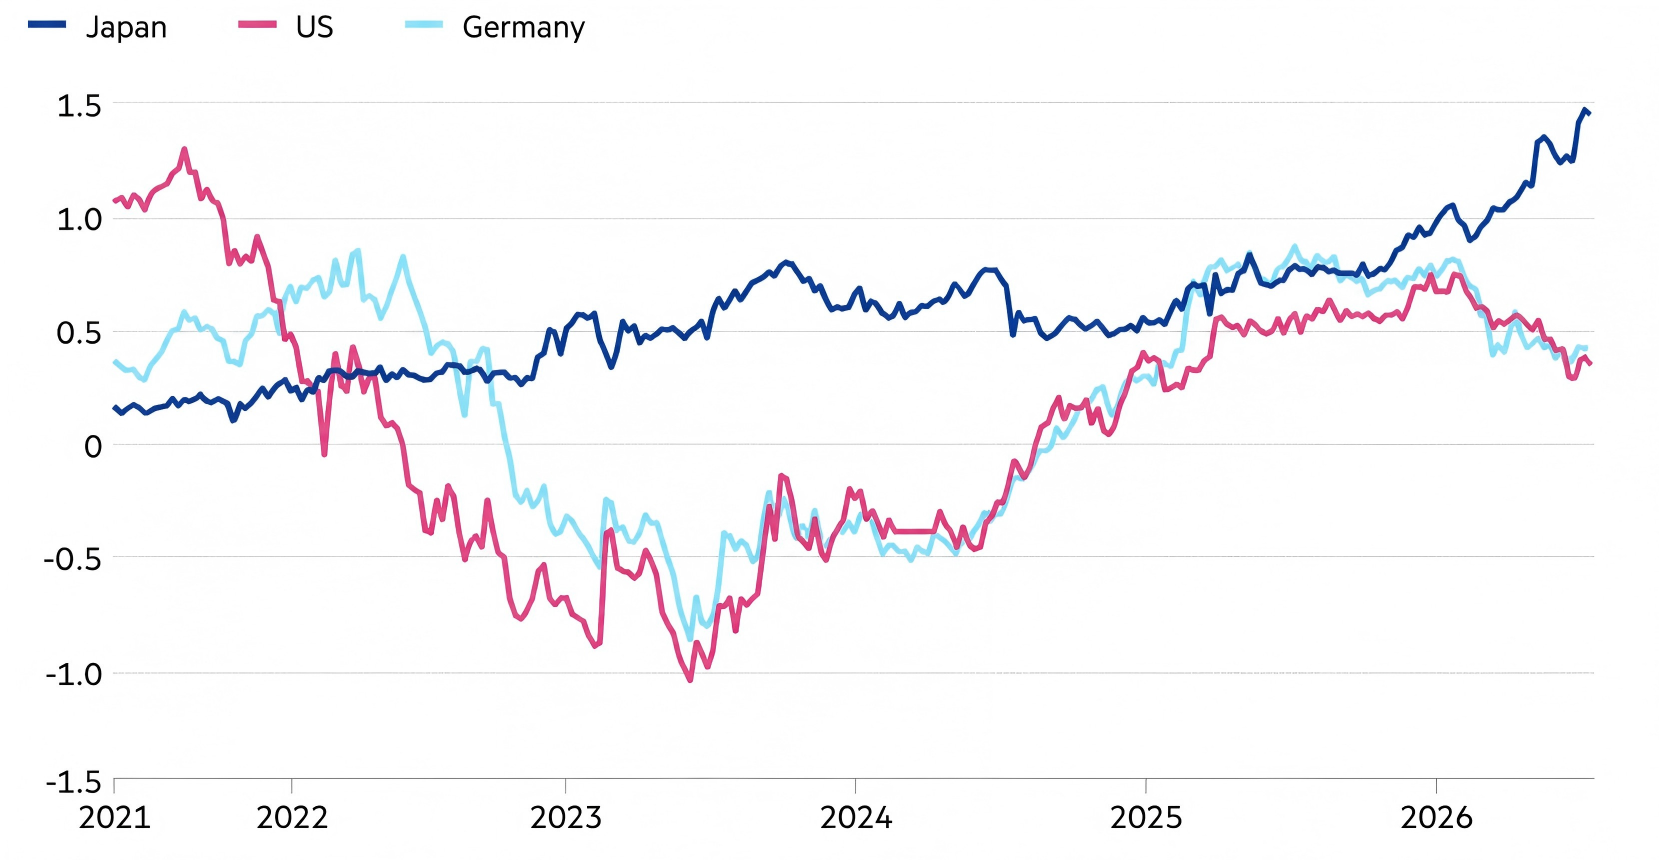
Investor concerns have intensified after Takaichi unveiled a $2.3 trillion fiscal spending plan to be implemented over the next 14 years, raising fresh questions about Japan's long-term fiscal sustainability. The growing anxiety is also reflected in the yield curve. The spread between Japan's 10-year and 2-year government bond yields has widened from less than 1.0 percentage point in April to approximately 1.4 percentage points, while equivalent yield spreads in the United States and Germany have remained flat or declined.

Spread of 10-year over 2-year yield, percentage points Source: Financial Times

Stephen Spratt, a rates strategist at Société Générale, said Japan could face mounting scrutiny if the 10-year JGB yield climbs toward 3%, as higher borrowing costs risk outpacing government revenue growth and worsening the country's debt dynamics.

"We think the tipping point is somewhere above 3%, but investors will likely begin asking questions once the 10-year yield reaches 3%," Spratt said.

Will Japan's 10-year government bond yield reach 3.0% before 2026?

Yes
100.00%
No
0.00%
2 Polls

Higher borrowing costs are increasing pressure on Japan's public finances. Japan's government debt remains above 200% of GDP—the highest among major advanced economies—and rising refinancing costs could further increase interest payments, putting additional strain on the country's fiscal position.

The implications could also extend beyond Japan. Some institutional investors warn that a further rise in JGB yields could attract capital away from other sovereign bond markets, pushing global borrowing costs higher. Countries such as the United Kingdom, where long-term borrowing costs have already reached multi-decade highs earlier this year, could also come under additional pressure.

"That's the risk, that it creates a global sell-off," said Ludovic Subran, Chief Investment Officer at Allianz, adding that Japan's bond market could become "one more layer" of stress for global financial markets.

Source: https://www.ft.com/content/851aa883-073f-4423-a43e-9b09fdbe7c86?syn-25a6b1a6=1

Polymarket Is Back in the U.S. But the Bigger Story Is What Comes Next
Quick Take
RegulatoryPrediction Market

Polymarket Is Back in the U.S. But the Bigger Story Is What Comes Next

Economics & FinancePolitics

For more than three years, Polymarket operated outside the U.S. after settling charges with the U.S. Commodity Futures Trading Commission (CFTC) in early 2022. It changed when Polymarket acquired CFTC-regulated exchange and clearinghouse QCX, giving it a legal pathway back into the American market. Since then, Polymarket US has begun filing exchange rules, incentive programs, and event contract certifications with the CFTC as it prepares for a broader rollout.

Which factor will matter most for prediction markets in the U.S. over the next three years?

Clearer federal regulation
33.34%
Better trading liquidity
33.33%
Greater institutional participation
0.00%
Wider public adoption
33.33%
I have my own unique opinion
0.00%
3 Polls

The return itself is significant, but it is probably not the biggest story.

The more important question is whether Polymarket's reentry shows that prediction markets are moving from a regulatory experiment into a recognized part of U.S. financial infrastructure.

From Regulatory Outlier to Licensed Exchange

The back of Polymarket looks differ from other platform who left the U.S.. Instead of rely on the off-chain crypto platform, Polymarket chose to acquire an already licensed derivatives exchange rather than wait years for a new license. That acquisition gave it access to an established regulatory framework while allowing it to operate under CFTC oversight. Reuters reported the transaction followed the company's acquisition of QCEX and QC Clearing, which provided the legal infrastructure necessary for a U.S. relaunch.

Since then, Polymarket has submitted multiple filings covering exchange rulebooks, liquidity incentive programs, and election related event contracts, suggesting the company is preparing for long-term regulated operations rather than a limited pilot.

A Different Regulatory Environment

Polymarket is also returning to a market that has changed dramatically.

Several years ago, prediction markets occupied a legal gray area. Today, event contracts have become part of a broader policy debate involving regulators, exchanges, and state governments.

Kalshi's legal victories helped establish that at least some event contracts could operate within the U.S. derivatives framework. And the CFTC has opened a formal rulemaking process to determine how prediction markets should be regulated in the future. Polymarket submitted comments arguing that regulated prediction markets improve price discovery and information aggregation, while acknowledging that clear regulatory standards remain necessary

This does not mean regulatory uncertainty has disappeared.

There are still ongoing debates regarding which contracts should be permitted, where the boundary between financial forecasting and gambling should be delineated, and how federal authority should interact with state-level restrictions.

Competition is About More Than Users

Most media reported Polymarket's return as a direct challenge to Kalshi.

Competition certainly matters, but the deeper contest may involve market design.

Kalshi operates within a fully regulated U.S. financial framework, while Polymarket built its reputation as a crypto native global platform with great liquidity and international participation. Bringing those strengths into a regulated U.S. exchange, then a boarder question comes: which model will traders prefer ultimately?

The answer could influence how future prediction markets are structured—not only in the United States but globally.

Why This Matters Beyond Prediction Markets Itself

The implications extend well beyond one company.

If multiple regulated exchanges begin listing(which is already in process) event contracts on politics, economics, weather and other real world events, prediction markets could become another source of market based expectations alongside traditional surveys, analyst forecasts, and futures markets.

Supporters argue these markets aggregate dispersed information more effectively than opinion polls, while critics worry that certain contracts could encourage speculation on sensitive public events. The CFTC's ongoing review is expected to play a central role in defining where those boundaries ultimately lie.

Therefore, Polymarket's return to the U.S. is not simply a company expanding into a new market.

It represents another step in the gradual institutionalization of prediction markets.

Whether this can become a lasting shift will depend less on one platform's trading volume or liquidity, it is more about whether regulators, exchanges, and investors can agree on where prediction markets fit within the U.S. financial system.

Source:
1. Polymarket's CFTC settlement and the long road back to US usersJun 30, 2026 https://legalclarity.org/polymarkets-cftc-settlement-and-the-long-road-back-to-us-users/

  1. Polymarket US, May 5, 2026 https://www.cftc.gov/sites/default/files/filings/orgrules/26/03/rules03052640396.pdf

Breaking News - China to Allow Top AI Firms to Buy Nvidia H200 Chips
News Flash
SemiconductorHyperscalersAI InfrastructureMag 7Breaking NewsSilicon BakeryGeopolitics Semi News

Breaking News - China to Allow Top AI Firms to Buy Nvidia H200 Chips

China is planning to allow the country's leading AI companies to purchase a limited number of Nvidia's H200 AI chips, according to The Information, citing two people with direct knowledge of the matter.

Economics & FinanceTechPolitics

China is planning to allow the country's leading AI companies to purchase a limited number of Nvidia's H200 AI chips, according to The Information, citing two people with direct knowledge of the matter.

The report said Chinese officials have recently informed companies including Alibaba, ByteDance, and DeepSeek that they may soon receive approval to buy a limited quantity of Nvidia's H200 chips. The move would mark a notable shift in Beijing's approach to advanced AI hardware imports.

Will China be able to buy H200?

Yes
75.00%
No
25.00%
4 Polls

The development comes after the U.S. government approved Nvidia's sales of H200 chips to China and granted export licenses to around 10 Chinese companies. However, Chinese authorities had previously delayed their own approvals as they sought to support the growth of domestic AI chipmakers. Reuters reported in March that Nvidia had already secured Beijing's long-awaited approval to sell the H200 chips in China.

News of the potential policy change boosted investor sentiment. Nvidia shares rose in Wednesday morning trading following the report.

The reported shift also highlights the growing shortage of AI computing power in China. Demand for advanced AI chips has continued to outpace supply as Chinese technology companies expand their investments in large language models and other generative AI applications.

Source: https://www.reuters.com/video/watch/idRW634908072026RP1/

The Bonds Hidden Inside Prediction Markets
Analysis
Must ReadCapital MarketsRegulatoryPrediction Market

The Bonds Hidden Inside Prediction Markets

Prediction markets start as probability markets. Near certainty, some of them quietly become more like bond markets.

Economics & FinancePolitics

Most people open a prediction market and see probabilities.

A contract trading at 52 cents? The market thinks the event has a 52% chance.

A contract trading at 9 cents? Longshot.

A contract trading at 98 cents? Basically done.

That is the normal way to read these markets. But it is somewhat incomplete.

Because when an event contract gets close to certainty, it starts to behave less like a bet and more like a bond.

Not always. A 50-cent contract or a 10-cent longshot is still mostly about information. But a 98-cent contract that will not redeem for six months? That is a different animal. It is essentially a tiny fixed-income product wearing a prediction-market costume.

Do you understand what the word "bond/bonding" means in prediction-market contexts?

Yes, and I've used this strategy before
0.00%
Yes, but I've never used this strategy before
100.00%
No, I don't
0.00%
4 Polls

From odds to yield

Prediction market prices are often interpreted as probabilities because of its payout structure: a winner-take-all contract pays $1 if an event happens and $0 if it does not. Wolfers and Zitzewitz famously provided a theoretical case for why prediction market prices can be treated as probability-like signals under reasonable assumptions (but some are sometimes non-negligible in real life!).

This idea is useful. It is why prediction markets are interesting in the first place.

But it works best when the main question is still "Will the event happen?"

Near certainty changes the question and shifts the focus to something else.

When a contract trades at 97, 98, or 99 cents, the important question may no longer be "am I right?" It may be "When do I get paid?" or "Should I hold the contract into resolution or sell it now?"

That is the fixed-income layer hiding inside prediction markets.

A normal bond asks:

  • How much do I pay today?
  • How much do I receive later?
  • How long do I wait?
  • What risk do I take while waiting?

A near-certain prediction market contract asks almost the same thing:

  • Price today: $0.96
  • Expected payout: $1.00
  • Time to settlement: 300 days
  • Risks: settlement risk, liquidity risk, platform risk

So yes, it is still a prediction market contract. But economically, it starts to look like a zero-coupon event bond.

What is an event bond?

Let’s define it loosely.

An event bond is a near-certain prediction market position where the main economic question is no longer "will this happen?" but "what yield am I earning while waiting for settlement?"

This is not an official product category. You will not see a tab on Polymarket called "bonds". But the economics are there. The word "bond" is a slang term in the prediction markets community.

When you buy a contract at $0.96 and it later redeems at $1, your nominal gain is 4.17%. But that number is almost meaningless by itself.

If settlement happens tomorrow, that is huge.

If settlement happens in a year, that is the annual yield.

If settlement gets disputed, delayed, or blocked by some platform issue, that gain suddenly looks less sure, and it functions more like a risk premium in order to compensate you.

This only makes sense when event risk is close to zero. If the outcome is still genuinely uncertain, then the contract is not a clean event bond. It is a risky bond with default risk. The closer a contract gets to certainty, the more it starts to look like fixed income.

The Jesus market was not theology but duration

A recent paper, When Certainty Is Not Worth It: Capital Lock-Up and Settlement Discounting in Prediction Markets, makes this idea very clear.

The authors point to Polymarket’s "Will Jesus Christ return in 2025?" market. For months, the near-certain NO side traded around $0.96. At first glance, that looks absurd. Was the market really saying there was a 4% chance of the Second Coming? Probably not.

A better reading is that the market was pricing a delayed dollar. A trader buying NO at $0.96 could earn about 4.2% if the position eventually redeemed at $1, but only after locking capital for most of the year. That discount can be consistent with near certainty once you account for outside returns, liquidity needs, and residual platform risk.

So, the trade was not about miracles. It was about duration, or how much you should be compensated for locking your money in the contract for almost a year.

A contract below $1 does not always mean the market thinks the event still has real uncertainty. Sometimes the market is saying, "believe this wins, but I need to be paid to wait."

The hidden yield curve

The paper formalizes this as settlement-induced discounting. Instead of treating price as pure probability, it writes the price as: Price = Expected payoff × Settlement discount.

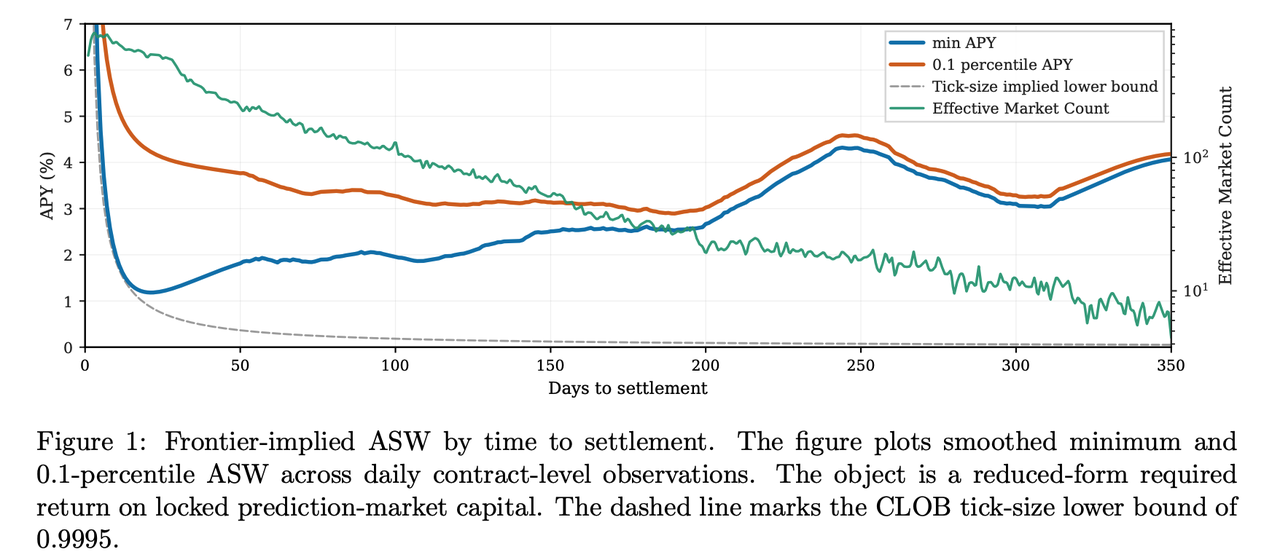
The settlement discount captures the value of delayed redemption, capital lock-up, outside opportunities, liquidity demand, and residual platform or oracle risk. The authors summarize this discount as an Annualized Settlement Wedge, or ASW, which is basically the implied required return for capital locked in near-certain prediction market claims.

In other words, prediction markets have a hidden yield curve. It is not printed on the homepage. It is implicit in the prices and appears when near-certain contracts refuse to trade at $1.

The paper finds that the ASW is positive, maturity-dependent, and time-varying.

Many long-dated high-probability contracts look like they underprice certainty, but a lot of that apparent mispricing is actually the price of locked capital. People love to call these trades "free money". But they are often not free money. They are yields, with risks.

On the other hand, a lot of near-settlement contracts offer attract yields on an annualized basis. These are great opportunities, but those gains are one-off only. You cannot earn the full annualized gains since they are not recurring profits.

The hidden yield curve of prediction-market certainty. The curves show the implied annualized return required to hold near-certain claims until settlement.

Why this changes how we read prediction markets

Prediction markets are financial markets, not magic probability dashboards. Some prediction market mispricing is informational. Some are behavioral. Some come from thin liquidity or retail demand. But near certainty reveals mostly funding friction.

This also helps explain why long-horizon markets are hard. Earlier research found that markets are reasonably well calibrated in short horizons but can become biased further from expiration. When the time value of money is considered, exploiting miscalibration depends on the trader having a low enough discount rate.

Another paper on interest-bearing positions makes a similar design point from another angle: long horizons can reduce liquidity and accuracy because committed capital has an opportunity cost, while paying interest can reduce the horizon effect and increase participation.

In other words, long-dated uncertainty is expensive because capital has alternatives. If a platform wants better long-term pricing, it cannot only attract smarter traders. It also has to make capital more productive.

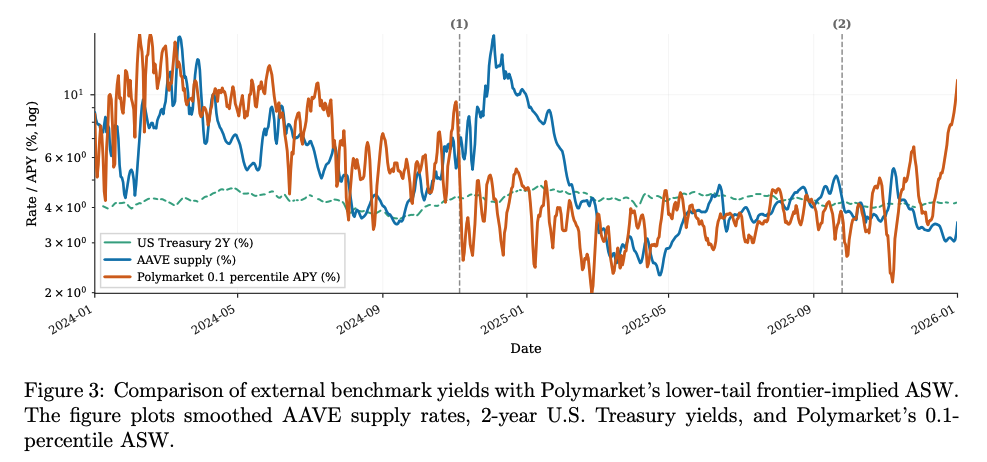
Prediction-market “bond yields” do not move like ordinary interest rates. Polymarket’s settlement wedge sometimes co-moves with crypto-native opportunity costs such as AAVE supply rates. Dash vertical lines mark (1) the November 5, 2024 U.S. election and (2) the introduction of Polymarket’s 4% yield program.

Why collateral matters

Event contracts are fully collateralized. Each complete YES/NO pair is backed by $1 of collateral locked in the system. In simple terms, when traders enter positions, capital is committed to the system and remains tied up until they exit or the market settles. That locked capital has an opportunity cost, especially in long-dated markets.

Therefore, long-dated near-certain contracts should trade at a discount. Someone has to be compensated for tying up money that can be useful elsewhere (e.g., earning interests in banks, committing to alternative investment opportunities).

But if platforms pay yield on collateral or open positions, that discount should shrink.

Kalshi introduced interest accrual on cash and open positions in March 2026, explaining that users can earn interest on the underlying collateral even before a market resolves. Its help page listed a 3.25% variable interest rate for eligible accounts.

Polymarket also introduced Holding Rewards for certain long-term markets, describing them as rewards on eligible positions designed to help maintain long-term pricing accuracy. Its help page listed a 3.25% annualized reward rate on total position value for eligible markets, with rewards sampled hourly and distributed daily.

That sounds like a small product feature. It is bigger than that. Once open positions can earn yield, event bonds stop being just an analogy. They start behaving even more like fixed-income instruments.

A 97-cent contract with no collateral yield is different from a 97-cent contract earning 3.25% while you wait. Same event, different bonds.

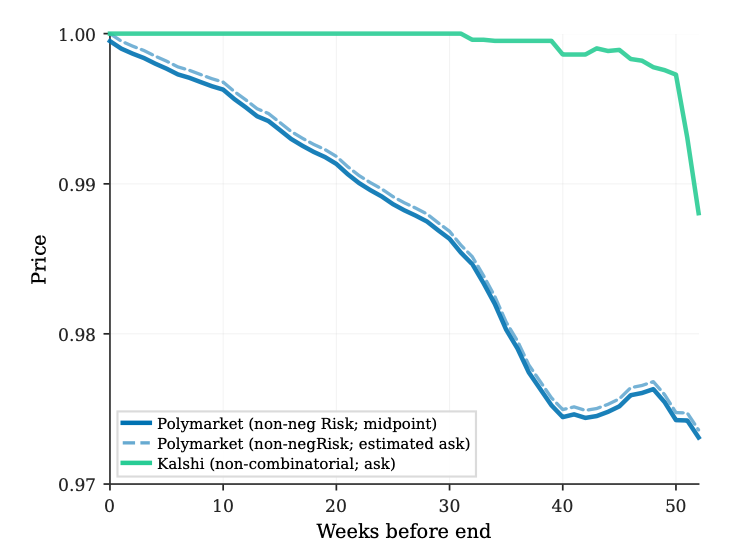
Same idea, different market design. Before Polymarket rolled out its holding rewards program, Kalshi’s near-certain contracts stay closer to par across maturities, consistent with the idea that yield-bearing collateral can reduce the cost of waiting.

NegRisk as collateral engineering

There is another design feature that matters: NegRisk markets and capital recycling.

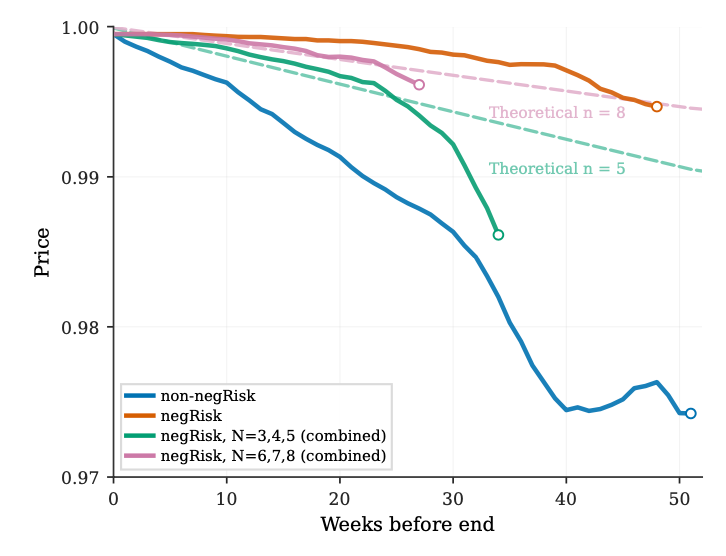
In certain mutually exclusive multi-outcome events on Polymatket, baskets of NO tokens can be converted into something closer to cash plus residual exposure. This compresses the settlement discount because part of the position can be recycled rather than staying fully locked until final settlement.

That may sound technical, but the intuition is simple. In fixed income, traders care about collateral, netting, and balance-sheet efficiency. In prediction markets, traders should care about the same things.

A market design that lets you recycle capital makes the claim more cash-like. A claim that is more cash-like should trade closer to $1.

NegRisk compresses the settlement discount by turning baskets of NO tokens into a cash-like component plus residual YES exposure. The effect is stronger when more outcomes are linked. Ordinary non-NegRisk markets lack this conversion mechanism, so near-certain claims trade further below par.

"Free money" is usually just yield

Prediction market starters often say things like, "This is basically guaranteed. Why is it only 98 cents?"

Other traders would ask a better question, "What is the yield, and what risk am I warehousing?"

Before buying a near-certain contract, ask:

  • What is the true probability of payout? Are there vague rules that can lead to disputes?
  • How many days until settlement?
  • What is the yield to settlement? Is collateral earning yield?
  • What is my next-best use of capital? What are the yields I can earn elsewhere?
  • Why am I being offered this yield?” Maybe the other side simply wants cash now/finds a better opportunity/is closing a winning position/knows something adverse that you are not aware of.

If you do not calculate the yield and risks, you are not trading near-certain contracts. You are just staring at cents, and you will lose big when things don't work out for you.

In addition, the most dangerous part of bonding is psychological. You win again and again, so it feels like the strategy works. But if you are buying 96-cent contracts, even a bad strategy can look good for a long time. The losses are rare, and rare losses do not give fast feedback. You may need hundreds of similar trades to know whether you actually have an edge. This is why a high win rate is not the same as positive expectancy. And Rare events teach slowly.

Would you try the "bonding" strategy in the future?

Yes, if the implied yield is attractive
0.00%
Maybe, but I would need better tools to calculate yield
100.00%
Probably not, the tail risks are too hard to judge
0.00%
No, I prefer trading uncertain events with higher upsides
0.00%
1 Polls

Disclaimer: The content is for informational purposes only. You should not construe any such information or other material as legal, tax, investment, financial, or other advice. Nothing contained in this article constitutes a solicitation, recommendation, endorsement, or offer by the author(s) or any third party service provider to buy or sell any securities or other financial instruments in your or in any other jurisdiction in which such solicitation or offer would be unlawful under the securities laws of such jurisdiction. The author(s) report(s) no conflict of interest.

Rules & Mandates - Insight of the Rebuild: Venezuela’s Economic Recovery vs. Global Capital Constraints
Analysis
RegulatoryGeopoliticsEconomicsCapital MarketsMacroeconomics

Rules & Mandates - Insight of the Rebuild: Venezuela’s Economic Recovery vs. Global Capital Constraints

Why people focus on a V-shaped Venezuelan oil recovery are mispricing global liquidity, crowding-out effects, and Big Tech’s capital monopoly.

Economics & FinancePolitics

Why people pay attention on a V-shaped Venezuelan oil recovery which covers global liquidity, crowding-out effects, and Big Tech’s capital monopoly.

1. The Diplomatic Mirage vs. Physical Reality

Traders on Kalshi and Polymarket are exhibiting a severe structural mispricing by wagering on a V-shaped rebound in Venezuelan crude output following the political transitions of early 2026. This consensus commits a fatal analytical error: substituting diplomatic headlines for macrofinancial and physical reality.

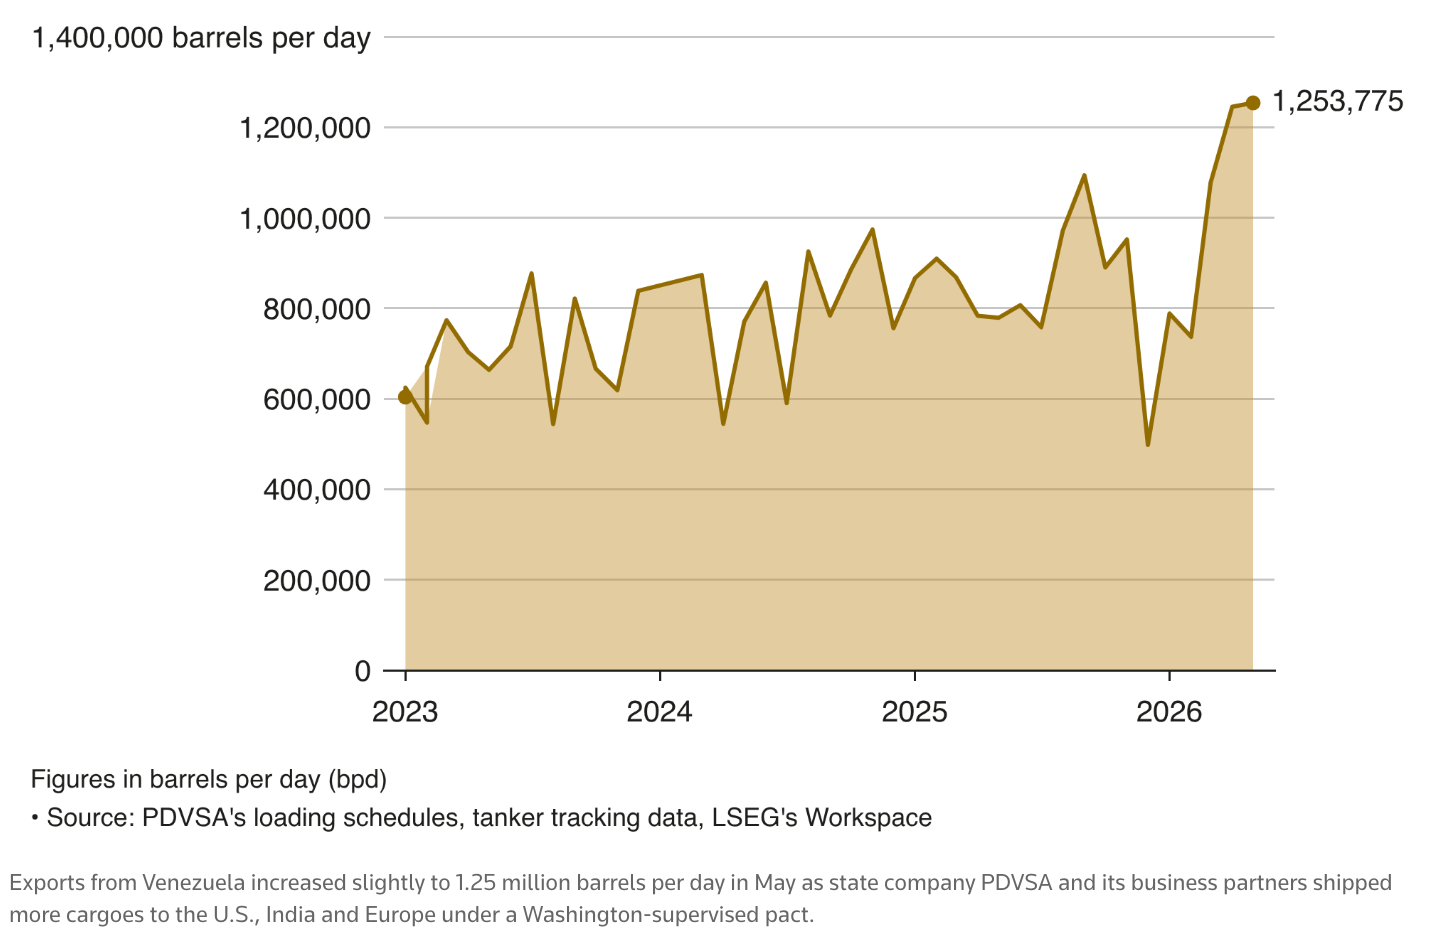
Maintaining output near 1.2 million barrels per day represents low-hanging fruit—the ceiling of marginal operational workovers by incumbent international oil companies (IOCs) like Chevron and Repsol. These operators are deploying zero greenfield CapEx; they are operating under strict debt-recovery waivers, reinvesting only localized cash flows without assuming balance-sheet risk.

Underneath headline volumes, the physical capital stock is severely depleted. As documented by Piergiuseppe Fiore in the Society of Petroleum Engineers (SPE, February 2026), rehabilitating corroded pipelines and extra-heavy crude upgrading facilities mandates an uncompromising 5-to-7-year technical overhaul. Furthermore, the sovereign is immobilized beneath a $150+ billion external debt wall, which halts international risk underwriting. Francisco Monaldi (Rice University’s Baker Institute, January 2026) confirms that breaching the 2-million-barrel-per-day threshold requires a sustained $100 billion CapEx program over a decade—roughly $10 billion annually. This requires heavy industrial engineering and project finance, not political sentiment.

Venezuelan oil exports source link

2. The Global Liquidity Drought and Sovereign Crowding-Out

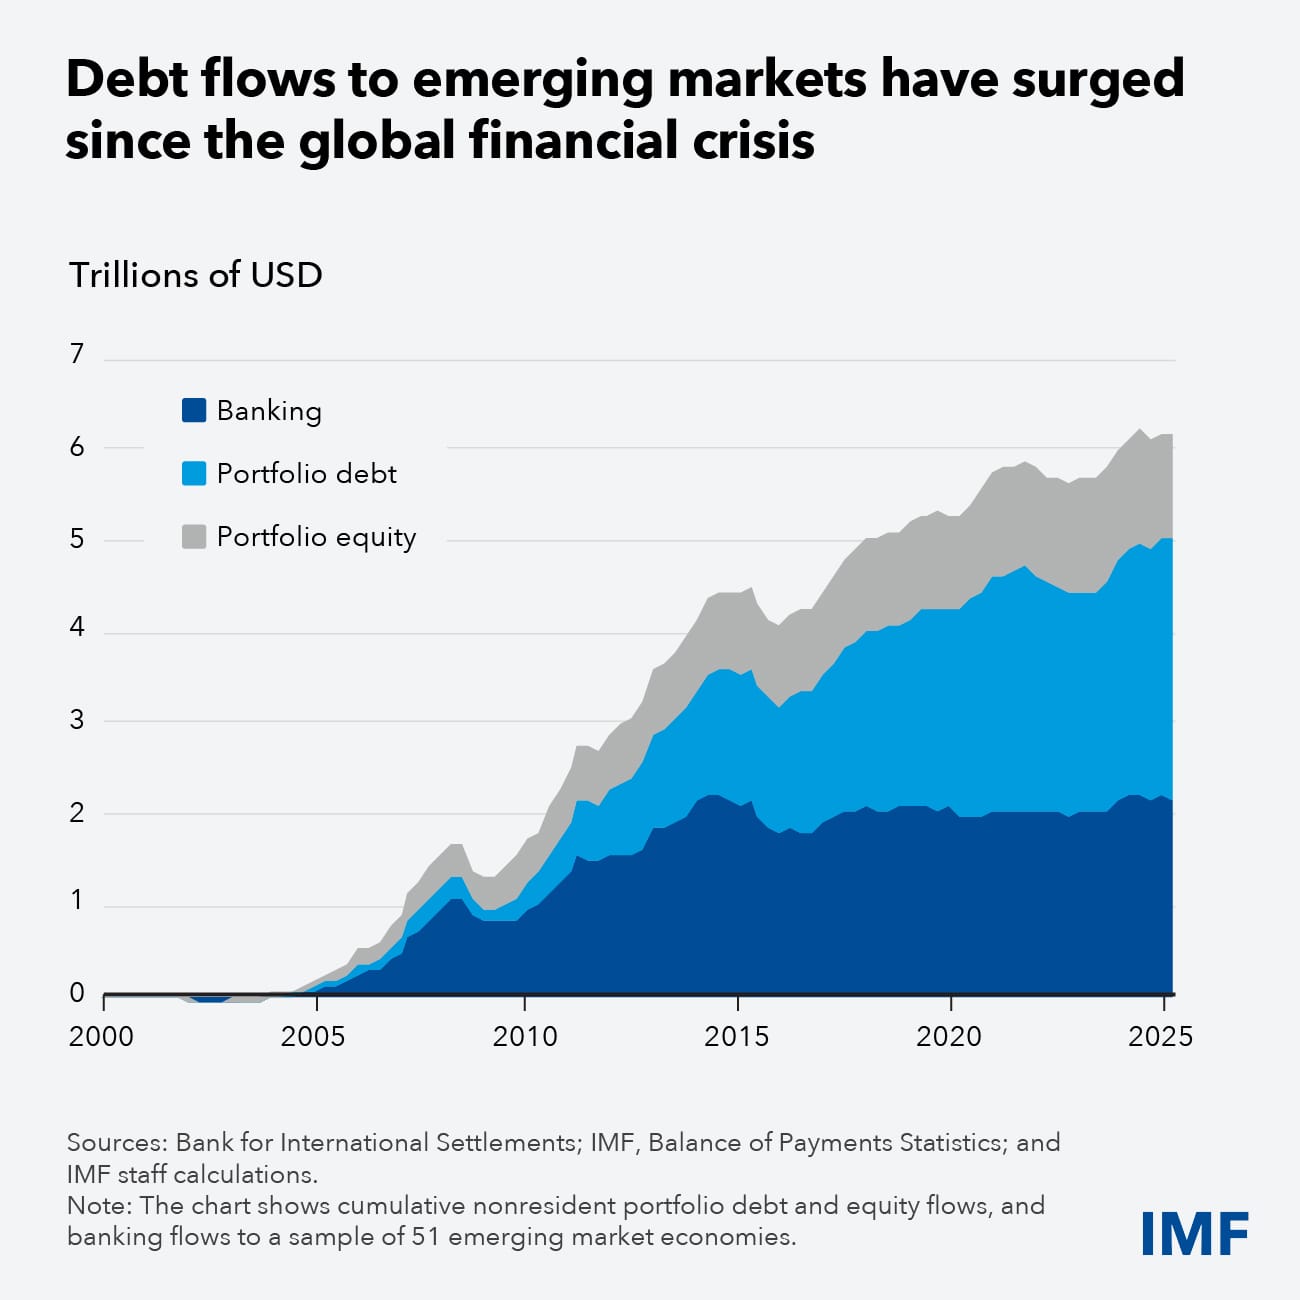
As of July 2026, emerging markets are facing an acute Global Liquidity Drought. Non-bank financial institutions (NBFIs), which hold over 80% of emerging market portfolio debt, are aggressively compressing risk. Confronted with elevated base rates and geopolitical shocks, institutional capital is executing sudden stops across high-yield developing jurisdictions. Simultaneously, Bank for International Settlements (BIS, 2026) locational data confirms that cross-border bank claims in U.S. dollars have stagnated, leaving Latin American sovereign lending paralyzed.

Shut out from international debt capital markets, vulnerable sovereigns are forced to tap domestic banking systems. This Crowding-Out dynamic absorbs local liquidity and denies essential commercial refinancing to industrial sub-contractors. Contrary to retail prediction market assumptions that PDVSA can self-fund via current oil sales, internal cash generation faces total free cash flow cannibalization. Gross export revenues are immediately siphoned off by legacy creditor arbitration claims, multilateral debt service, and basic operational survival, leaving zero net liquidity for capital deployment.

source link

Will Venezuela’s gross oil production return to pre-crisis levels (2M+ barrels/day) before 2028 end?

Yes
100.00%
No
0.00%
1 Polls

3. The Capital Monopoly: Big Tech AI vs. Emerging Market Debt

This emerging market refinancing crisis is exacerbated by an unprecedented structural drain: Artificial Intelligence. In its April 2026 Global Financial Stability Report (GFSR, Chapter 2 & Box 1.3), the International Monetary Fund (IMF) explicitly warns that hyperscaler compute infrastructure is monopolizing global debt capacity. The IMF projects AI data center buildouts will absorb $2.9 trillion in CapEx by 2028, siphoning over $800 billion from the private credit market.

By contrast, total private credit allocation across all emerging market infrastructure sits below $100 billion. For institutional asset managers (e.g., BlackRock, Brookfield), capital allocation is dictated by risk-adjusted arbitrage and collateral enforceability. Financing a North American GPU cluster secured by an investment-grade Big Tech balance sheet provides enforceable collateral and guaranteed yields, vastly outperforming the risk profile of an unhedged brownfield project in the Orinoco Belt. AI financial engineering is directly crowding out Latin American infrastructure reconstruction.

(also see our analysis on big tech company Capex & operation dilemma)

On the ground, the V-shaped recovery thesis collides with an immediate two-pronged bottleneck: geological math and legal deadlock.

The most definitive physical barometer is the Baker Hughes Rig Count. Through mid-2026, active drilling rigs in Venezuela have flatlined at 2.00 active units—a 98% collapse compared to the 80 to 100+ rigs deployed in the early 2010s. In mature reservoirs exhibiting a natural decline rate of 15% to 20% annually, operating two rigs guarantees an imminent net production contraction, not a recovery.

Furthermore, the International Energy Agency (IEA OMR, May 2026) highlights a critical diluent bottleneck. Orinoco extra-heavy crude (Merey 16) cannot flow through pipeline networks without being blended with imported naphtha or light condensates. Securing these diluent cargoes requires an immediate upfront cash-burn in hard currency—working capital that PDVSA cannot access.

Finally, the April 2026 legal deadlock surrounding CITGO Petroleum illustrates sovereign insolvency. Encumbered by $20 billion in enforceable creditor judgments and restrained by the U.S. Treasury’s Office of Foreign Assets Control (OFAC), PDVSA is stripped of its primary foreign refining subsidiary, eliminating any capacity to capture international downstream refining margins.

In a global market facing tight capital constraints, where will institutional infrastructure funds prioritize deployment?

Emerging Market Reconstruction (e.g., Venezuela)
0.00%
Developed Market AI Infrastructure (Big Tech)
0.00%
0 Polls

5. What Prediction Markets Are Missing: The Trader’s Checklist

For event contract traders positioning on Kalshi or Polymarket across 2026 and 2027 expiration cycles, capturing alpha requires ignoring political narratives and monitoring macrofinancial plumbing:

  1. J.P. Morgan EMBI (Venezuela Sub-Index): The primary feasibility filter. Until defaulted sovereign debt spreads compress to viable levels, international commercial banks will refuse to underwrite the credit facilities required for pipeline rehabilitation.
  2. IMF GFSR AI Private Credit Volumes: The global liquidity filter. Track Big Tech debt issuance and securitization absorption. The more private credit capacity AI compute consumes, the less liquidity remains available for high-yield Latin American risk.
  3. Baker Hughes Monthly Rig Count: The physical arbiter. If an event contract prices in a surge in gross barrel output over a 12-month horizon but active drilling rigs fail to scale exponentially, the market is structurally mispriced—signaling a high-conviction opportunity to short the contract (Bet NO).

References & Institutional Sources:

  • Baker Hughes. (2026). International Rig Count: Latin America – Venezuela. Baker Hughes Energy Data Hub.
  • Bank for International Settlements (BIS). (2026). International Banking Statistics and Global Liquidity Indicators. BIS Quarterly Review, International Financial Market Developments.
  • Blackmon, D. (2026, April 2). CITGO Sale Twists In The Wind As Treasury Department Stalls. Forbes, Energy & Public Policy Analysis.
  • Fiore, P. (2026, February). Venezuela Case History: Natural Resources, Operational Collapse, and Impact on Global Energy Business. Society of Petroleum Engineers (SPE) / Journal of Petroleum Technology (JPT).
  • International Energy Agency (IEA). (2026, May). Oil Market Report: World Oil Supply – Latin America and Venezuela. IEA Publications, Paris.
  • International Monetary Fund (IMF). (2026, April). Global Financial Stability Report: Global Financial Markets Confront the War in the Middle East and Amplification Risks. Chapter 2: "Capital Flows to Emerging Markets" & Box 1.3: "Required Financing and Securitization for Data Centers".
  • Monaldi, F. (2026, January 26). Without Institutional Change, Venezuela's Oil Bonanza Remains Unviable. Rice University’s Baker Institute for Public Policy / Americas Quarterly.
Breaking News - SK Hynix US Offering Is More Than Seven Times Oversubscribed
News Flash
IPOsSemiconductorBreaking NewsMemory ChipCapital MarketsAI InfrastructureSilicon Bakery Semi News

Breaking News - SK Hynix US Offering Is More Than Seven Times Oversubscribed

SK Hynix Inc.'s US listing is more than seven times oversubscribed, according to people familiar with the matter, as the South Korean memory chipmaker prepares to price its offering Thursday.

Economics & FinanceTech

SK Hynix Inc.’s US listing is more than seven times oversubscribed, according to people familiar with the matter, as the South Korean memory chipmaker prepares to price its offering Thursday.

The sale of 177.9 million American depositary receipts has attracted demand from institutional investors including global long-only funds, technology sector-focused funds, sovereign wealth funds and Asia-focused global investors, some of the people said.

Each SK Hynix ADR is equivalent to a 10th of a common share, according to an earlier filing with the US Securities and Exchange Commission. Based on Wednesday’s closing price in Seoul of 2.076 million won ($1,380) each, the US offering would raise about $24.5 billion.

Will SK Hynix's US ADR offering raise more than $25 billion?

Yes
66.67%
No
33.33%
3 Polls
Ended

At that size, the offering would rank among the largest ever debuts in the US by a foreign company, second only to Alibaba Group Holding Ltd.’s $25 billion debut.

The offering comes as the Korea-listed shares of SK Hynix as well as rivals such as US-listed Micron Technology Inc. have fallen sharply in recent days, as runaway enthusiasm for artificial intelligence infrastructure bets appeared to cool. SK Hynix shares declined 5.7% in Korea on Wednesday and are now down 30% from a record-high close in late June, though they remain roughly triple where they started the year.

Source: https://www.bloomberg.com/news/articles/2026-07-08/sk-hynix-us-offering-is-more-than-seven-times-oversubscribed?srnd=homepage-asia

Volts to Intelligence - The Compute Gold Rush: What Meta's Bet Reveals About the Future of AI Compute Demand
Analysis
HyperscalersLLMsAI InfrastructureMag 7AI PowerIndustry PulseVolts to IntelligenceData CenterCloud Computing

Volts to Intelligence - The Compute Gold Rush: What Meta's Bet Reveals About the Future of AI Compute Demand

Reading the trajectory of AI infrastructure demand through the industry's purest and riskiest case study - forming consensus of your own.

TechEconomics & Finance

Reading the trajectory of AI infrastructure demand through the industry's purest — and riskiest — case study.

1.The Purest Tech Case Study (Introduction to the Meta Proxy)

As the global financial system absorbs nearly $1 trillion in physical AI infrastructure, institutional skepticism is rising over the revenue gap. As Nicolai Tangen of Norway's sovereign wealth fund (NBIM) warned, a structural imbalance persists between the $1.4 trillion in projected global hardware expenditures and direct, verifiable AI revenues that struggle to cross $13 billion worldwide. In an era where markets demand proof of operational conversion and end-to-end viability, Meta emerges as the industry's most radical analytical proxy.

Unlike Microsoft’s Azure, Google’s GCP, or Amazon’s AWS, Meta operates as the purest unhedged bet in the generative AI landscape. The company possesses no external B2B cloud computing business to lease excess server capacity, monetize third-party compute, or subsidize its silicon infrastructure. Consequently, management's staggering CapEx guidance—officially projected between $125 billion and $145 billion for the fiscal year 2026 —must be justified entirely through internal monetization. Without a cloud safety net, every dollar spent on server farms and the pursuit of "superintelligence" represents an unhedged macroeconomic wager, completely reliant on translating brute compute power into ad-targeting efficiency and user engagement across Reels and Instagram.

2. The CapEx Wall and the Inference Tax

The paradigm of the modern internet economy is undergoing a structural mutation. For two decades, tech scaling relied on the zero marginal cost framework of traditional software. Generative AI shatters this foundation. Every prompt, synthetic recommendation, and AI-driven ad placement requires dedicated silicon cycles and immediate electron consumption. This reality imposes a permanent Inference Tax directly on Meta’s Cost of Revenue, structurally shifting it from an ethereal asset to a heavy-industry operating expense.

As Forrester Research highlights, this shift has created a "Pilot Graveyard," with 55% of global IT decision-makers admitting their legacy infrastructure cannot scale AI without severely eroding profit margins. For Meta, deploying generative models across its massive user base—particularly through its automated ad engine, Advantage+—means that higher engagement no longer yields pure profit. Instead, it triggers a linear surge in variable compute costs, threatening to permanently compress historically high gross margins under the weight of an unyielding CapEx wall.

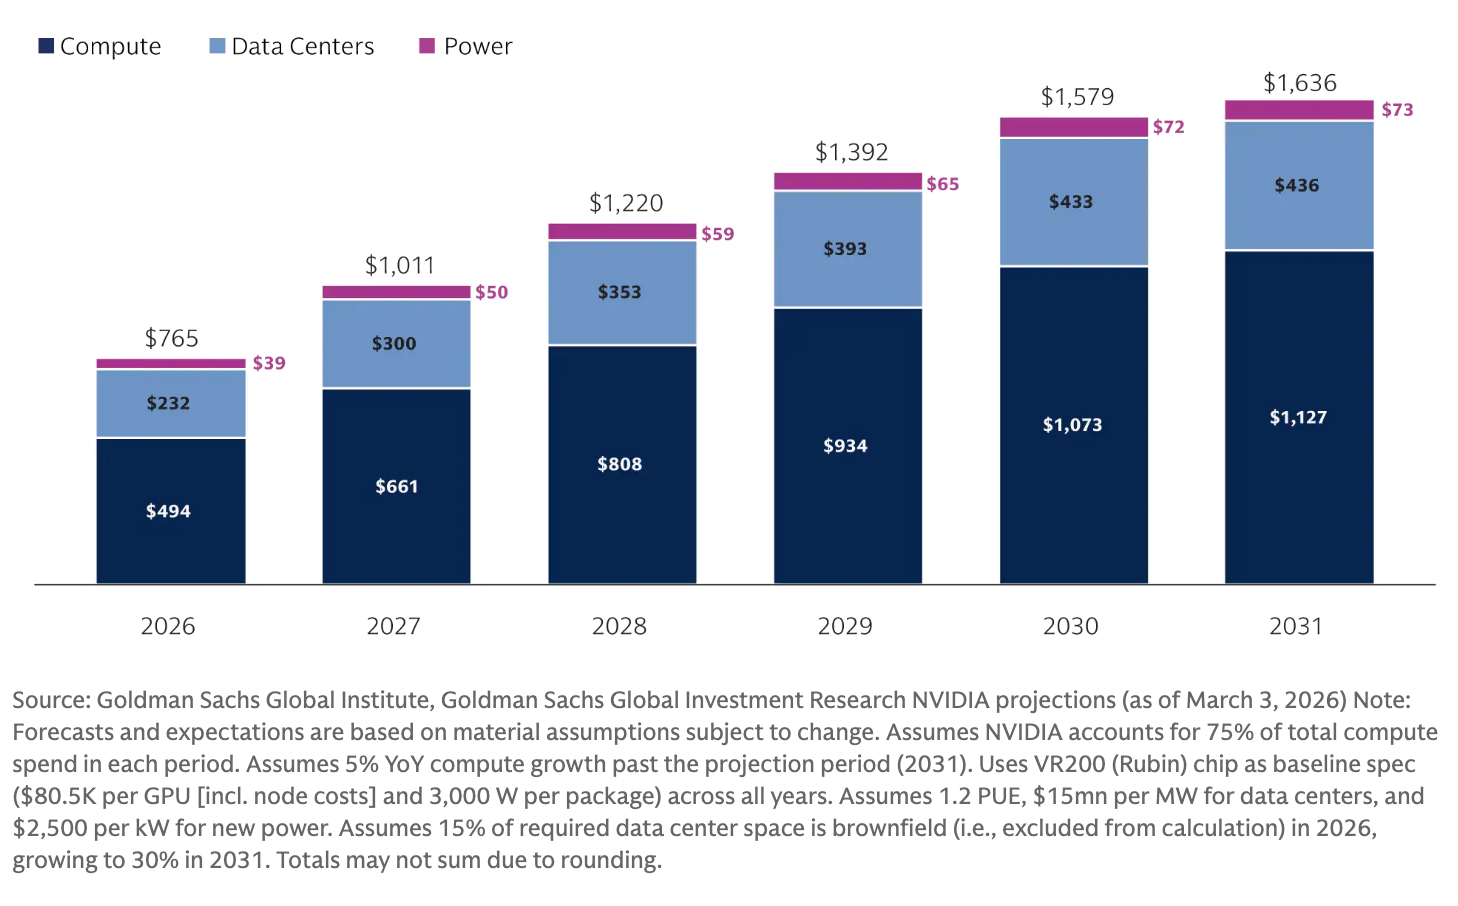
Baseline aggregate AI CapEx estimates (bn) ~$7.6tr of capital between 2026 and 2031 across compute, data centers, and power

Will Meta’s internal ad and engagement ROI justify its massive AI infrastructure CapEx over the next 24 months?

Yes — Internal monetization will absorb the Inference Tax
50.00%
No — The unhedged CapEx wall will crush operating margins
50.00%
2 Polls

3. The Accounting Depreciation Cycle: From Assets to Liabilities

The current valuation of hyperscalers suffers from a profound market mispricing regarding AI hardware infrastructure. While traditional industrial assets provided decades of predictable utility, modern AI clusters powered by Nvidia H100 or Blackwell architectures are bound to a brutal 3-to-4-year economic and technical useful life before complete obsolescence. This rapid decay creates an economic trap: tech giants are not building permanent capital moats, but are locked in a treadmill of perpetual reinvestment just to maintain baseline compute competitiveness.

To temporarily mask this structural erosion of margins, companies like Meta have resorted to an opportunistic accounting maneuver—a depreciation schedule extension for servers from four to five or six years. While this book-keeping extension artificially cushions reported operating income, it cannot alter the hard physical reality of hardware decay. The unavoidable necessity of replacing obsolete chips every 36 to 48 months directly eviscerates Free Cash Flow (FCF), converting what Wall Street treats as long-term capital assets into recurring operational liabilities.

4. Hitting the "Watt Wall" (The Energy Limit)

The true technical ceiling for AI is not financial, but thermodynamic: The Watt Wall. While hyperscalers possess virtually infinite capital, they are colliding with a hard physical glass ceiling: power grid saturation. According to the IEA, data centers now absorb 22% of Ireland’s total electricity—forcing grid connection freezes in Dublin—and will devour 50% of US electricity demand growth by 2030. This structural deficit forces an intense Physical Crowding Out, where compute clusters displace heavy industry and residential grid electrification. To bypass these transmission bottlenecks, operators like Meta are desperately pivoting to dedicated baseload power, signing PPAs for 1.1 GW of existing nuclear and 150 MW of next-gen geothermal energy. Ultimately, money cannot print megawatts; without grid infrastructure, AI growth stops.

What will be the primary bottleneck throttling the hyperscalers' AI infrastructure boom?

Rapid GPU Depreciation (The 3-4 year replacement cycle)
0.00%
Power Grid Saturation (Hitting the 'Watt Wall')
0.00%
Shareholder Pressure on Free Cash Flow (The valuation doghouse)
100.00%
1 Polls

Comprehensive Analytical Bibliography:

  • Bank for International Settlements (BIS). (2025). BIS Quarterly Review: International banking and financial market developments. Basel: BIS, December 2025.
  • International Energy Agency (IEA). (2026). Electricity 2026 Report: Global Infrastructure & Thermodynamic Trends. Paris: IEA.
  • Norges Bank Investment Management (NBIM). (2026). Capital Allocation Doctrines and Institutional Mandates 2025/2026. Oslo: NBIM.
  • Organisation for Economic Co-operation and Development (OECD). (2026). Compendium of Productivity Indicators. Paris: OECD, January 2026.
  • Andreessen Horowitz (a16z). (2025). Where Value Will Accrue in AI: Structural Realities of Algorithmic Gross Margins. Research Briefing by Martin Casado and Sarah Wang.
  • Bessemer Venture Partners & Meritech Capital. (2026). State of the Cloud 2026 & Meritech Software Pulse Index. New York/San Francisco: Open Access Multiples Matrix.
  • Forrester Research. (2026). Predictions 2026: Artificial Intelligence and Corporate Infrastructure Stress. Cambridge: Forrester.
  • Goldman Sachs Global Investment Research. (2024). Gen AI: Too much spend, too little benefit? Global Macro-Equity Strategy Briefing managed by Jim Covello.
  • Goldman Sachs Global Investment Research. (2026). Tracking Trillions: The Assumptions Shaping the Scale of the AI Build-Out, by George Lee & Lucas Greenbaum.
  • Morgan Stanley. (2026). US Software Outlook & Big Tech CapEx Projections. New York: Equity Research Division.
  • Brynjolfsson, Erik, Daniel Rock, and Chad Syverson. (2019). The Productivity J-Curve: How Intangibles Complement General Purpose Technologies. Cambridge: National Bureau of Economic Research, Working Paper No. 25148.
  • Chen, Xupeng. (2026). Abundant Intelligence and Deficient Demand: A Macro-Financial Stress Test of Rapid AI Adoption. Academic Working Paper, March 2026.
  • Also includes Ccrporate filling files and briefing or media materials.
Macro & Micro Compass - Federal Reserve Fed officials were split on direction of interest rates at last meeting, minutes show
News
Central BanksEconomicsInflationInterest RateMacro & Micro Compass

Macro & Micro Compass - Federal Reserve Fed officials were split on direction of interest rates at last meeting, minutes show

Fed policymakers were split on the future of interest rates at their June meeting, with officials offering competing cases for hikes or cuts, according to minutes released Wednesday.

Economics & FinancePolitics

Federal Reserve officials were split last month about the future of interest rates, with policymakers entertaining scenarios in either direction, according to meeting minutes released Wednesday.

In Kevin Warsh's first meeting June 16-17 as chairman of the Federal Open Market Committee, participants saw outcomes where inflation could ease and allow lower rates, while others envisioned a scenario where price increases stay elevated and lead to hikes.

During his post-meeting news conference, Warsh billed the debate as a “family fight” that ended with the committee unanimously voting to keep the Fed’s benchmark funds rate anchored in a range between 3.5%-3.75%, where it has been for all of 2026.

Many participants indicated that the appropriate level of the federal funds rate would be within or slightly below the current target range at the end of this year. Many other participants, however, assessed that the appropriate level of the federal funds rate would be above the current target range at the end of this year.

Participants noted that their future policy actions would depend on incoming information.

Will the Fed keep the federal funds target range at 3.50%-3.75% through the end of 2026?

Yes
39.16%
No
60.84%
309 Polls

Inflation has been on the rise for much of the past year, fueled earlier by President Donald Trump’s tariffs then exacerbated by the Iran war. Economists, though, have been split as to its durability, particularly since energy prices have plunged in recent weeks.

FOMC officials expressed “that inflation would remain elevated in the near term and then begin to decline as the effects of tariffs and energy price increases wane and other supply disruptions related to the closure of the Strait of Hormuz diminish. Participants judged that the risks to the inflation outlook were still tilted to the upside.”

Participants also noted the impact of artificial intelligence, observing that the “ongoing strong demand for AI infrastructure would likely sustain upward pressure on prices for technology products and electricity.” 

The minutes also highlighted a shift in the Fed's communication strategy. “A number of participants noted that it was an opportune time to consider significant changes to the FOMC’s postmeeting statement,” the minutes said. “A majority of participants remarked that they saw advantages in shortening the statement.“

Source: https://www.cnbc.com/2026/07/08/fed-minutes-june-2026-.html

https://www.reuters.com/business/fed-minutes-due-analysts-debate-whether-warsh-will-curtail-them-2026-07-08/?utm_source=chatgpt.com

Global Chokepoint - US Strikes Iran and Blocks Oil Sales in New Test of Truce
Quick Take
Oil & GasEnergyGeopoliticsGlobal ChokepointCommodity

Global Chokepoint - US Strikes Iran and Blocks Oil Sales in New Test of Truce

US President Donald Trump said his tentative ceasefire with Iran is done, raising the prospect of a renewed military conflict between the two countries, bringing fresh volatility to energy markets and tested an already fragile peace agreement between Washington and Tehran.

Economics & FinancePolitics

US President Donald Trump said his tentative ceasefire with Iran is done, raising the prospect of a renewed military conflict between the two countries.

Ceasefire Collapses, Middle East Tensions Escalate

The US carried out a new round of strikes in Iran targeting more than 80 sites and revoked a waiver allowing new sales of its oil, further imperiling a peace agreement after a series of attacks on ships in the Strait of Hormuz.

Both sides accused the other of violating the ceasefire. Three commercial ships were attacked in the Strait of Hormuz over the last day, the most since the agreement went into effect, with the US blaming Iran for the strikes.

Source: Iranian Army

The actions, taken in response to recent attacks, brought fresh volatility to energy markets and tested an already fragile peace agreement between Washington and Tehran.

Oil Surges on Supply Risks & Ripple Effects Across Markets

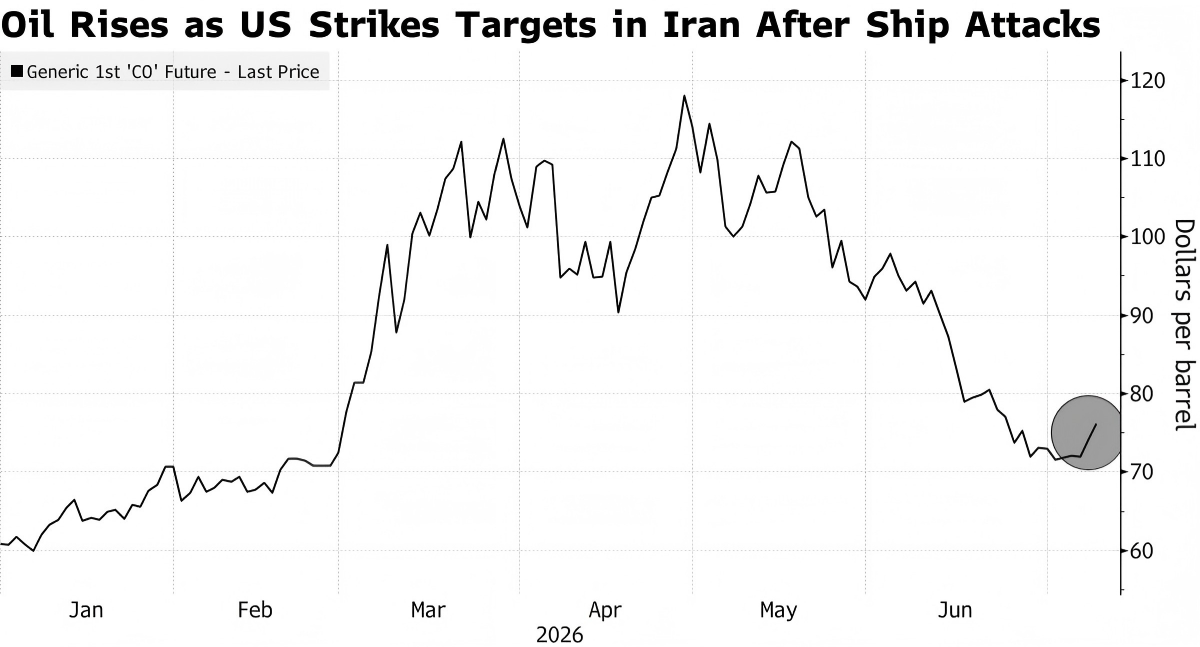
Brent hit the highest level in two weeks, advancing 5.3% to around $78 a barrel.  The rebound, after futures had plunged in the second quarter as regional tensions cooled, could rekindle inflationary concerns in global markets and among policymakers.

Source: Bloomberg

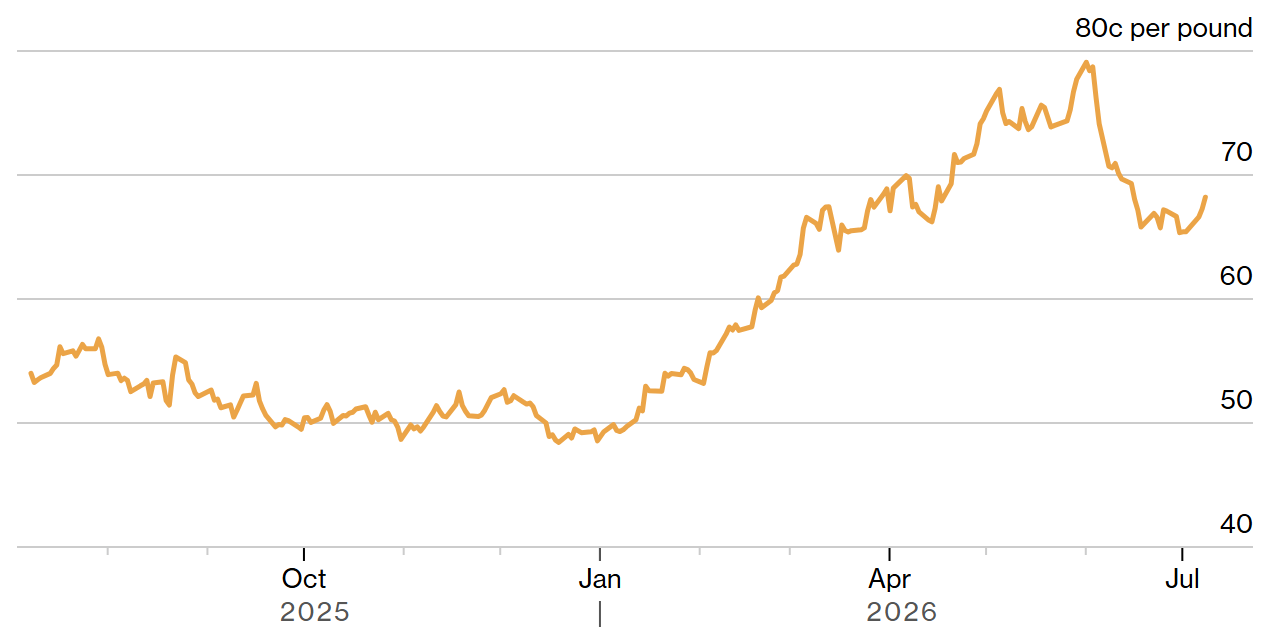
Chicago soybean oil futures climbed to a three-week high after fresh US military strikes on Iran sent crude oil prices higher. As a major biofuel feedstock, soybean oil prices are often tied to movements in crude. When crude oil prices rise, alternatives such as biofuels become more attractive to buyers.

Source: CME Group

Stocks fell after President Donald Trump declared the ceasefire. S&P 500 futures fell 0.8% following the previous session’s selloff in chip stocks. The Stoxx 600 fell 1.5% as crude prices pushed bond yields higher. Treasuries ticked lower and the dollar wavered.

Iranian Oil Sales Face Pressure

Tens of millions of barrels of Iranian oil already on tankers have been left in limbo after the US walked back a waiver allowing the Islamic Republic to sell the crude.

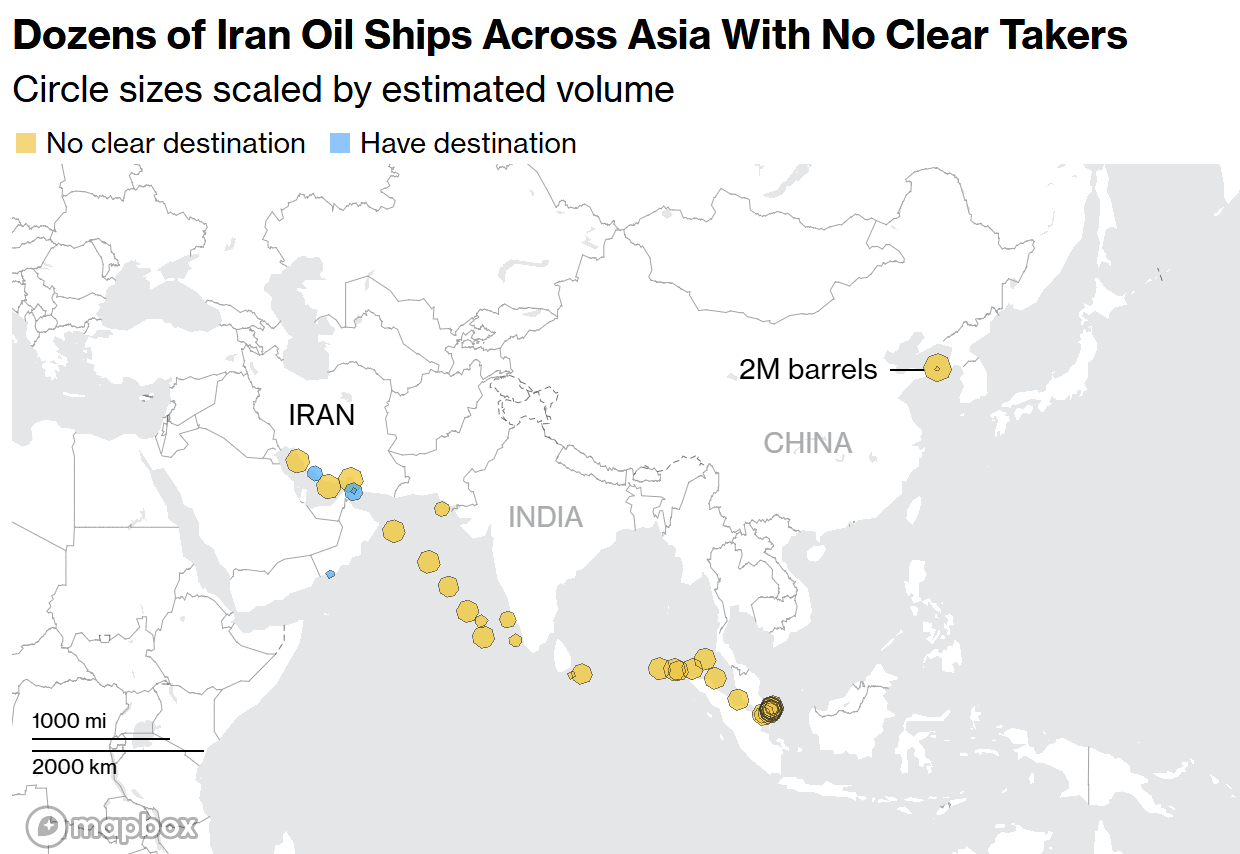
There are around 63 million barrels of Iranian oil currently on the water, either in transit or idling, according to Bloomberg calculations based on Vortexa data. The crude is on vessels in the Persian Gulf and spread across Asian waters. Most of these ships are not indicating a clear destination or are signaling that they’re available for orders, meaning they haven’t found a buyer.

Source: Bloomberg

Even before the waiver was revoked, Tehran was struggling to sell its oil. That was partly due to a deluge of non-Iranian crude coming out of the Persian Gulf, meaning the barrels were no longer trading at a discount to alternatives, and also because buyers were wary of various risks still involved in the trade.

The trade faced a number of obstacles. European Union and UK restrictions remained in place, complicating insurance, and some ports may not have been willing to allow Iran’s dark-fleet ships to dock. Buyers were also wary of sudden changes in US policy.

There weren’t any recorded purchases of Iranian crude by Asian refiners outside of China since the waiver was issued, the traders said, although some sales may be kept under wraps due to their sensitivity.

One of the few remaining markets for the oil is China’s independent refiners, known as teapots, who were Iran’s main customers prior to the Middle East war. However, it’s likely Tehran would need to offer steep discounts to pique their interest.

Source: https://www.bloomberg.com/news/articles/2026-07-07/us-revokes-waiver-allowing-iran-oil-sales-after-tanker-attacks?srnd=homepage-asia;

https://www.bloomberg.com/news/articles/2026-07-08/iranian-oil-at-sea-left-in-limbo-after-us-revokes-60-day-waiver;

https://www.bloomberg.com/news/articles/2026-07-08/trump-says-us-ceasefire-with-iran-is-over-after-strikes?srnd=homepage-asia