The Kansas City Fed's Jackson Hole symposium has a habit of turning dry policy papers into market-moving events. This year, it might not even need Warsh's help to do it.
The theme is "Financial Innovation: Implications for Payments and Policy." Quite a mouthful for a 49-year-old gathering that runs August 27 to 29 at Jackson Lake Lodge.
At first look, the conference will cover all sorts of plumbing, including instant payments, tokenized deposits, stablecoins, who settles what and how fast.
But this is Kevin Warsh's first Jackson Hole as Fed Chair, and his Friday keynote lands 19 days before a September 16 FOMC decision markets can’t call with any confidence.
There is quite a big question: what happens when digital tokens begin to compete with bank deposits, settlement systems and central-bank money?
Let's follow the dollar.
Do stablecoins matter outside crypto yet?
Not reallyResult
0.00%
They are beginning toResult
0.00%
Yes, they already affect traditional marketsResult
0.00%
I’m not sureResult
0.00%
0 Polls
EndedTBD
Stablecoins are crawling into the funding stack, and it’s bigger than just crypto
Stablecoins are the obvious front-end trade.
Stablecoin.com shows the stablecoin sector sits at $289.5 billion as of August 25, with USDT alone accounting for $183.2 billion, or 63.3% of the market. Together with USDC's $73.6 billion, these two issuers control 88.7% of the market, while the GENIUS Act shoved US payment stablecoins straight into a formal regulatory wrapper.
The first market question is simple: what happens if that number gets another zero?
At ten times the size, the money has to come from somewhere. Some of it will come out of bank deposits, leaving banks to replace cheap retail funding while issuers pile into Treasury bills, repo or bank claims.
Track the tape for discussion of deposit competition, bank funding costs, liquidity rules and redemption rights.
The T-Bill sink: The next macro trade?
Money leaving deposits does not disappear. Stablecoin issuers need somewhere to park reserves, and short-dated government paper is the natural home.
They are already measurable participants in the bill market. The BIS estimates that their combined assets exceeded $270 billion by December 2025 and that they bought nearly $35 billion of Treasury bills during 2025, a flow comparable with purchases by the largest U.S. government money-market funds. Its research finds that a $3.5 billion stablecoin inflow lowered three-month T-bill yields by 0.71 basis points immediately and by around four basis points within ten days, with larger effects when Treasury-market intermediation was strained.
The marginal flow, not the stock, could be the next trade. A burst of Treasury issuance could absorb new demand without much fuss, but if stablecoin buying picks up when the bill market is already strained, it is different, and the effect on yields can become more pronounced.
So stablecoins can pull cheap funding out of banks and recycle it into the front end. The size of the move depends on what Treasury supplies, how quickly issuers buy and how much capacity dealers have to stand in the middle.
But the mechanism can reverse during stress: large redemptions could force issuers to sell reserve assets quickly, transmitting volatility into money markets just when the liquidity is already thin.
Keep an eye on Jackson Hole language around reserve composition, redemption risk and who, if anyone, provides the backstop when the selling starts.
Tokenization turns settlement into a policy question
Tokenization promises to put cash, deposits, securities and collateral onto programmable networks where trade and settlement can happen almost simultaneously.
This seems operational, but it is deeply monetary: if tokenized markets scale, what asset sits at the center of settlement?
Project Agorá has demonstrated atomic cross-border settlement using tokenized deposits and central-bank reserves. Europe is moving further: the ECB's Pontes system is due to begin settling DLT-based transactions in central-bank money in September, with Appia aimed at a wider tokenized ecosystem.
Atomic settlement cuts the risk that one side of a trade goes through while the other does not. But if every trade settles immediately, firms have less room to net positions before cash changes hands. Faster settlement can be safer while also demanding more cash and collateral during the day.
The signal to watch is who policymakers think should own the settlement layer. Europe has explicitly placed central-bank money at the center of wholesale tokenized settlement. The US has so far concentrated more heavily on regulating privately issued payment stablecoins, but that does not yet amount to a settled choice over the architecture of wholesale tokenized markets.
Watch whether policymakers articulate a stronger view on which model they want to encourage, and how they plan to manage the trade-off between faster settlement and greater liquidity needs.
Warsh's speech is doing two jobs at once
Officially, Warsh speaks on payments and financial innovation on Friday, August 28, at 10 a.m. ET. Unofficially, every word gets parsed for rate guidance, because the backdrop he's speaking into is a mess.
As our analysis of the July minutes showed, the three formal dissents understated the committee’s broader conditional hawkishness. Warsh’s keynote is the first major opportunity to clarify what would convert those conditional hawks into votes for a September increase.
The latest data pull in opposite directions. Consumer prices rose 3.4% in the 12 months to July, while payrolls fell by 23,000 against a forecast of +85,000, the third-largest monthly drop since the pandemic and unemployment held at 4.1%. Inflation remains elevated, but the jobs market has lost momentum.
He was regarded as an inflation hawk during his earlier Fed tenure, but has more recently argued that AI-driven productivity could reduce inflationary pressure and leave room for lower rates. Jackson Hole may therefore provide the clearest evidence yet of how he weighs persistent inflation against weakening employment.
Deposit competition can change how banks respond to policy rates. Stablecoin reserves can feed into bill yields. Tokenized settlement can change how much liquidity markets need and where they get it.
Warsh's speech is therefore doing two jobs at once: signaling where rates may go next and setting out how the dollar's changing infrastructure could transmit those rates through the financial system.
What to watch next
Markets will still parse Fed Chair Kevin Warsh's Friday keynote for the usual rate signal. But the more durable tell may come from how policymakers define the boundary between innovation and money.
Three questions matter:
1. Do stablecoins become large enough to alter bank funding?
2. Do issuer reserve flows become large enough to move T-bill yields in normal markets or amplify stress when redemptions hit?
3. And what asset anchors tokenized settlement and does faster settlement change liquidity needs and the transmission of policy rates?
If Jackson Hole starts answering those questions, this year's symposium will be about far more than faster payments. It will be about who controls the financial system’s next operating layer and which assets become the new plumbing of global liquidity.
Which Jackson Hole signals will matter most to markets?
In August, a previously little-known polling firm called Median Strategies released a poll of the Los Angeles mayoral election. The result looked fairly clear: incumbent Mayor Karen Bass led challenger Nithya Raman by nearly 12 percentage points. Median claimed to have surveyed 560 voters and provided a methodology description that looked like something a legitimate polling organization would publish.
Bass's campaign quickly seized on the good news, saying on social media that it showed the campaign was "gaining momentum".
A few days later, people learned there was a problem: those 560 voters did not exist. The poll was fake.
Median Strategies subsequently withdrew all of its polls, saying that it had actually been a "short-term social experiment" designed to observe how easily unverified polling information could enter the political information ecosystem. On August 20, The Guardian went further and identified the person behind the website: Rahil Prakash, a 21-year-old recent college graduate. He said he had carried out the entire project by himself and had also used AI to build the website.
Median did not just fabricate a Los Angeles poll. It also published fake polls in Wisconsin and Nevada. One of them even claimed that Francesca Hong was leading the Wisconsin Democratic gubernatorial primary by more than 20 percentage points. Prediction market prices changed dramatically at the final moment and Hong ultimately lost the race by less than 1 percentage point.
But one important detail is that these fake polls did not automatically produce noticeable moves in prediction markets. The Associated Press tracked trading on Kalshi and Polymarket. After the fake Wisconsin and Nevada data were published, neither platform showed an identifiable market reaction.
Los Angeles was different. After Bass's campaign reposted Median's result, the YES contract on Kalshi for Bass to win the mayoral election rose from about 63 cents to 65 cents, a 2-cent increase in roughly 15 minutes. The reaction on Polymarket was more concentrated. AP found that about six minutes after the relevant post went out, roughly 20 different accounts began trading thousands of contracts favorable to Bass. By contrast, during the week before Bass shared the poll, the market had been extremely quiet, with a typical individual trade worth less than $10.
A previously thinly traded market suddenly saw a cluster of orders all pointing in the same direction after information that was later proven entirely false was amplified by the candidate herself.
The Market May Not Have Believed the Poll. It Believed Bass.
Median had almost no track record of credibility at the time. Its social media accounts had only recently been created, it had just a few dozen followers, and it did not publicly identify a lead pollster whose identity could be verified. The Guardian later found that Prakash himself also had no background at a traditional polling organization.
So if Median Strategies had simply published a "Bass +12" poll on its own, traders could have ignored it entirely. In fact, the Wisconsin and Nevada results suggest that this is largely what they did.
Professional data gatekeepers spotted problems as well. AP reported that The New York Times, RealClearPolitics, and FiftyPlusOne all declined to include Median's polls in their databases. The New York Times said it had not received basic information about the survey methodology or the people running the firm, while FiftyPlusOne found that the Wisconsin poll did not disclose the source of its voter file or the vendor responsible for collecting the sample.
So this is not a story about "nobody being able to identify a fake poll". What is more interesting is that when the Karen Bass campaign later reposted it, the information acquired a second layer of credibility. Traders saw an additional signal: Bass's campaign considered the poll credible enough to promote publicly.
The Advantage of Prediction Markets Also Creates a New Attack Surface
One of the most important theoretical advantages of prediction markets is that monetary incentives can rapidly aggregate dispersed information into prices. If a trader believes the public information is wrong, that trader can bet in the opposite direction. If the trader is right, the trader can make money. This is also why prediction markets are often described as a corrective mechanism for polling, analysts, and media narratives. But there is a mirror-image problem: if the market is willing to pay for new information, then creating new information may itself have economic value.
As early as 2020, legal scholar Tyler Yeargain published a paper that reads almost like a prediction of Median Strategies. The paper examined exactly the scenario in which someone fabricates political polls, moves betting-market prices, and then profits from trading, and argued that under certain factual circumstances, such conduct could constitute commodities fraud or wire fraud.
The CFTC had also described almost exactly the same risk in advance. In its 2024 proposed rule on event contracts, the CFTC specifically noted that inaccurate polling, voter surveys, and false news reporting could distort the price formation of political event contracts. It went on to raise a problem that is distinctive to prediction markets: traditional financial derivatives usually have an underlying cash market and other economic data that can provide a pricing anchor, but political event contracts have no equivalent underlying cash market. Their price formation depends heavily on polling and other informational sources. Those sources are often unregulated, operate through opaque processes, and may not even use reliable statistical methods.
In the stock market, if someone publishes a false rumor about a company, investors can at least check earnings, SEC filings, cash flow, and other asset prices. But "Will Bass win the November mayoral election?" has no corresponding balance sheet. Polls, endorsements, campaign news, fundraising, social media narratives, and insider information are themselves the "fundamentals" of the contract.
The "Social Experiment" Is Not the Most Important Issue
Prakash told The Guardian that he did not trade on prediction markets. Median had also stated that people involved in the project did not hold prediction-market positions related to the elections in question and did not receive any financial benefit. So far, there is no public evidence that he fabricated the polls in order to profit from Kalshi or Polymarket.
But a 21-year-old acting alone, without a large team, mature polling infrastructure, or an obvious financial motive, was still able to use nothing more than a website, some professional-looking methodological descriptions, and social-media distribution to push fabricated data into real political coverage, have it amplified by a candidate, and ultimately see it coincide with real financial trading. Markets can aggregate information very efficiently, but the aggregation mechanism itself does not verify whether that information is true or false. Traditional market surveillance is best at detecting abnormal behavior that occurs inside the market. The risk demonstrated by Median Strategies, however, may originate outside the market.
Disclaimer: The content is for informational purposes only. You should not construe any such information or other material as legal, tax, investment, financial, or other advice. Nothing contained in this article constitutes a solicitation, recommendation, endorsement, or offer by the author(s) or any third party service provider to buy or sell any securities or other financial instruments in your or in any other jurisdiction in which such solicitation or offer would be unlawful under the securities laws of such jurisdiction. The author(s) report(s) no conflict of interest.
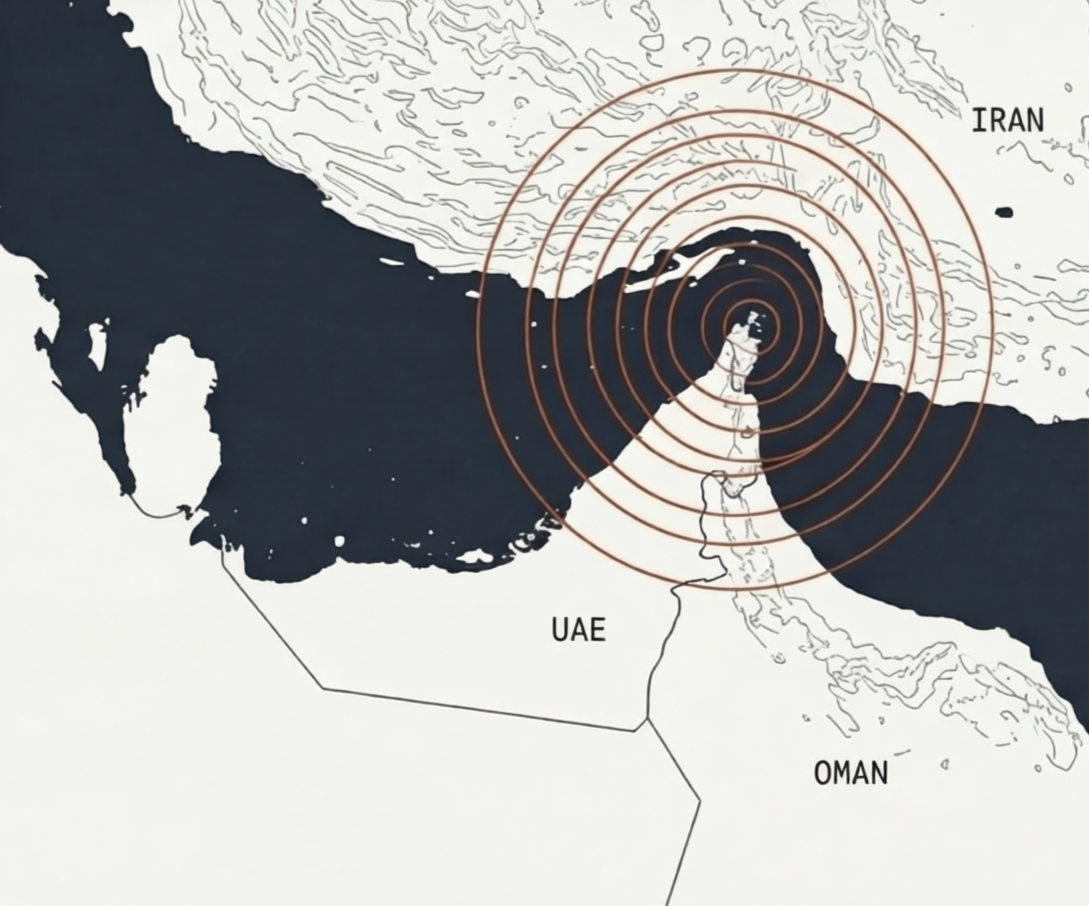
TotalEnergies says Hormuz crude shipments remain profitable despite war-risk costs adding roughly $20mn per VLCC voyage, because Iraqi and Qatari barrels are being sold at steep discounts.
Iran has threatened 45 tankers with fines, detention and cargo confiscation, while also warning that vessels conducting STS transfers with blacklisted ships could face penalties.
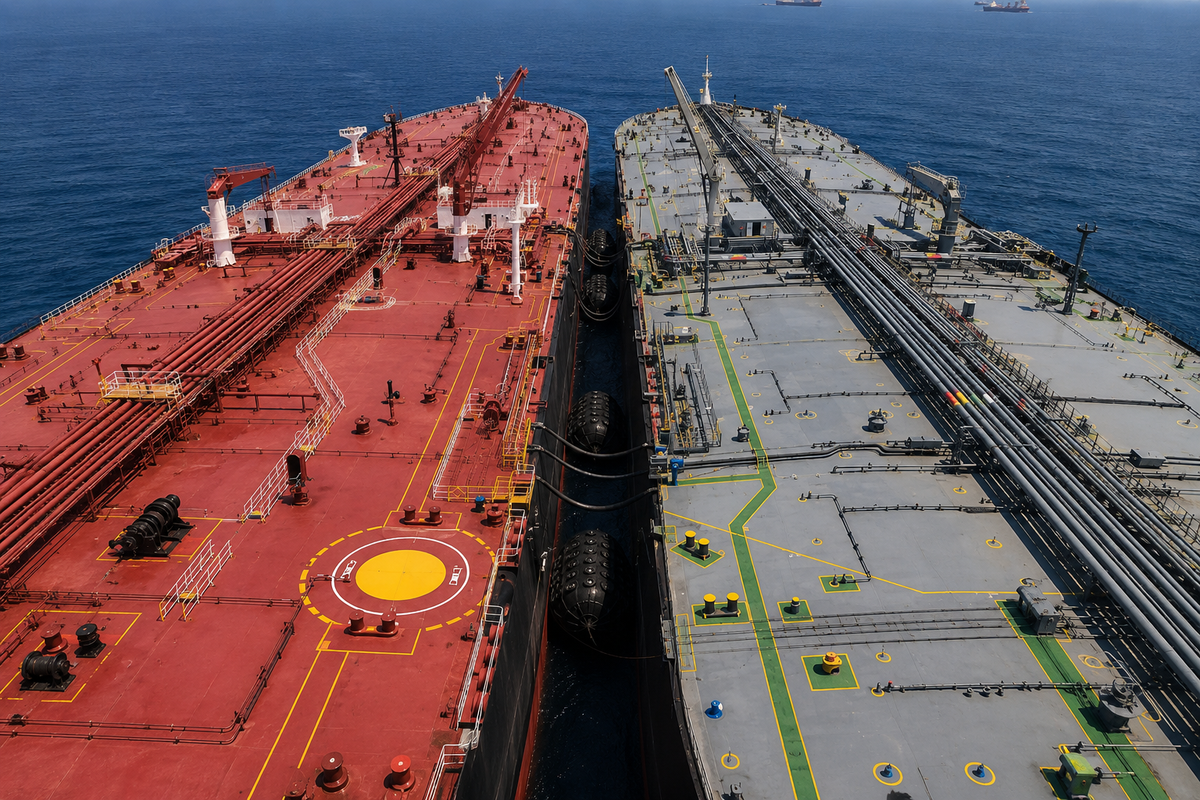
VLCC rates have surged to record levels as crude increasingly moves through STS transfers, pipelines and longer detours, with benchmark TD3C earnings reaching about $624,000/day.
Will Iran add more tankers to its Hormuz blacklist by the end of October 2026?
YesResult
0.00%
NoResult
0.00%
0 Polls
EndedTBD
TotalEnergies Is Still Making Hormuz Work
TotalEnergies Chief Executive Patrick Pouyanné said the company is continuing to move heavily discounted crude from Iraq and Qatar through the Strait of Hormuz because the trade remains profitable despite sharply higher transport costs.
Iraqi Crude Discounts Widened Sharply in August
SOMO crude discounts by loading window
Loading window
Basrah Medium
Basrah Heavy
July loading
−$14/bbl
−$18.8/bbl
Aug 1–10
−$27/bbl
−$29.8/bbl
Aug 11–20
−$26/bbl
~−$28–29/bbl
Aug 21–31
−$25/bbl
−$27.8/bbl
Discounts widened sharply in August as higher Hormuz-related freight,
insurance and security costs increased the cost of lifting crude from inside the Gulf.
Source: Argus Media; SOMO
Crude oil are being offered at around $50–60 per barrel, compared with Brent above $90. Pouyanné estimated that moving a VLCC through Hormuz and back now adds roughly $20mn, about $10 per barrel for a 2mn-barrel cargo, largely reflecting war-related risks.
As long as the crude discount remains larger than the additional shipping cost, buyers still have an incentive to take the barrels.
That does not mean the current system is sustainable. TotalEnergies is also backing alternative export infrastructure, including the proposed Baghdad–Syria pipeline and an expansion of the Habshan–Fujairah pipeline, which currently has capacity of about 1.8mn bpd.
Iran Extends Pressure to Tankers and STS Transfers
At the same time, Iran is increasing the legal and operational risk around Hormuz traffic.
Authorities have threatened 45 tankers with fines, detention and potential cargo confiscation for alleged violations of transit rules. Iran has also warned that vessels conducting ship-to-ship transfers with blacklisted ships could face similar penalties.
That matters because STS has become an increasingly important part of the workaround for disrupted Gulf crude flows.
What initially functioned as an alternative logistics route is therefore becoming part of the enforcement perimeter itself. For shipowners and charterers, the issue is no longer only physical security in the strait, but also counterparty screening, insurance exposure and the risk attached to STS participation.
VLCC Rates Hit a Record High as Crude Routes Grow More Complex
The disruption is also showing up directly in tanker earnings.
Middle East crude is increasingly moving through combinations of STS transfers, pipeline movements, vessel repositioning and longer seaborne detours rather than straightforward Gulf-to-Asia voyages.
Those additional steps consume more vessel-days without requiring higher underlying crude volumes, tightening effective VLCC supply.
On August 24, Baltic Exchange benchmark TD3C Middle East Gulf–China VLCC earnings reached about $624,388 per day, or Worldscale 606, an all-time high.
MEG–China VLCC Earnings Surge to a Record High
Source: Baltic Exchange; Lloyd’s List
Lloyd’s List noted that strong refining economics and heavily discounted crude are allowing charterers to tolerate freight costs that would normally look prohibitive. The result is an unusual tanker market in which disrupted trade is not necessarily reducing demand for ships; instead, each barrel is becoming more shipping-intensive.
Hormuz is still moving crude, but through a much more expensive and complicated system.
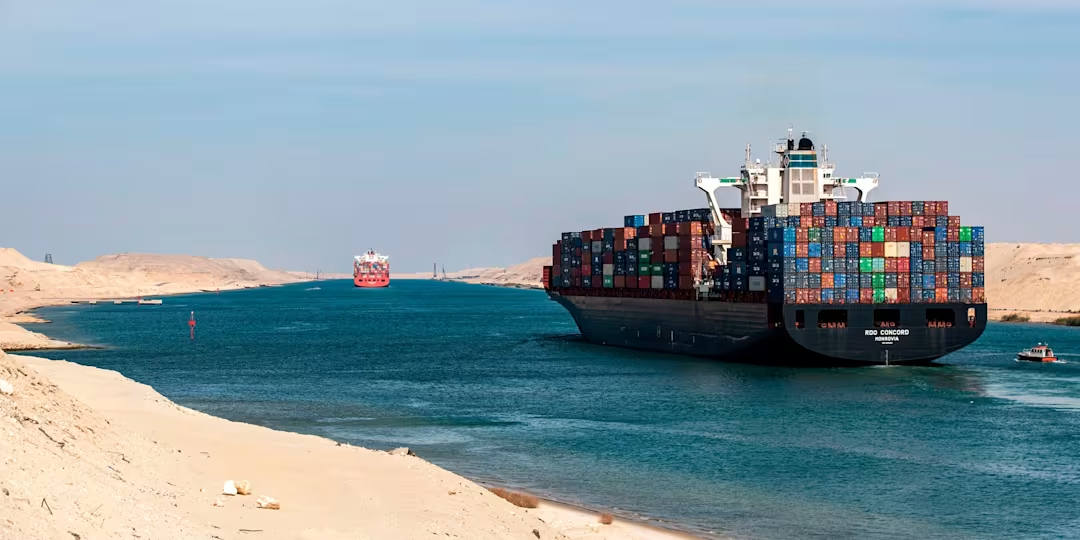
On August 10, 2026, Maersk and Hapag-Lloyd announced that another container service in the Gemini shipping network would resume transiting the Red Sea and the Suez Canal. The two companies had already begun restoring Suez transits on some Asia-Europe services in July. This suggests that global shipping companies are once again testing a route that they had largely abandoned over the previous two years.
But this is still far from a full return. As of August 13, Maersk had restored only about one-third of its normal Red Sea and Suez traffic, with just 4 of the 13 relevant services returning to the route. The company believes that conditions in 2026 are now sufficient for a full resumption, but it has nevertheless chosen to adjust its network gradually.
Unlike the Panama Canal, the Suez Canal did not impose draft restrictions because of water shortages, nor did infrastructure damage cause a prolonged reduction in transit capacity. The Suez Canal is a sea-level canal with no locks. Ships entering from the Mediterranean do not need to be raised to an artificial lake and then lowered back to sea level, as they do in the Panama Canal. The Suez Canal Authority explicitly describes it as the longest canal in the world without locks.
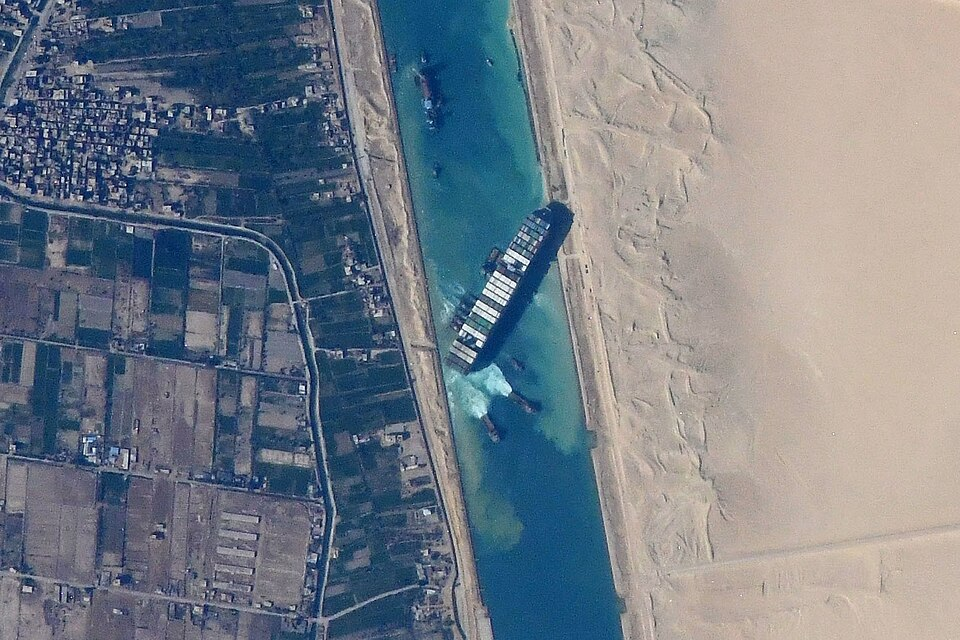
Of course, the Suez Canal is still subject to physical constraints such as channel depth, dredging requirements, windblown sand, accidents, and vessel size. The grounding of the Ever Given in 2021 demonstrated that an accident can temporarily shut down the entire waterway.
The container ship Ever Given stuck in the Suez Canal in Egypt, viewed from the International Space Station. (Image: NASA JSC ISS image library)
Yet traffic still largely disappeared. In 2023, 26,434 vessels transited the Suez Canal, representing 1.568 billion net tons. In 2024, that fell to just 13,213 vessels and 525 million net tons. In 2025, traffic remained at only 12,758 vessels and 522 million net tons. In other words, the number of vessels transiting the canal in 2025 was still less than half the 2023 level.
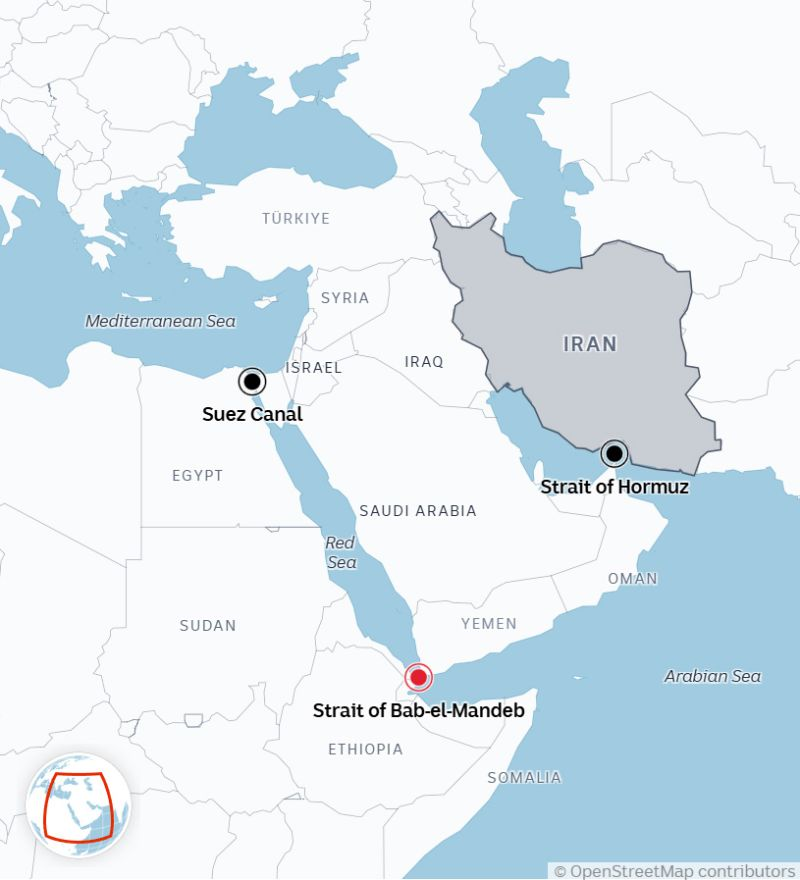
The Suez Canal's problem is primarily one of route substitution. The physical capacity is still there, but security risk determines whether shipowners are willing to use it. And to understand why, we need to look about 1,500 miles south, to the Bab el-Mandeb Strait between Yemen and Djibouti.
Suez and Bab el-Mandeb Are Effectively One Piece of Infrastructure
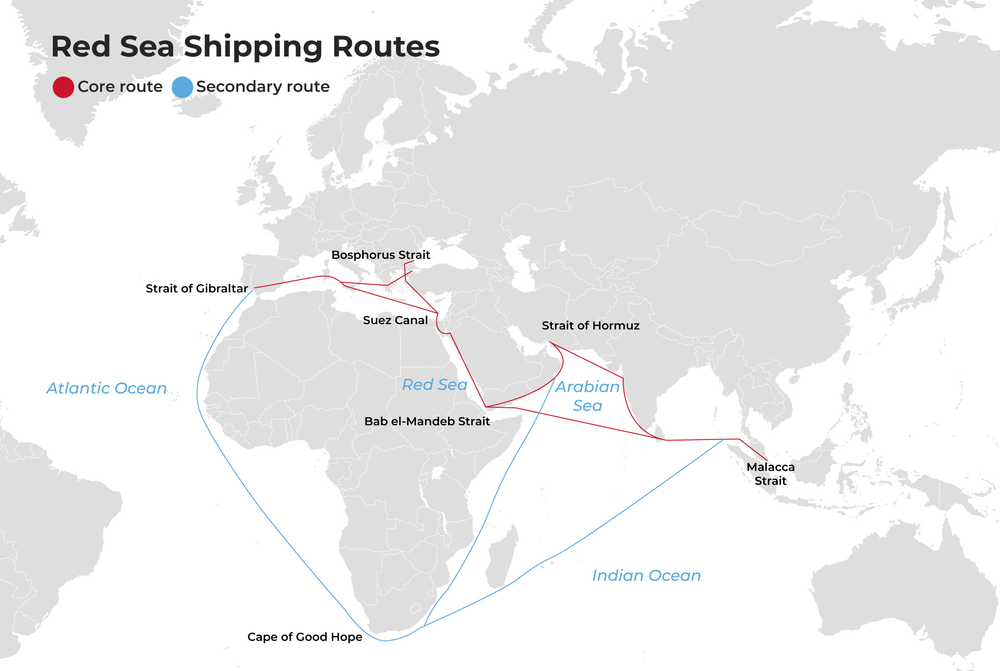
For a container ship sailing from Singapore to Rotterdam, the full route for “going through Suez” is: Indian Ocean -> Bab el-Mandeb -> Red Sea -> Suez Canal -> Mediterranean -> Europe.
Economically, this means Bab el-Mandeb and the Suez Canal function as two nodes in series. If the Suez Canal is closed, the Asia-Europe shortcut cannot be used. If Bab el-Mandeb becomes dangerous enough that shipowners are unwilling to transit it, the outcome is effectively the same.
That is what has happened since 2023. Houthi attacks from Yemen have been concentrated mainly in the southern Red Sea and around the Bab el-Mandeb Strait, yet Egypt, some 1,500 miles away, has suffered enormous economic losses. Before the crisis, UNCTAD estimated that the Suez Canal carried around 12% to 15% of global trade in 2023. After the Red Sea conflict began, Suez Canal transits had fallen by about 42% from their previous peak by early 2024, while weekly container ship transits at one point dropped by 67%.
This illustrates an important feature of chokepoints: they do not need to be physically blocked to lose their economic function. They only need to become sufficiently costly or sufficiently dangerous to use.
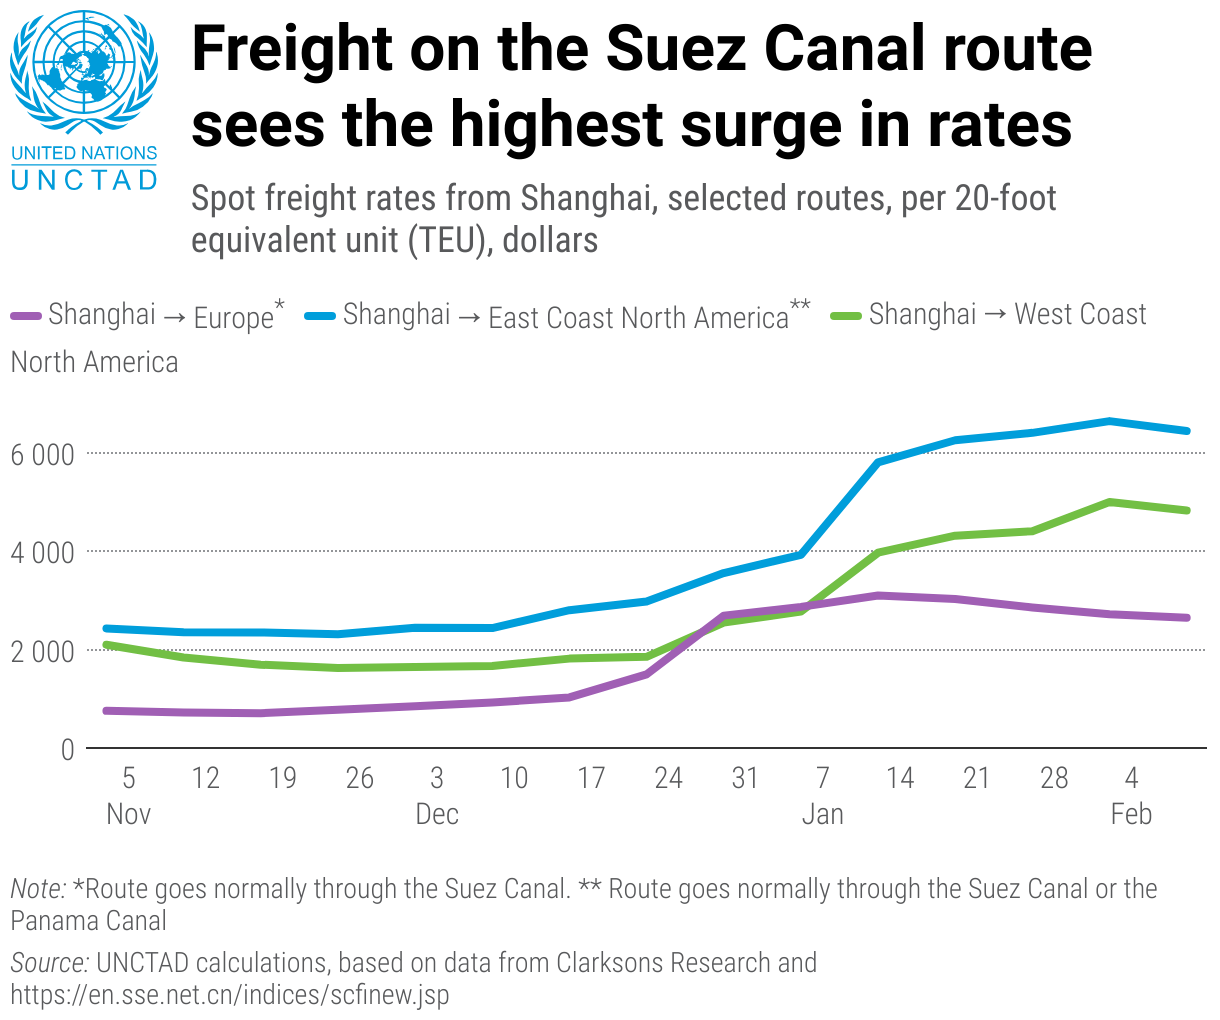
Data shown for Nov 2023 - Feb 2024
What Suez Really Sells Is “Not Having to Sail Around Half of Africa”
The economics of the Suez Canal do not require a complicated model. What it really sells is the convenience of not having to sail around Africa.
The official voyage-distance data from the Suez Canal Authority make this very clear. From Singapore to Rotterdam:
Via the Suez Canal: 8,288 nautical miles
Via the Cape of Good Hope: 11,755 nautical miles
Distance saved: 3,467 nautical miles (-29%)
At an average speed of 16 knots, 3,467 nautical miles translates into roughly nine additional days of pure sailing time. Actual commercial voyage times depend on factors such as slow steaming, weather, port schedules, and vessel speed, but freight companies typically estimate that rerouting Asia-Europe voyages around the Cape of Good Hope adds about 10 days.
As long as the cost of transiting Suez is lower than the cost of rerouting around the Cape of Good Hope, the canal remains attractive. If Red Sea security risks push the first option above the second, ships will sail around Africa instead.
The economic value of the Suez Canal can therefore be understood, in simplified form, as Avoided Cape Cost - Canal Toll - Red Sea Risk.
Source: seasonalliving
When it comes to canal tolls, the Suez Canal Authority does not charge a simple flat rate such as “$500,000 per ship.” Base transit dues are calculated according to Suez Canal Net Tonnage, vessel type, whether the vessel is laden or in ballast, and other conditions. Different vessel categories are subject to different rates, with various surcharges, rebates, and special-route discounts layered on top.
Economically, this makes sense. A large crude oil tanker, a 20,000 TEU container ship, and a small bulk carrier face very different costs if they have to reroute around the Cape of Good Hope, so their willingness to pay for the Suez shortcut naturally differs as well.
The SCA also actively adjusts prices in response to shipping-market conditions. At the height of the Red Sea crisis, Egypt needed to attract ships back.
In May 2025, the SCA offered a 15% rebate on transit dues to large container ships with a Suez Canal Net Tonnage of 130,000 tons or more. One of the direct objectives was to help shipping companies offset the higher insurance costs associated with operating through the high-risk Red Sea. But as shipping conditions changed, the SCA suspended the 15% rebate from April 7, 2026.
Then, from July 15, 2026, temporary surcharges for several vessel categories were raised again. Kuehne+Nagel summarized these adjustments. Laden crude oil tankers were required to pay a 37% surcharge on top of normal transit dues, compared with 27% for ballast tankers, 22% for dry bulk carriers, 19% for LNG carriers, and 12% for container ships.
This sequence of offering a rebate, withdrawing it, and then raising surcharges reveals the essence of Suez pricing quite clearly: the SCA is pricing the economic value created by allowing ships to avoid sailing several thousand extra nautical miles. But it cannot raise prices without limit. The Cape of Good Hope remains an open-access competing route outside the Suez Canal, placing a natural ceiling on the SCA’s pricing power. So although the Cape of Good Hope lies thousands of kilometers from Egypt, it effectively participates in the price discovery of Suez Canal transit fees.
The 2026 Hormuz Crisis Put the Entire System Through an Even Greater Stress Test
If Suez and Bab el-Mandeb were already complicated enough, the 2026 Hormuz crisis added another layer.
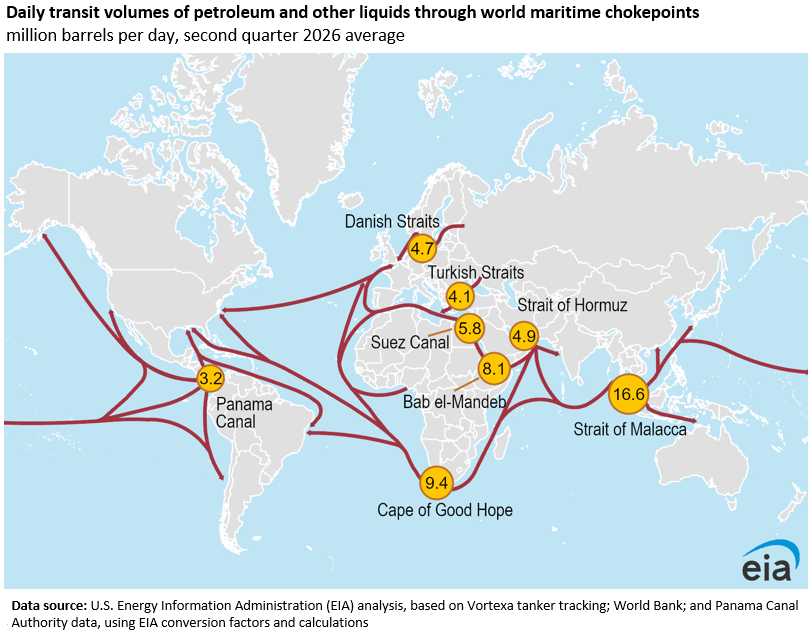
EIA data show that crude oil and petroleum products flow through the Strait of Hormuz averaged about 21.6 million barrels per day in the fourth quarter of 2025. By the second quarter of 2026, that had fallen to just 4.9 million bpd. At the same time, oil flows through Bab el-Mandeb increased from 5.4 million bpd in the fourth quarter of 2025 to 8.1 million bpd in the second quarter of 2026.
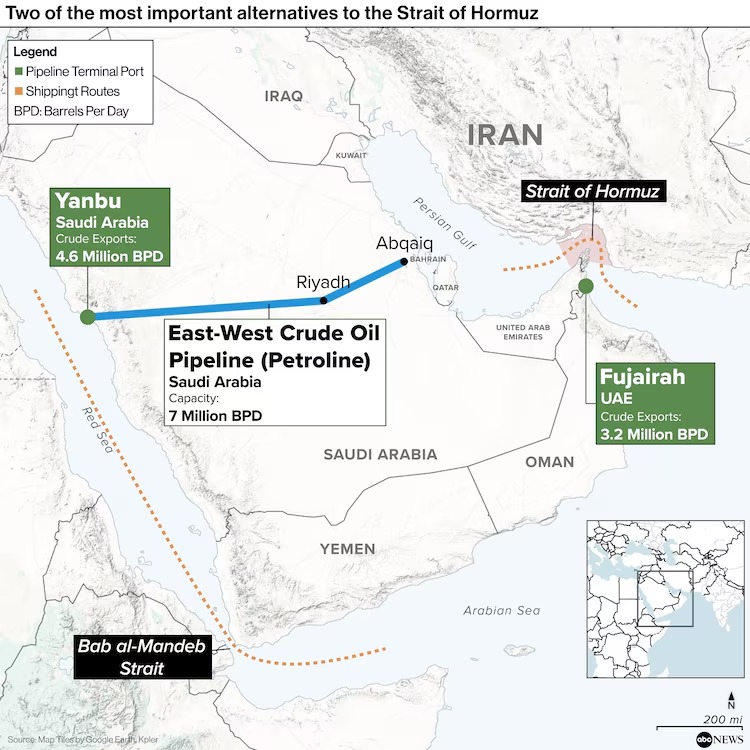
This is because Saudi Arabia has the East-West Pipeline, also known as Petroline, a strategic asset that many other Gulf oil producers do not have. The pipeline is about 1,200 kilometers long and connects Saudi Arabia's eastern oil fields with the Red Sea port of Yanbu. Its current maximum crude capacity is about 7 million barrels per day, of which roughly 2 million bpd supplies west coast refineries and about 5 million bpd can be used for exports. After Hormuz was severely disrupted, the pipeline quickly became one of Saudi Arabia's most important alternative export routes. Saudi Arabia could therefore send a barrel of crude that would otherwise have been exported from the Persian Gulf directly to the Red Sea. At that point, Hormuz had been successfully bypassed.
Image: abc News; Map Tiles by Google Earth, Kpler
From Yanbu, Saudi crude then faces two directions.
To Europe, it can head north: Yanbu → Red Sea → Suez/SUMED → Mediterranean → Europe
To Asia, it can head south: Yanbu → Bab el-Mandeb → Indian Ocean → Asia
This gives the East-West Pipeline enormous strategic value.
But in July 2026, risks around Bab el-Mandeb also rose rapidly. This produced an extremely counterintuitive route. A barrel of Saudi crude sold to Asia began by sailing in the direction of Europe. The tanker first headed north into the Mediterranean, then sailed west through the Strait of Gibraltar, around the entire African continent, and finally re-entered the Indian Ocean. The voyage increased from 19 days to 48 days, while fuel costs rose from about $1.26 million to around $2.87 million. On top of that, transiting Suez itself also requires paying canal tolls.
SUMED Means the “Suez” Corridor Is Not Actually a Single Route
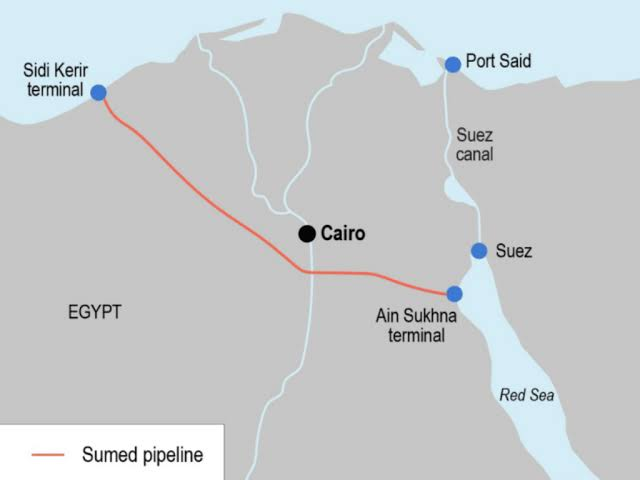
For oil, the Suez corridor consists not only of the Suez Canal, but also the SUMED Pipeline. SUMED connects Ain Sokhna on the Red Sea side with Sidi Kerir on the Mediterranean side and has a transport capacity of about 2.5 million barrels per day. When large VLCCs cannot transit the Suez Canal fully laden because of draft restrictions, they can discharge part of their crude into SUMED and have it handled or reloaded on the Mediterranean side.
In the second quarter of 2026, the Suez Canal and SUMED together transported about 5.8 million barrels per day of crude oil and petroleum products, including around 3.6 million bpd of crude and condensate. As risks around Bab el-Mandeb worsened, this northbound export route became even more important. In one week in early August, crude and condensate loadings at Sidi Kerir reached a record 2.17 million bpd, up about 50% from the previous week, with Saudi crude accounting for roughly 90%.
Image: Logistics Middle East
Saudi Arabia is now even considering expanding the East-West Pipeline by another 1 million to 2 million barrels per day. Reuters reported that such an expansion would require several years and billions of dollars in investment, and that Saudi Arabia has also discussed with some neighboring countries the possibility of using this export network in the future.
At the End of Every Escape Route May Lie the Next Chokepoint
If you look only at a map, Hormuz, Bab el-Mandeb, and Suez appear as three separate red dots. In reality, they are part of an interconnected transport network. When one node is disrupted, the cargo does not simply disappear. Some production may be forced to shut down, and some cargo may go into storage, but large volumes will still seek alternative routes. As a result, disruption at one chokepoint becomes additional traffic, congestion, risk, and price pressure at other chokepoints.
The Panama Canal shows us that a global shipping route can be constrained by something as seemingly local as freshwater. Suez and Bab el-Mandeb show us that a canal that remains completely open and has ample physical capacity can still lose more than half of its customers because of security risks 1,500 miles away. The 2026 Hormuz crisis goes one step further: even building a hugely valuable alternative oil pipeline and successfully moving oil away from one chokepoint does not mean escaping geography. Saudi Arabia's East-West Pipeline does bypass Hormuz. But once it delivers the oil to Yanbu, there are still only two choices: head north through Suez, or head south through Bab el-Mandeb. When the southern route also becomes dangerous, a barrel of Saudi crude that would normally take just 19 days to reach Asia may instead have to travel north through Suez, pay about $1 million in canal tolls, sail around the entire African continent, and take 48 days to reach Asia.
The real economics of global chokepoints is never just about how many ships a particular canal can handle. It is also about how much more the second route costs when the first route fails, how much more time it consumes, how much additional shipping capacity it ties up, and which chokepoint it must ultimately pass through. In the global shipping network, every escape route may end at the next bottleneck.
Disclaimer: The content is for informational purposes only. You should not construe any such information or other material as legal, tax, investment, financial, or other advice. Nothing contained in this article constitutes a solicitation, recommendation, endorsement, or offer by the author(s) or any third party service provider to buy or sell any securities or other financial instruments in your or in any other jurisdiction in which such solicitation or offer would be unlawful under the securities laws of such jurisdiction. The author(s) report(s) no conflict of interest.
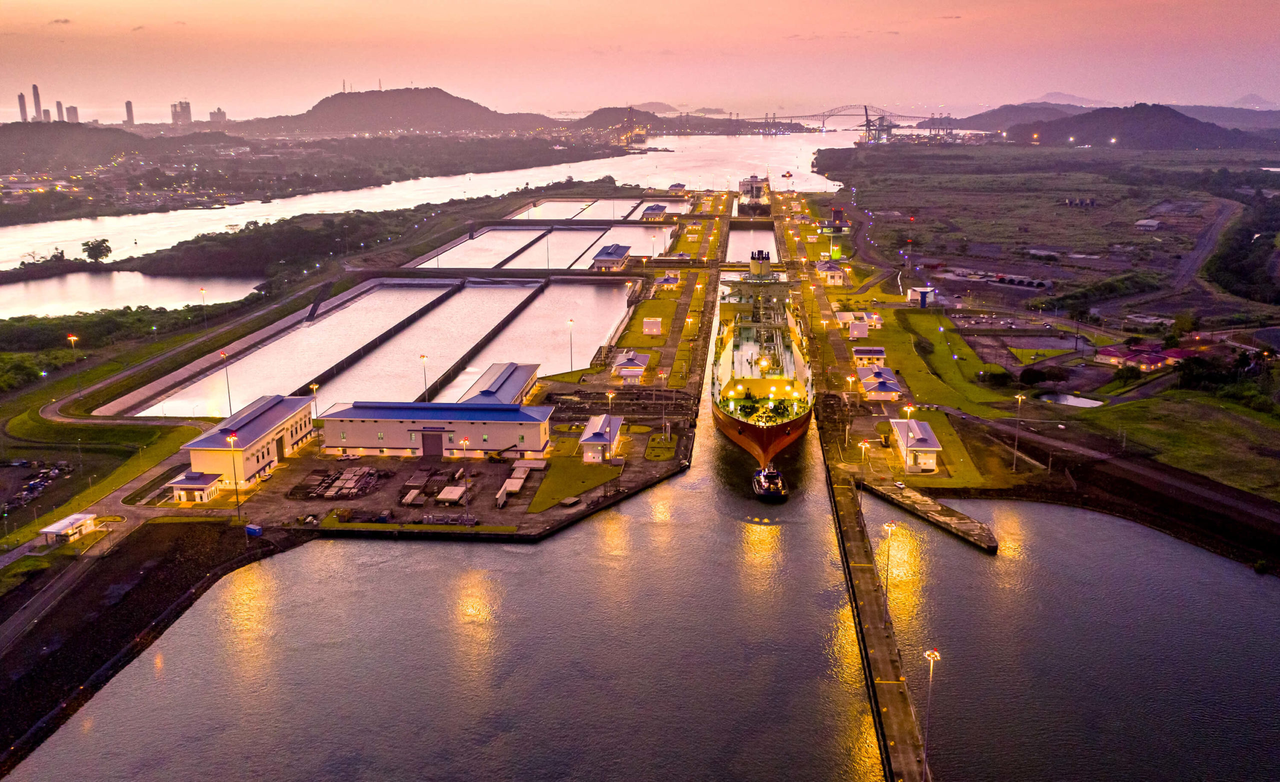
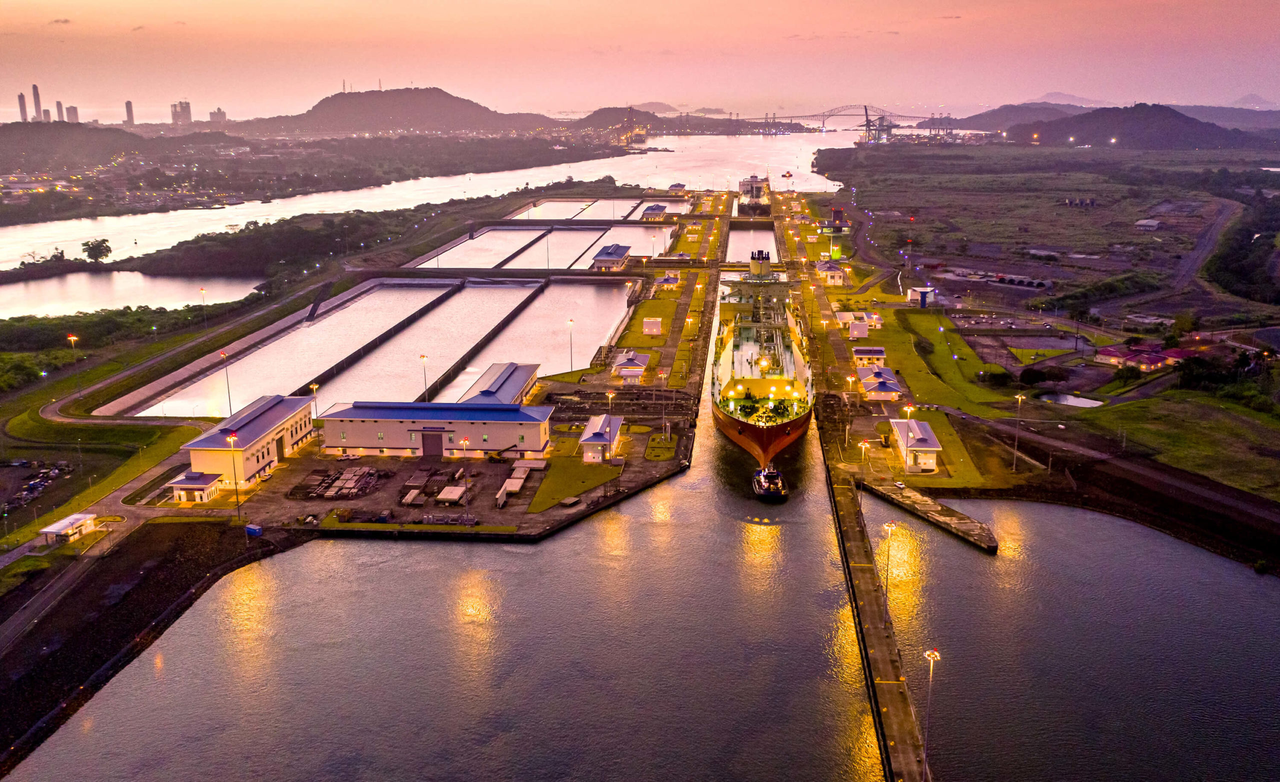
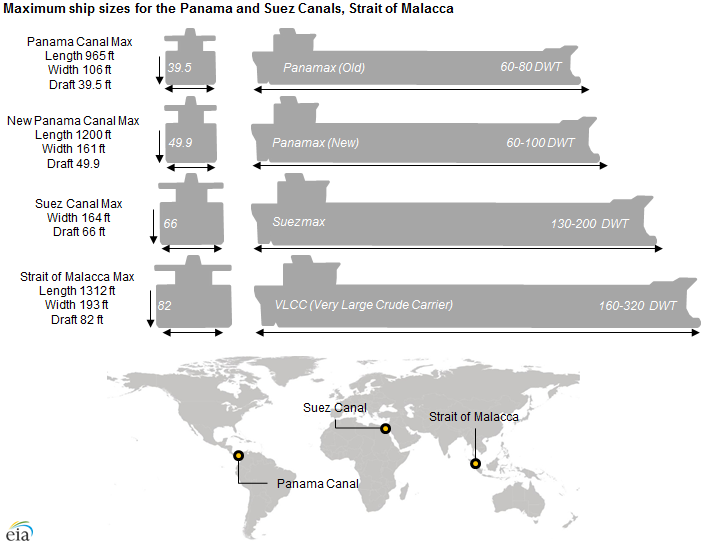
On August 5, 2026, the Panama Canal Authority announced another tightening of draft restrictions for large vessels. Starting August 26, the maximum allowable draft for Neopanamax vessels will be reduced to 48 feet. From September 3, it will be lowered further to 47.5 feet and remain at that level until further notice.
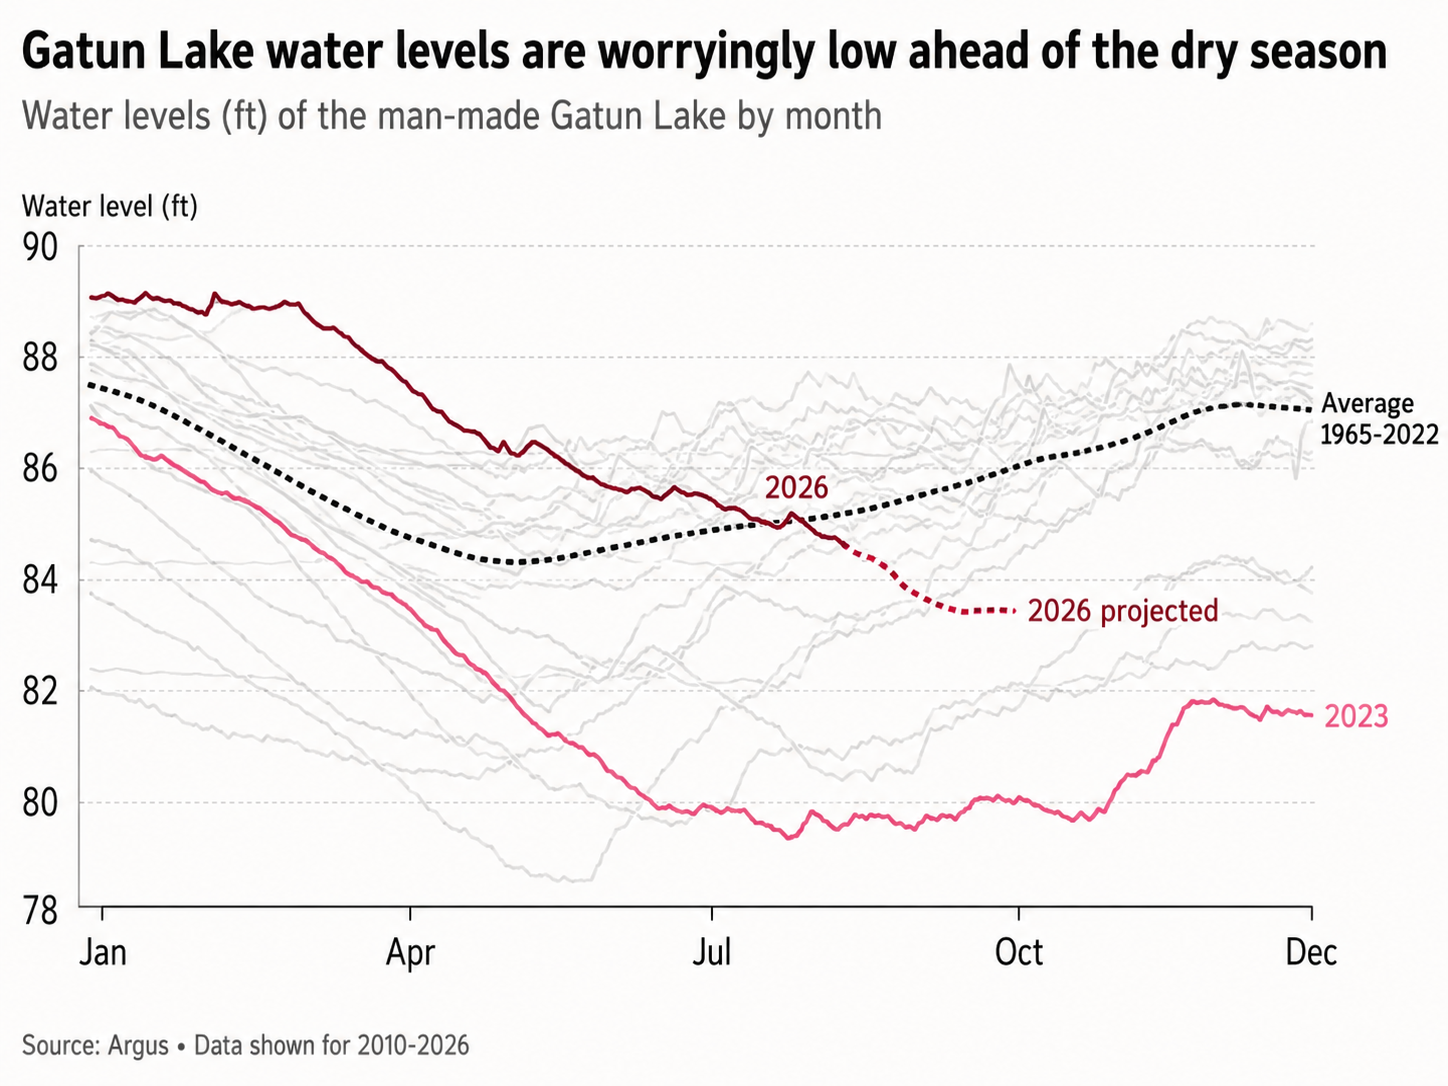
Under normal conditions, when the water level of Gatún Lake reaches 85 feet, Neopanamax vessels can operate at a maximum draft of 50 feet. In other words, the fundamental problem is that there is simply not enough water in the lake. More interestingly, the Authority has not, for now, reduced the number of vessels allowed to transit the canal each day.
Source: the U.S. EIA
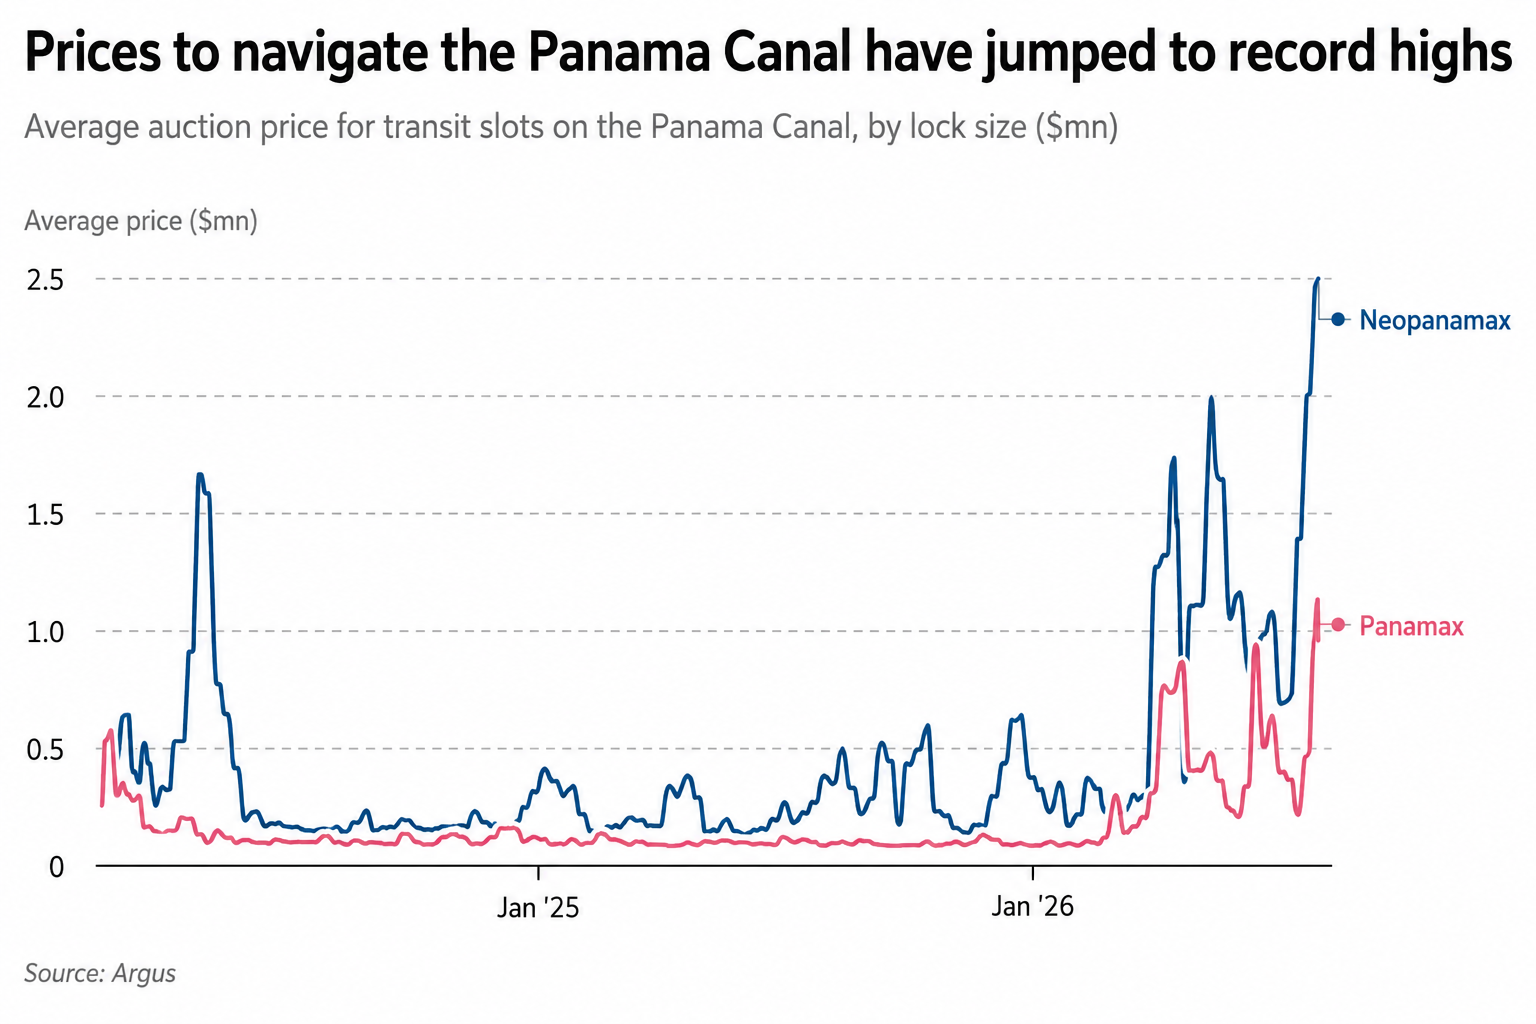
Meanwhile, another price at the canal is surging. According to the Financial Times, the average winning bid for the Panama Canal’s daily auctioned transit slots has reached about $1.1 million so far in August 2026, more than 16 times the level recorded during the same period last year. Slots for the larger locks have averaged about $2.5 million, with individual bids reaching as high as $3.78 million. On August 3, around 113 vessels were waiting to transit the canal, compared with just 40 on January 2.
These two seemingly different developments are actually pointing to the same underlying issue: the Panama Canal is not merely selling access to a waterway. What it is really selling is interoceanic transportation capacity created by freshwater. Once you understand this, the economics of the Panama Canal look completely different.
Average auction price for transit slots, late Jan 2024 - early Aug 2026
The Panama Canal Is Essentially a Giant "Freshwater Elevator"
Many people picture the Panama Canal as a waterway dug through the land to connect the Atlantic and Pacific Oceans. If that were really the case, water shortages should not be a major problem. The Suez Canal, for example, is a sea-level canal, where ships travel through at roughly the same elevation.
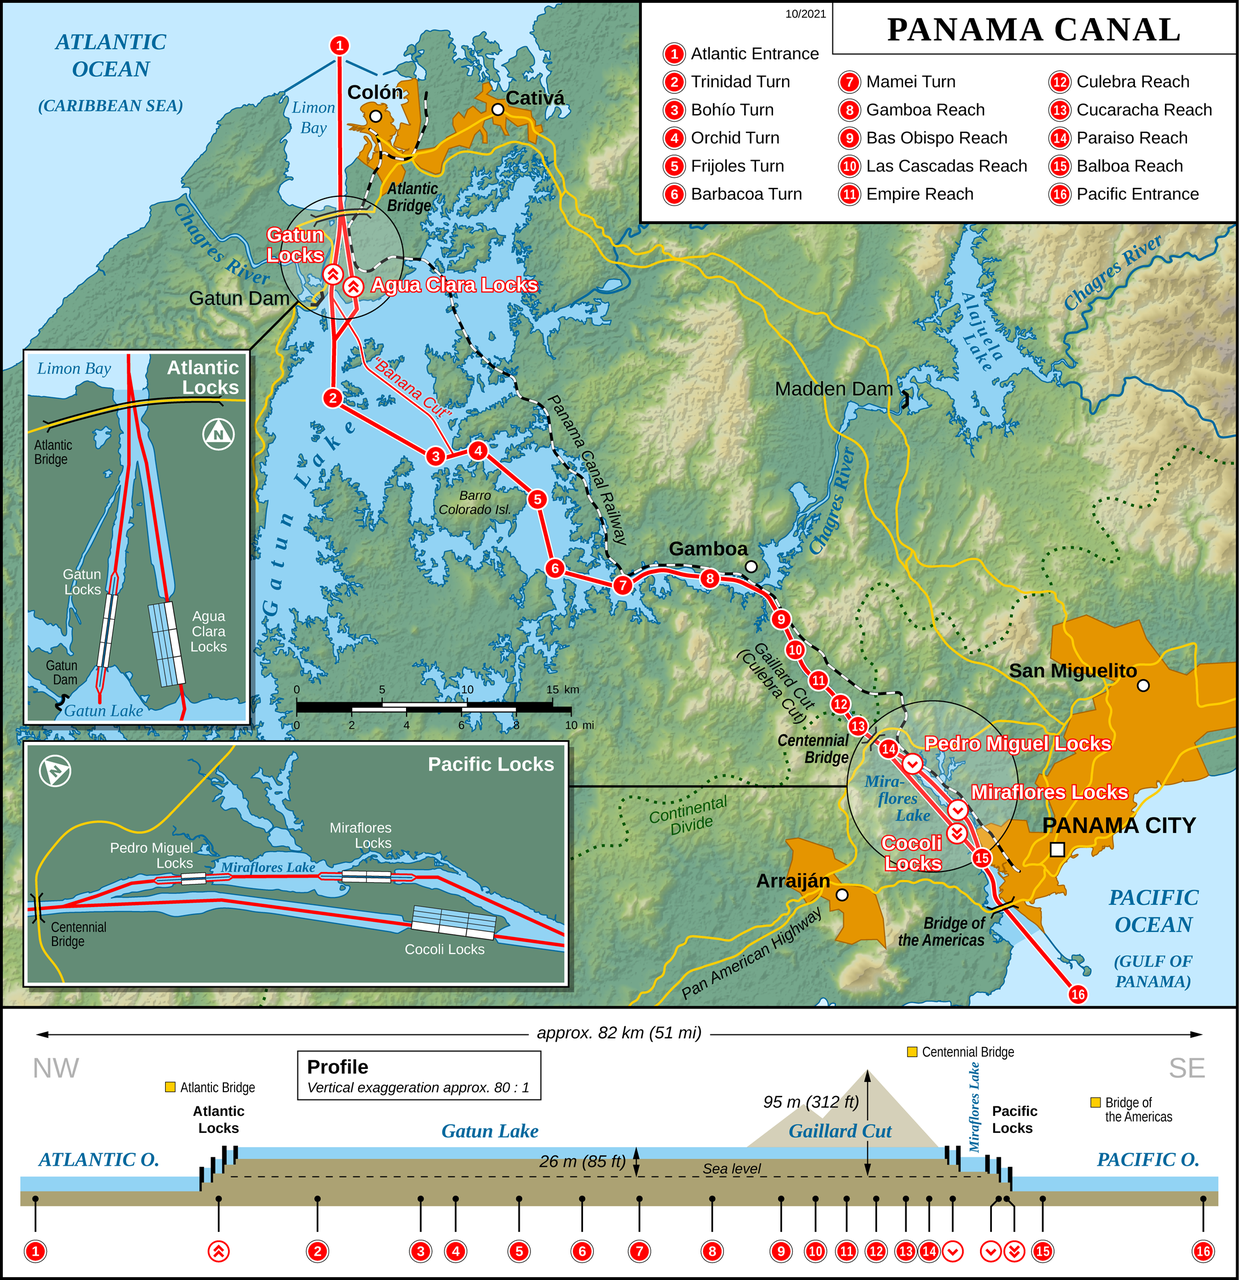
But the Panama Canal is different. After entering the canal from sea level, ships must be lifted step by step through a series of locks until they reach Gatún Lake, about 85 feet above sea level. They then sail across the isthmus before descending through another set of locks back to sea level on the other side. The process is powered not by giant pumps, but primarily by gravity and freshwater. In other words, every time a ship crosses the Isthmus of Panama, some of the freshwater stored in the lakes must be released.
Map of the Panama Canal (Image: Thomas Römer/OpenStreetMap data)
World Weather Attribution estimates that operating the Panama Canal’s locks requires about 7 billion liters of water per day from the rain-fed Gatún Lake.
Operational data from the Panama Canal’s 2025 fiscal year show that the average volume of water involved in each Panamax transit was about 0.194 hm³, while a Neopanamax transit involved about 0.4368 hm³, equivalent to 436,800 cubic meters. It is important to note that this official metric refers to average operational water use. It does not mean that all of this water is permanently "consumed", because the newer locks incorporate water-recycling systems.
The Panama Canal’s actual usable transportation capacity therefore depends on reservoir storage + rainfall replenishment + water-use efficiency per transit + lock operating capacity.
This is very different from an ordinary port. Expanding a conventional port usually means adding terminals, cranes, berths, and deeper navigation channels. The expansion of the Panama Canal, however, produced a much more unusual result: the physical capacity created by steel and concrete can exceed the capacity that the natural water cycle can sustainably support. The 2016 expansion solved the problem of ships being "too large", but it did not fundamentally solve the question of whether there would be enough water. That is why the marginal resource determining the Panama Canal’s effective transportation capacity today is not concrete, but rain.
Seasonality chart of water levels of the man-made Gatún Lake
Limiting Weight Before Limiting Ship Numbers
This time, the Panama Canal Authority has specifically emphasized that it is not currently reducing the number of vessels allowed to transit the Panamax or Neopanamax locks each day. That point is extremely important. If you look only at the headline figure for "how many ships transit each day", you might conclude that the canal is still operating normally and that the problem is not particularly serious.
But when measuring transportation capacity, the unit that really matters is cargo per day, not ships per day.
Draft is the depth to which a ship’s hull sits below the waterline. The heavier the ship is loaded, the more water it displaces and the deeper its draft becomes. When the water level in Gatún Lake falls, the navigation channel can safely accommodate less draft, meaning that a vessel that would normally transit at a 50-foot draft may have to reduce fuel, ballast water, or cargo.
In practice, the Authority therefore has two separate control valves: how many ships are allowed to transit each day + how heavily each ship is allowed to load. During the extreme drought of 2023, both valves were used. At the time, the maximum draft for Neopanamax vessels fell from the normal 50 feet to 44 feet, while daily transit capacity was also reduced from normal levels.
The approach in August 2026 is more subtle: keep the number of ships broadly unchanged at first, while lowering the maximum load each vessel can carry. This means that when assessing risks to the Panama Canal, focusing only on the number of daily transits is misleading. Even if 35 or 38 ships are still passing through each day, the canal’s actual daily cargo throughput can still decline if more vessels are forced to sail with reduced loads.
Moreover, because a ship’s own weight, equipment, fuel, and other fixed components do not change much, a draft restriction reduces the vessel’s total allowable displacement, while cargo capacity is only what remains after subtracting those fixed weights. For a vessel that would otherwise be fully loaded, even a reduction of only a few percentage points in allowable draft can therefore translate into a disproportionately large loss in the revenue-generating cargo payload. However, the exact relationship between the change in displacement and a given reduction in draft is not linear. It depends on factors such as the vessel’s hull form, dimensions, and actual loading condition.
How Does a Drop of Freshwater Turn Into a $1 Million Transit Right?
If water is scarce, the natural question is: who gets access to the limited supply?
The Panama Canal has developed a highly market-oriented answer. It does not simply charge tolls. It also operates reservation systems, long-term slot allocation, and auctions. Official 2026 tariff documents show that a standard Neopanamax reservation slot carries a booking fee of $100,000. These regular slots are requested ahead of arrival during designated booking periods. By contrast, an auction price applies when a vessel competes for one of the slots specifically released through the Canal’s auction mechanism, often because regular capacity is already allocated or the vessel operator needs a slot closer to the transit date. The auction starts from a minimum price set by the Canal, but the slot goes to the highest bidder. In 2026, the Canal said it typically makes three to five slots per day available through auction.
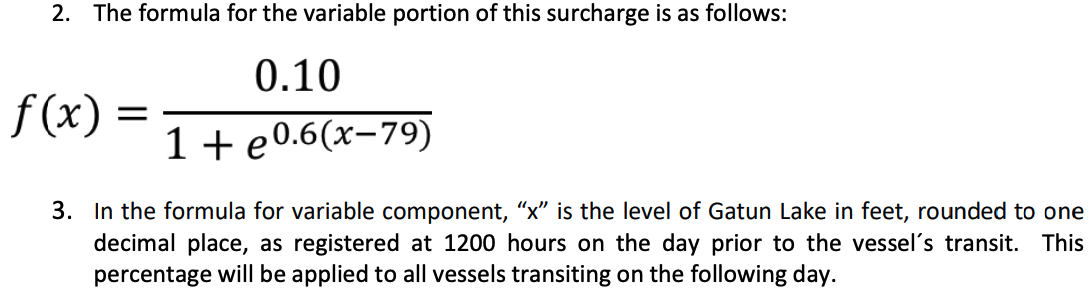
Even water itself has entered the pricing system. The Panama Canal currently imposes a Fresh Water Surcharge. Fixed portion of the surcharge is either $4,000 (for vessels > 125 feet and ≤ 300 feet) or $10,000 (for vessels > 300 feet). For vessels longer than 125 feet, an additional variable component is determined directly by the official water level of Gatún Lake on the day before transit, and can range from 0% to 10% of the vessel’s total canal toll. The scarcer the lake water becomes, the higher the price of water.
This is actually a remarkably clean economics case. Panama does not have a tradable "Gatún Lake freshwater futures" contract comparable to crude oil futures. But the scarcity value of water is already being expressed through at least three different prices:
Fresh Water Surcharge: directly maps the water level of Gatún Lake into the cost of transit.
Transit slot auction prices: as available capacity becomes scarcer relative to demand, shipowners bid up the price of securing timely passage.
Global shipping prices: if vessels cannot transit on time, they must wait, reduce their loads, or reroute through longer alternatives such as the Suez Canal or the Cape of Good Hope. The scarcity then feeds into fuel costs, vessel charter rates, inventory carrying costs, and ultimately the prices of goods.
This is why a transit right worth more than $1 million is economically meaningful. It can be understood as the market-implied shadow price of the service of "crossing the Isthmus of Panama immediately".
The maximum price a shipping company is willing to pay depends roughly on:
additional fuel costs from rerouting
additional sailing days × daily vessel cost
financing and carrying costs of the cargo
costs of delayed delivery and supply-chain disruption
expected cost of continuing to wait
So $1 million is not some absurd "queue-jumping fee". It is telling us that, for certain cargoes, the economic cost of not using the Panama Canal has already exceeded $1 million.
At the same time, ships themselves are a finite stock of transportation capacity. Suppose a given volume of LPG originally requires one vessel to complete a round trip in 40 days. If rerouting extends that journey to 50 days, the world’s "effective shipping capacity" available to transport LPG declines. This is why the EIA observed that delays at the Panama Canal during the drought in 2023 pushed up vessel freight rates even in other regions. The ships did not disappear. They were simply "locked up" for longer periods by longer voyages and waiting times. The economic impact of a chokepoint therefore extends beyond the cargo that directly passes through it. It can also propagate to other trade routes by reducing the effective supply of the global fleet and pushing up freight rates.
World Weather Attribution’s attribution study of the 2023 event found that El Niño played a clear role. Under the current climate, rainfall in El Niño years is expected to be about 8% lower than in ENSO-neutral years. An exceptionally dry year like 2023 has about a 5% chance of occurring in an El Niño year under today’s climate conditions. Taking into account how frequently El Niño itself occurs, the researchers estimated that an event of this kind has a return period of roughly once every 40 years.
In fiscal year 2024, deep-draft vessel transits through the Panama Canal fell to 9,944, down 21% year over year. Average daily vessel transits at one point declined from around 36 to 27.3. Yet the canal’s revenue did not collapse. Instead, fiscal year 2024 revenue reached about 4.99 billion balboas, around 18 million more than the previous fiscal year. Net income rose to about 3.45 billion. The Panama Canal Authority explicitly stated that improvements to the reservation system, auctions, the Fresh Water Surcharge, and new pricing strategies helped support revenue.
The drought reduced physical throughput, but at the same time made transit rights more scarce. Through auctions and pricing mechanisms, the Canal Authority was able to capture part of that scarcity in the form of additional revenue. This is a classic example of scarcity rent. If the Panama Canal is understood simply as "a highway that charges tolls", this outcome looks strange. But if it is understood as a transportation capacity marketplace with a limited number of slots and the ability to price them dynamically, the result makes much more sense.
But Today’s $1 Million Price Cannot Be Attributed Entirely to Drought
Part of the surge in transit slot prices in 2026 is also being driven by changes on the demand side.
Conflict in the Middle East and other disruptions to global shipping routes have increased demand for the Panama route for some trade flows between the U.S. Gulf Coast and Asia. In April, the Panama Canal Authority explained that after the conflict began, average auction prices had already risen from around $135,000-$140,000 to about $385,000, with some bids exceeding $1 million. The Authority emphasized that these prices reflected the urgency faced by particular vessels at particular moments, as well as broader shipping-market conditions and supply and demand. They did not mean that the canal had suddenly raised its official toll to $1 million. By August, this dynamic had intensified further. According to the Financial Times, the average auction price had reached about $1.1 million.
This points to a particularly important situation now confronting the Panama Canal: disruptions at other major nodes in the global shipping network are pushing more vessels toward the Panama route. At the same time, weather conditions are reducing the amount of transportation capacity the canal can reliably provide. The global shipping system can usually absorb the failure of a single chokepoint because cargo flows can be redirected to alternative routes. But when multiple chokepoints come under pressure at the same time, those so-called "alternative routes" themselves become congested and expensive.
Spend Millions of Dollars, or Take the Long Way Around?
Water shortages do not affect all commodities equally. Scarce transit capacity will be allocated through prices to the cargoes that can best afford to pay for it. Consider three types of cargo.
Containers
Container ships may carry electronics, auto parts, clothing, machinery, and retail goods.
The value of these goods per unit of weight is usually relatively high, spreading the transit cost across the value of the cargo is more justifiable. As a result, some container operators have a very high willingness to pay for timely transit. There was even a recent case in which a container ship reportedly paid about $4 million to secure an earlier passage. That figure should not be interpreted as a standard transit fee for ordinary vessels, but it shows that the value of time can become extremely high under certain circumstances.
Grain
In fiscal year 2025, about 25.1 million metric tons of grain passed through the Panama Canal. Grain, however, has a very different economic profile from containerized cargo. The value per unit of weight is much lower. Once the price of an auctioned transit slot rises above $1 million, spreading that cost across the value of the cargo may be much harder to justify than it would be for high-value containerized goods. Vessels carrying grain may therefore be more willing to wait or reroute and accept a longer voyage.
Liquefied Petroleum Gas (LPG)
The United States is an important supplier of propane to Asia, and the U.S. Gulf Coast to East Asia is a major export route.
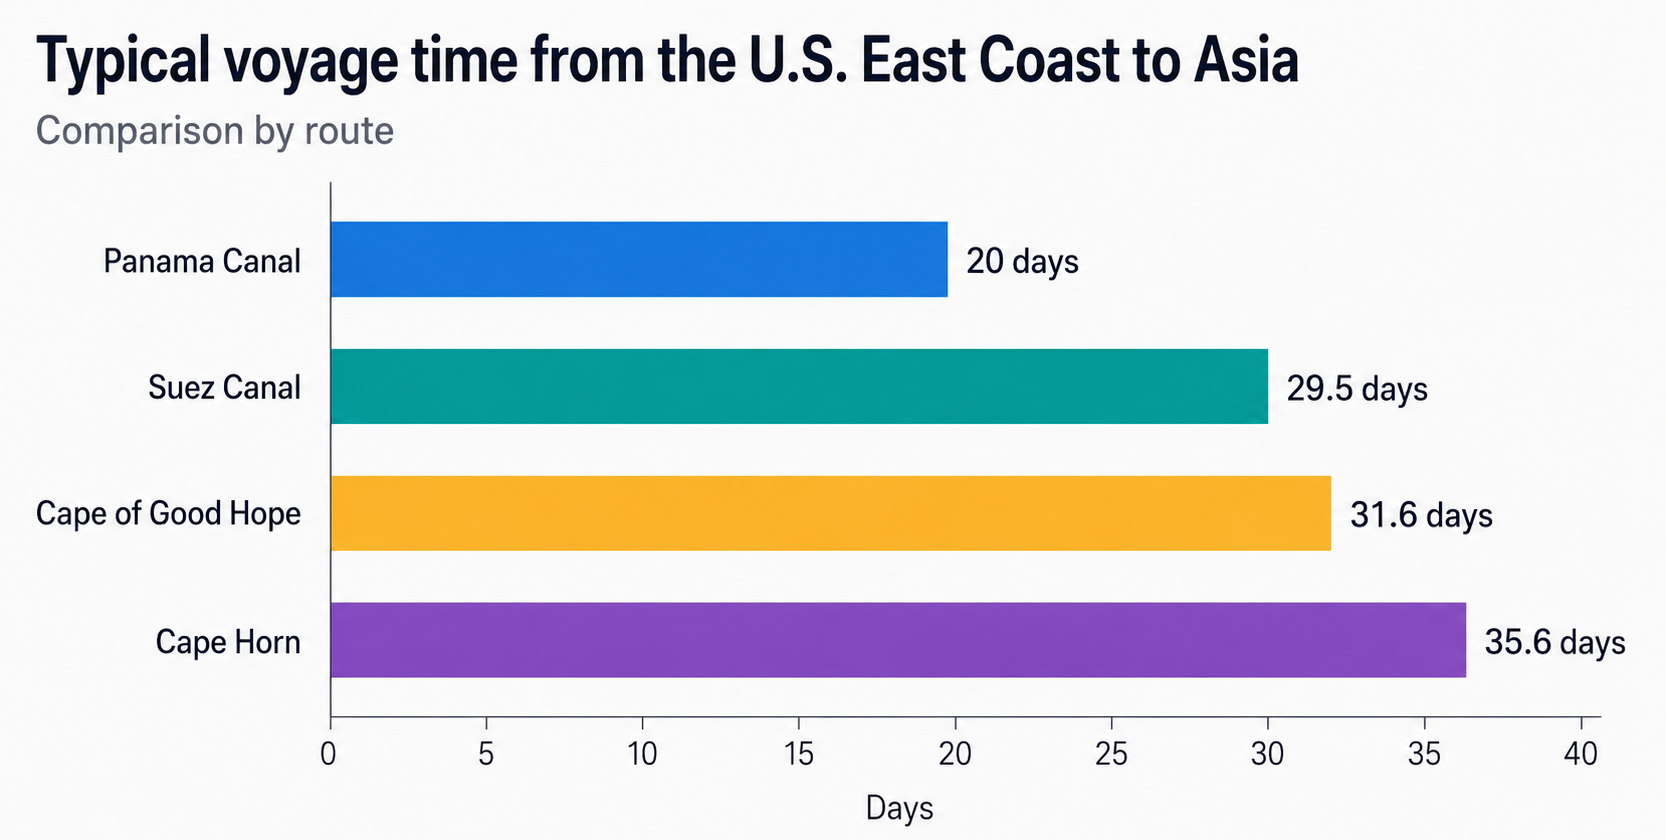
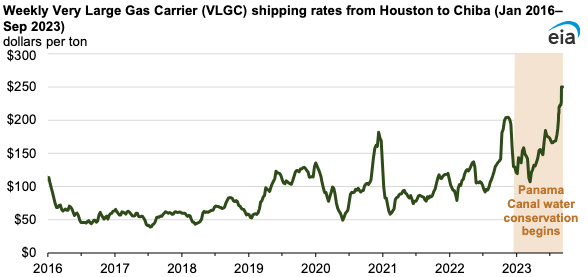
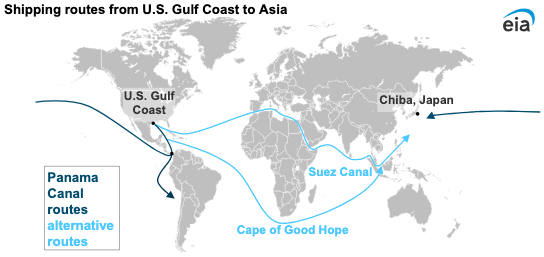
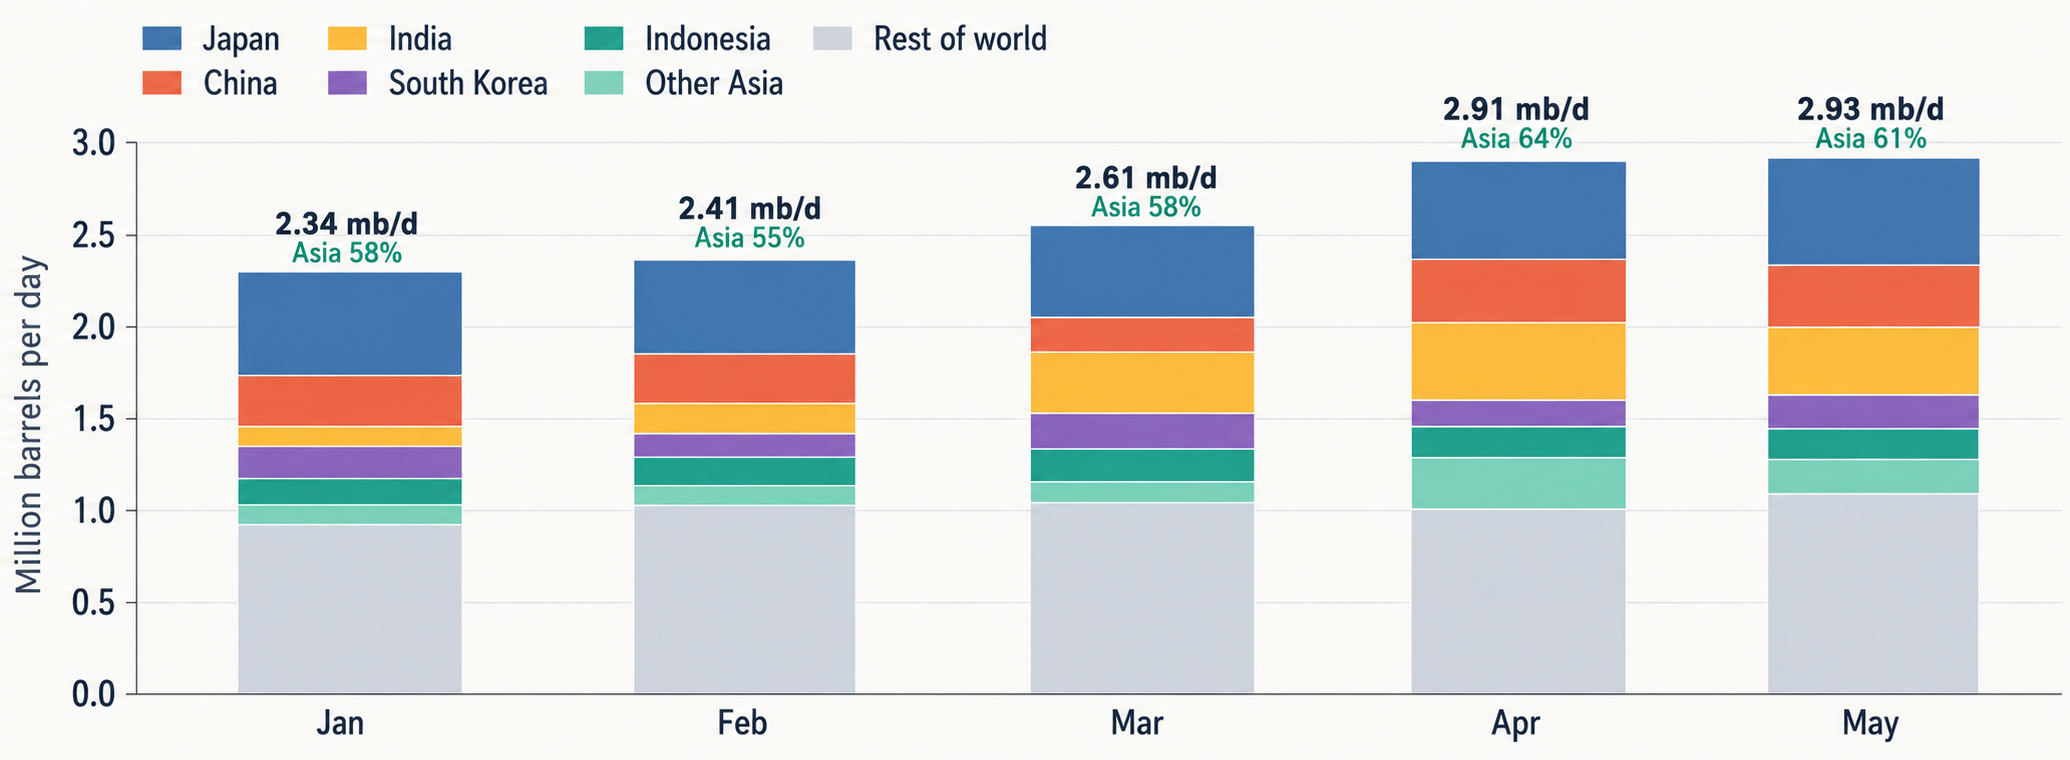
The U.S. Energy Information Administration (EIA), notes that a voyage from Houston to Chiba, Japan via the Panama Canal typically takes close to half the time required to sail across the Atlantic and then through the Suez Canal. At the height of the Panama Canal drought in 2023, waiting times for Neopanamax vessels at one point reached at least 17 days, while VLGC freight rates from Houston to Chiba rose to $250 per metric ton in late September, the highest level since the data series began in 2016. By 2025, the Panama Canal was once again carrying more than 95% of U.S. LPG exports to Asia, up from around 80% during the 2023-2024 drought period. This means that water shortages in Panama can feed into the Asian petrochemical supply chain through freight costs, because propane is not only a fuel, but also a petrochemical feedstock.
U.S. LPG monthly exports by destination, Jan - May 2026 (Source: U.S. EIA Exports by Destination, released 31 Jul 2026. LPG = propane + normal butane + isobutane. Other Asia = Bangladesh, Malaysia, Maldives, Philippines, Singapore, Taiwan, Thailand and Vietnam. Values may not sum exactly because EIA rounds each series independently.)
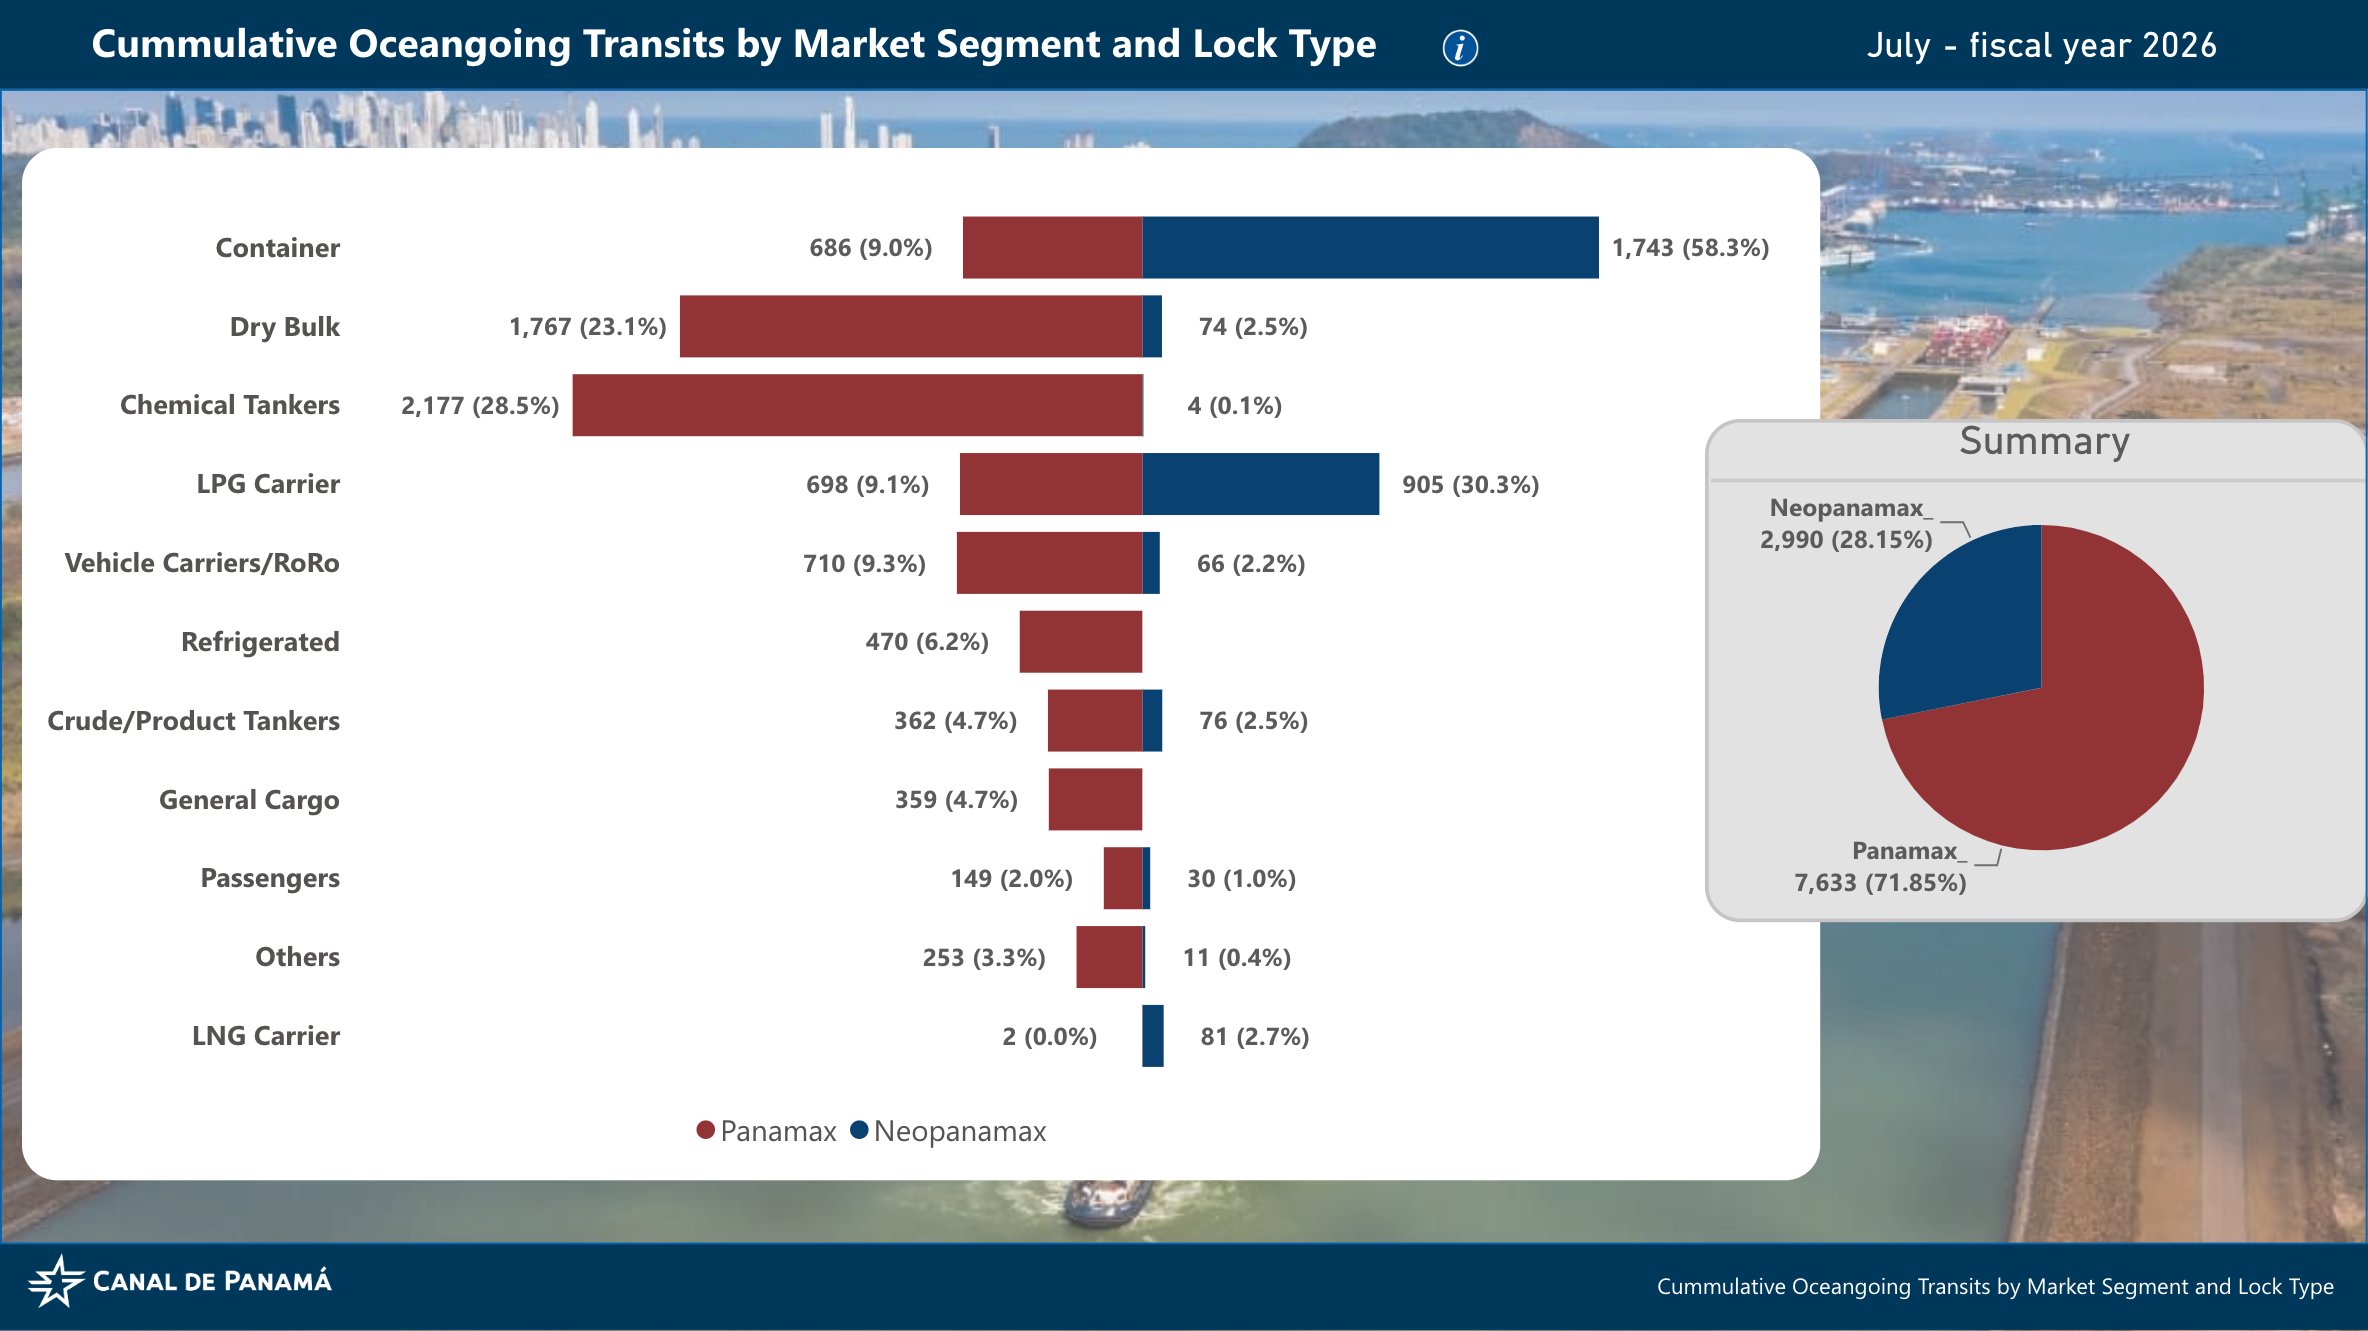
These three examples show that drought does not simply make "all goods a little more expensive". It can also change the composition of cargo moving through the canal. High-time-value, high-unit-value cargoes can bid low-value, less time-sensitive cargoes out of scarce transit capacity. In economic terms, this is a form of capacity rationing by willingness to pay. So if severe water shortages return in the future, the first thing to watch may not be a collapse in the total number of ships transiting the canal, but which types of cargo are still willing to stay.
Cumulative Panama Canal ocean-going transits by market segment and lock type, October 2025 through July 2026. (Source: Panama Canal Authority)
Should the Water Go to Ships, or to People?
If the Panama Canal used seawater, the issue would be primarily a commercial one. But it uses freshwater. Gatún and Alhajuela Lakes are also important sources of drinking water for Panama’s residents. The Panama Canal Authority states that more than 50% of Panama’s population depends on this lake system for water supply.
Every severe drought therefore forces the government to confront a fundamental resource-allocation question: what is the best use of one cubic meter of freshwater? Should it be used to let a ship carrying tens of millions of dollars’ worth of cargo pass through the canal, or should it be stored for residents to drink?
This is one of the most fundamental differences between the Panama Canal and the Suez Canal. In Panama, the marginal water resource that supports transportation capacity is drawn from the same natural resource pool that supplies water for local residents.
As the population of Panama City grows, along with industrial and household water demand, the issue is no longer simply about whether rainfall is high or low. World Weather Attribution specifically notes that population growth, urban expansion, and aging water infrastructure with significant leakage are all adding pressure to the country’s water resources.
So, more precisely, the Panama Canal is not facing simply a drought problem. It is also facing a water balance problem.
Panama’s Solution Is a $1.6 Billion Reservoir
If water is the binding constraint, the most intuitive solution is to increase the amount of water that can be stored.
That is the idea behind Panama’s Río Indio reservoir project. In 2024, the Panama Canal Authority estimated that the core project would cost about $1.2 billion, with another roughly $400 million allocated to surrounding communities, bringing the total investment to about $1.6 billion. The Authority hopes the new reservoir will improve water-supply reliability and give the canal greater confidence in maintaining around 36 transits per day. In 2025, the Panama Canal Board formally designated the Río Indio Lake Project as one of the country’s top priorities for national water security. Its objective is not only to support canal operations, but also to secure water supply for more than half of Panama’s population.
But this raises another economically important point: there is no free resilience. A new reservoir means flooded land, community displacement, and changes to the local ecosystem. In 2025, affected communities filed a lawsuit with Panama’s Supreme Court challenging the project’s constitutionality. Reuters, citing Panama Canal Authority data, reported that around 2,500 people could be affected by the project.
So "solving the Panama Canal’s water shortage" is not simply a matter of spending $1.6 billion on an infrastructure project. The "resilience" demanded by global supply chains may ultimately require a farmer living in a Panamanian river valley to give up his land. That is a very real externality, but one that is often hidden from view when we talk about globalization.
Disclaimer: The content is for informational purposes only. You should not construe any such information or other material as legal, tax, investment, financial, or other advice. Nothing contained in this article constitutes a solicitation, recommendation, endorsement, or offer by the author(s) or any third party service provider to buy or sell any securities or other financial instruments in your or in any other jurisdiction in which such solicitation or offer would be unlawful under the securities laws of such jurisdiction. The author(s) report(s) no conflict of interest.
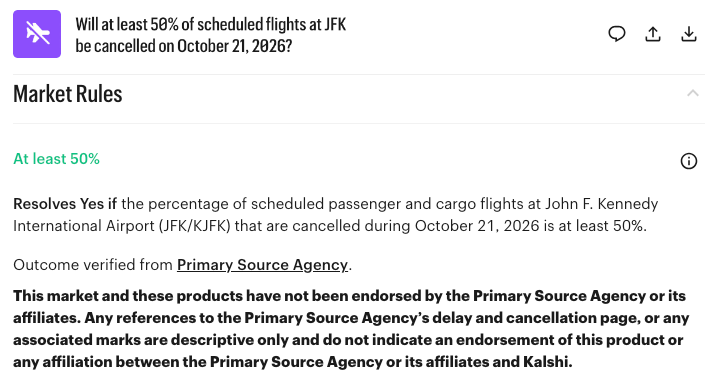
Three weeks ago, I wrote about Kalshi's newly filed airport flight-cancellation contracts. One issue stood out.
Kalshi had designated FlightAware as the primary source for settlement. Yet FlightAware's parent company, RTX, said that FlightAware did not participate in prediction markets and did not authorize its data to be used for that purpose. I ended that article by arguing that Kalshi would need to address the FlightAware issue to avoid a potential legal dispute.
On August 11, news broke that FlightAware had sued Kalshi over its use of FlightAware data and trademarks in flight-cancellation markets. The complaint was filed the previous evening, August 10, at 8:27 p.m. in the U.S. District Court for the Southern District of New York. The 45-page complaint names Kalshi Inc., KalshiEX LLC, Kalshi Klear Inc. and Kalshi Klear LLC as defendants. FlightAware also filed an emergency motion seeking court intervention.
From the complaint, FlightAware says Kalshi had opened a Personal AeroAPI account as early as July 14, 2022. It further alleges that on July 14, 2026, a Kalshi employee involved in market specifications and resolution created another FlightAware account using a Kalshi email address. FlightAware argues that these accounts were governed by its Terms of Use, Terms and Conditions and AeroAPI Personal License Agreement.
The complaint says its terms had already prohibited public or commercial use of FlightAware materials and limited free products, APIs and data to personal use. FlightAware then revised the terms on July 16 to make the point explicit, adding language prohibiting use in connection with betting, wagering, gambling, prediction markets and event contracts.
FlightAware cancelled Kalshi's Personal AeroAPI account on July 15 and sent a cease-and-desist letter. Kalshi responded on July 17 by denying that it had violated FlightAware's license or infringed its trademarks and arguing that references to FlightAware constituted nominative fair use. Kalshi subsequently added a disclaimer saying that its products had not been endorsed by FlightAware and that references to FlightAware were descriptive only.
FlightAware nevertheless proceeded to court. Its complaint contains six causes of action, including breach of contract, federal trademark infringement, injury to business reputation, federal unfair competition, unjust enrichment and New York common-law unfair competition.
It is seeking temporary, preliminary and permanent injunctive relief, damages, disgorgement of profits allegedly attributable to unauthorized use of its marks, restitution and other relief. It has also demanded a jury trial.
At this stage, none of those allegations has been proven. Kalshi will have the opportunity to answer them, and its correspondence already indicates some of the defenses it may raise.
On Tuesday, Kalshi revised how it references FlightAware, and FlightAware subsequently voluntarily dismissed the lawsuit. The dismissal could suggest that the two sides are discussing a potential resolution, although FlightAware retains the ability to bring the case again.
FlightAware is no longer explicitly identified in Kalshi’s flight-cancellation market rules, but the “Primary Source Agency” link still directs users to FlightAware.
This problem had already been looked at
This is not entirely new to the CFTC. In May, Cboe submitted a comment to the Commission containing an entire section titled "Source Agency Integrity and Settlement Conditions." Cboe noted that event contracts use a much wider variety of source agencies than traditional futures and argued that the Commission should provide guidance on what makes a source agency credible and reliable. It also recommended clearly specifying source agencies and what happens when settlement becomes ambiguous.
Then, on July 24, the CFTC's Division of Market Oversight issued Advisory Letter 26-22. In discussing settlement sources, the staff said DCMs should consider not only manipulation and reliability, but also the commercial acceptability, public availability and timeliness of the series used for cash settlement. "Commercial acceptability" suddenly looks much more important after FlightAware's complaint.
There is an even more interesting piece of evidence. In its own April 30 comment to the CFTC, Kalshi argued that robust event-contract resolution should include primary sources, secondary sources and fallback procedures that address source-agency failure and revisions. Kalshi further suggested the use of multiple independent Source Agencies so that no single provider becomes a point of failure, and said resolution should be structured around official, audited or widely observed data rather than proprietary or easily manipulated sources.
That principle is difficult to disagree with. FlightAware demonstrates why.
But is BTS really a fallback?
Kalshi's airport cancellation rules state that the contract switches to the U.S. Department of Transportation's Bureau of Transportation Statistics, or BTS, if FlightAware is unavailable or does not publish a usable figure.
The problem is that BTS is not a real-time flight-status service. Its Airline On-Time Performance database is a monthly dataset based on reports submitted by covered U.S. carriers. BTS says summary statistics and raw data are released with the monthly Air Travel Consumer Report, generally around 30 days after the end of the relevant month. More importantly, as of August 12, its public TranStats database contains data only through May 2026.
Kalshi's AIRPORTDELAY rules state that a contract must expire no later than one week after the end of the measurement period, with settlement normally occurring no later than the following day. The timing mismatch between contract settlement and public BTS data release creates doubts about how the contract will be settled.
How is this different from traditional futures?
Reliance on an outside source for settlement is not new to derivatives markets. Traditional commodity futures have done this for decades. A number of cash-settled contracts settle against price assessments produced by S&P Global Platts rather than against a price generated by the exchange itself. CME's FOB Santos Soybeans Financially Settled (Platts) Futures provides an example. The contract's final settlement is calculated using Platts price assessments, and the rulebook expressly states that the "Platts" trademarks have been licensed for use by CBOT.
This is an important distinction. Platts is a private, commercial data provider, just like FlightAware. Its assessments are not necessarily freely available to every market participant. But Platts is also explicitly in the business of producing benchmarks that financial and physical contracts can reference. S&P Global says Platts benchmarks underpin nearly 1,300 exchange-traded, cash-settled commodity futures contracts, and it maintains a dedicated function for licensing and exchange relationships.
The benchmark itself is also surrounded by an institutional framework designed for this purpose. Platts publishes detailed methodologies explaining how assessments are constructed, maintains procedures for identifying anomalous data and handling methodology changes, and reviews its methodologies at least annually.
In the case of event contracts, the organization in the middle may never have designed its product to serve as a financial benchmark. Its primary business may have little to do with derivatives markets, and it may never have agreed to assume the responsibilities that come with determining the payout of a financial contract. As event contracts become larger and more economically significant, merely identifying who reports the answer may no longer be enough. Exchanges may increasingly need to ask whether that organization has actually agreed to become part of the machinery that determines who gets paid.
Disclaimer: The content is for informational purposes only. You should not construe any such information or other material as legal, tax, investment, financial, or other advice. Nothing contained in this article constitutes a solicitation, recommendation, endorsement, or offer by the author(s) or any third party service provider to buy or sell any securities or other financial instruments in your or in any other jurisdiction in which such solicitation or offer would be unlawful under the securities laws of such jurisdiction. The author(s) report(s) no conflict of interest.
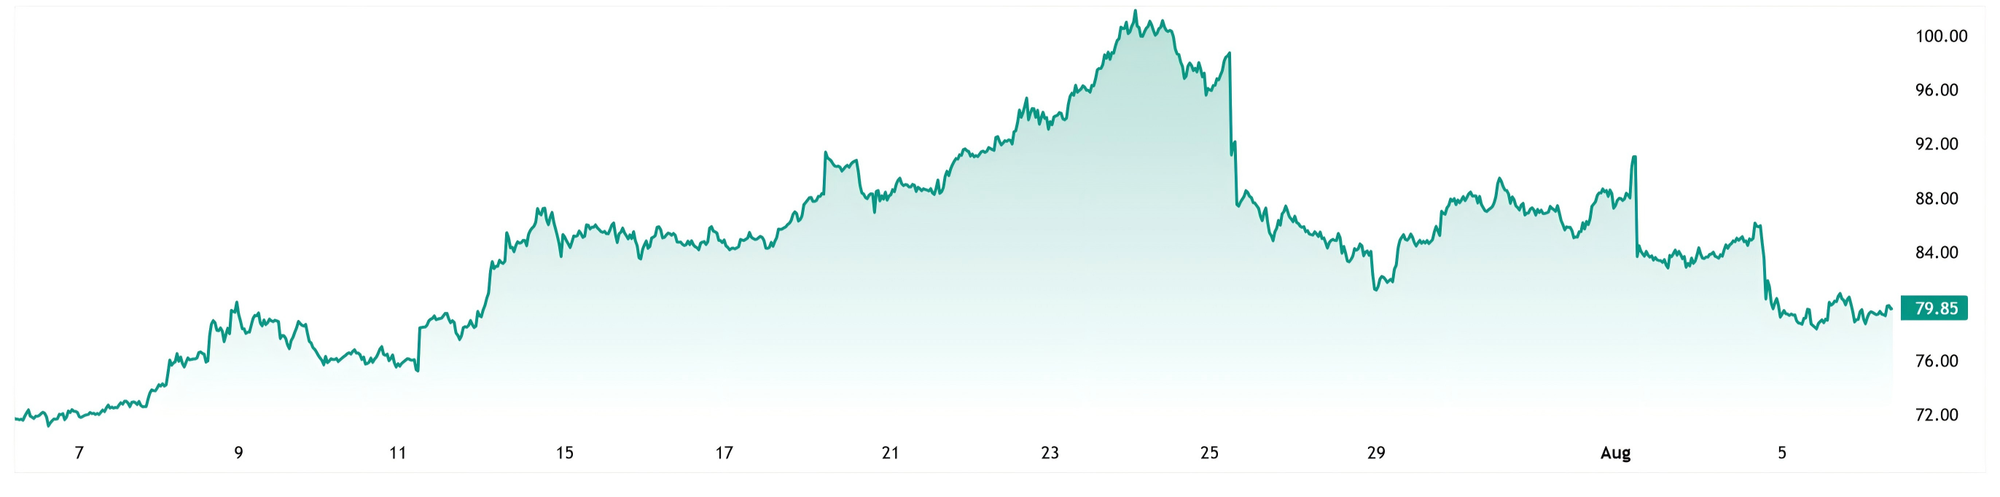
October Brent settled at $87.93 on July 31 and fell to $79.36 a barrel by August 4—a 9.7% decline—after Washington called off planned strikes and signaled that a deal with Tehran was close. By August 12, it had recovered to $88.98, slightly above where the comparable October contract started, after gaining 5% on August 10 alone as those diplomatic prospects faded again.
Kpler counted eight ships making the crossing through the Strait on August 11. The pre-war average was 130 to 140 a day. Whatever pushed Brent through this roughly ten-dollar round trip, it wasn’t a change in how much oil is actually leaving the Gulf, and according to EIA and IEA, this isn’t about to change once the diplomacy resolves either.
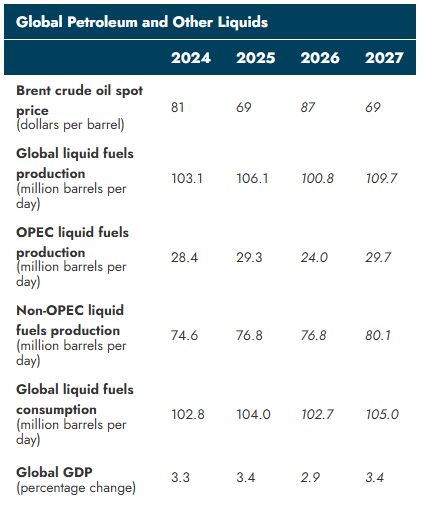
On Tuesday, the EIA put average global output near 100.8 million bpd against demand of about 102.7 million, with 600,000 bpd of Middle Eastern production expected to stay shut through 2027. The IEA followed a day later, cutting its 2026 forecast to 102 million bpd, a 4.3 million-bpd decline and sharper than the 3.7 million-bpd drop it saw a month ago.
Reopen the Strait, runs the logic, and the barrels come back quickly. Still, reopening Hormuz doesn’t equal restoring every shut-in field, terminal, and refinery.
The volatility suggests traders are repeatedly repricing between two paths: a rapid diplomatic reopening and a prolonged physical disruption.
Next Hormuz ceasefire headline hits. What does Brent do?
Drops hard and stays downResult
17.44%
Drops, then claws most of it back; like Aug 4-10Result
11.74%
Barely moves, it’s already priced inResult
39.86%
Rises; sell the newsResult
30.96%
281 Polls
EndedTBD
Reopening is not recovery
EIA’s own numbers, supply and demand from the same report, put the 2026 deficit at 1.9 million bpd. This gap already assumes Hormuz traffic begins recovering in September. A faster reopening would narrow it, but not erase it overnight: EIA still expects shut-in fields and damaged export infrastructure to return in stages into 2027.
EIA August 2026 STEO: A 1.9 million-bpd deficit in 2026 gives way to an implied 4.7 million-bpd surplus in 2027. Data are annual averages for total liquid fuels.
In July, on the strength of the June 18 memorandum of understanding between Washington and Tehran, the EIA assumed most shut-in crude would return to near pre-conflict levels by year-end, with the bulk of the rest clearing by the first quarter of 2027.
The July STEO, released on July 7 and based on the June 18 memorandum, was overtaken almost immediately as hostilities resumed. By August, the EIA expected about 600,000 bpd to remain disrupted through the end of 2027, even after most regional production and trade recovered earlier that year.
Hostilities resumed in early July, the Strait effectively closed again, and the August STEO pushed a chunk of that production offline through the end of 2027 regardless.
The IEA’s own forecast moved on the same timeline, milder in July and cut hard again this week, as the numbers above show.
The physical market is already tight
Brent’s prompt spread flipped back into backwardation in July, per the IEA’s own report, after North Sea Dated jumped $25.67 on the month to close near $97 and trade around $92 as of this writing.
Global observed inventories plunged 69 million barrels in July alone. Total stocks are down 410 million barrels, or 2.7 million bpd on average, since the war started in February. The Strategic Petroleum Reserve, at 298.7 million barrels, is sitting at a four-decade low.
This unwinds when barrels physically show up, but Gulf infrastructure hit since February doesn’t repair itself on a diplomatic timeline.
The bear case isn’t wrong, just early
Both agencies’ own 2027 numbers point to a glut, not a deficit, once the region does recover.
The IEA expects global supply to rebound by 8.3 million bpd to 110.3 million bpd in 2027, while demand grows by 2.4 million bpd. That produces a projected surplus of approximately 4.6 million bpd—conditional on de-escalation and the restoration of Gulf production. The EIA’s 2027 Brent forecast of roughly $69 reflects its expectation that supply will recover and inventories will rebuild.
Put simply, the deficit belongs to the near term. The real risk isn’t that Brent falls when Hormuz reopens. It’s that it falls too fast, before the barrels that take until 2027 to come back have actually come back.
Here’s what to watch next
The thesis holds if September’s STEO still shows at least 4 million bpd shut in during the fourth quarter, Gulf exports remain below 18 million bpd, observed stocks stay under 7.9 billion barrels and prompt Brent keeps at least a $1 premium over the next month.
It breaks if Gulf exports top 20 million bpd for four straight weeks, the EIA cuts fourth-quarter shut-ins below 2 million and inventories build by at least 30 million barrels. Five sessions of prompt Brent trading at a 25-cent discount would settle it.
One counter-signal arrived on August 12: U.S. commercial crude inventories rose 17.4 million barrels, driven largely by unusual import and export flows. One U.S. reporting week does not reverse the IEA’s global stock draw, but it complicates a purely one-directional tightness narrative.
As we argued in June, reopening Hormuz is a sequence rather than a switch. The August forecasts now put numbers on that delay.
The freshly dropped Consumer Price Index print delivered a collective sigh of relief across trading desks, with an inflation reading that was both fairly benign and free of a nasty surprise.
Headline CPI rose 0.1% in July, after falling 0.4% in June. Core CPI, which strips out food and energy, rose 0.2%, after sitting flat the month before. Both numbers landed exactly on the consensus forecast, the kind of nothing-happened print traders haven't gotten much of this year.
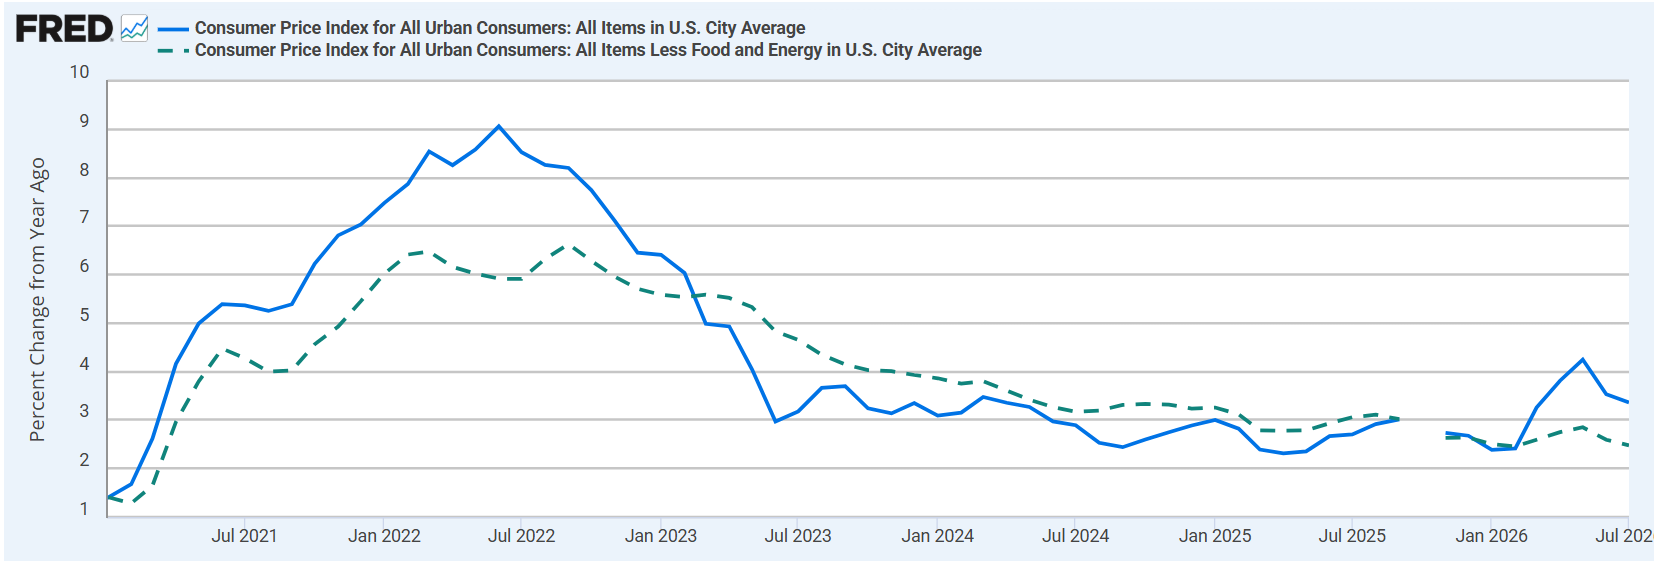
Year over year, headline inflation eased from 3.5% to 3.4%. Core slowed from 2.6% to 2.5%.
This makes it a mildly dovish report. For anyone trading a few weeks out, the data made it more difficult to justify an immediate September rate increase.
Where do you think September lands?
No change, the CPI print settles itResult
38.85%
25bp hike, three hawkish dissents still matterResult
29.86%
25bp cut, the labor data is the real signalResult
11.51%
Too close to call before more data landsResult
19.78%
278 Polls
EndedTBD
The details were soft, but not uniformly so
Shelter made the largest positive contribution to the monthly increase, even though the shelter index rose only 0.1%. And accounted for roughly two-thirds of the increase in the overall index. Within shelter, rent and owners’ equivalent rent each rose 0.3%, while lodging away from home fell sharply.
Energy prices declined 1.5%, led by a 2.9% fall in gasoline. Food rose a modest 0.1%, with grocery prices falling slightly even as food away from home continued to rise.
The report was not uniformly soft. Medical care rose 0.4%, airline fares jumped 2.2%, and used-car prices increased 0.4%. Core goods also showed some renewed upward pressure. Still, these pockets were not broad or powerful enough to flip the overall report hawkish.
The most important message from the Bureau of Labor Statistics release is that underlying inflation continued to cool on a year-over-year basis, although monthly core inflation increased from zero in June to 0.2% in July. And energy prices remained 14.7% higher than a year earlier.
Does a soft jobs report cancel out three hawkish votes?
Not entirely. This is the short answer, and it's why September is no longer a foregone conclusion although a hold remains the more likely outcome.
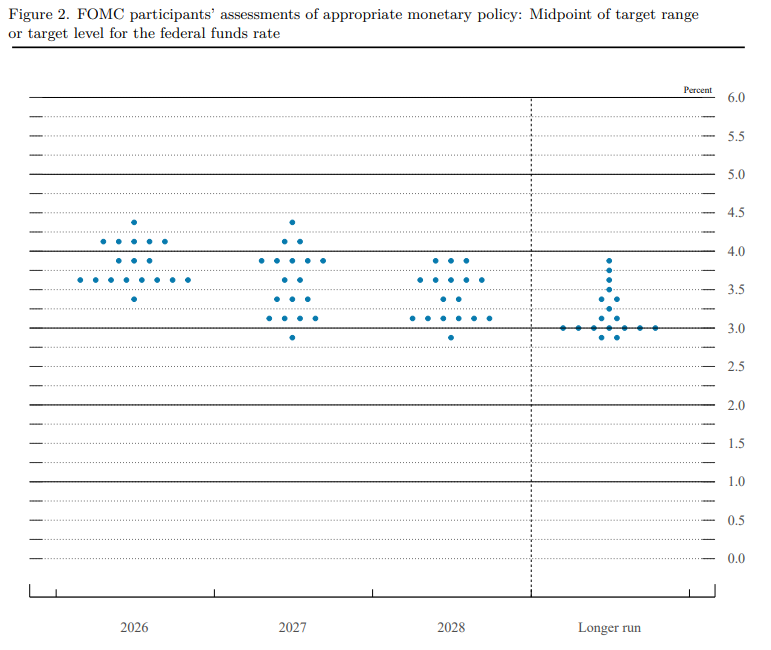
The Federal Reserve’s target range is currently 3.50%-3.75%. At its July meeting, the FOMC voted 9-3 to hold rates steady, and all three dissents wanted a hike.
This is a genuine hawkish bloc, not merely tough rhetoric, and it explains why a September hike still carries meaningful probability even after a friendly CPI report.
But the economic evidence since that meeting has weakened the case for tightening. Payrolls fell by an estimated 23,000 in July, and the two months before that turned out weaker than first reported, by a combined 103,000. Wages are still climbing at a 3.2% annual pace, and fewer people are participating in the labor force than were in January.
None of this proves the three dissenters were wrong in July, but it does mean that raising rates again in September would mean tightening into a labor market that's visibly losing altitude, a much harder case to make than it was a month ago.
Put together, inflation still runs hot enough to keep three voting FOMC members uncomfortable, and the labor market's soft enough to make expanding a three-member dissent into a majority for a hike a much tougher sell. Both things are true at once.
Fed funds futures implied roughly a 38%–40% probability of a September hike after the CPI release. My own working distribution is similar: about 65% for no change, 35% for a 25-basis-point hike, and only a negligible probability of a cut.
Where the 65/35 split might be leaning on the wrong question
Does a hold in September mean the meeting would be dovish? Not necessarily.
September comes with fresh economic projections. The Fed could leave rates unchanged while delivering a hawkish message through the statement, the dot plot and the press conference. Financial conditions could therefore tighten even if the target range does not change.
This creates a useful distinction between the settlement outcome and the macro outcome. A hold can win the bet and lose the trade.
Second, the benign July headline depended partly on falling gasoline prices. Energy is still up sharply over the past year, and renewed geopolitical pressure on oil could reverse this contribution in August. The Fed is more likely to look through a temporary energy shock than a broad demand-driven acceleration, but it will care if energy begins feeding into transportation, goods, services or inflation expectations.
The largest repricing may therefore come after one of the intermediate releases produces an outsized change in September expectations, rather than from the immediate CPI reaction.
The bottom line
July CPI was helpful to the doves but it was not an all-clear. The Fed’s preferred PCE index remained well above its 2% objective in June, three voting FOMC members supported a July hike, and another employment and inflation cycle will arrive before the September decision.
For the next few weeks, the better posture is to treat September as a live two-way market and update probabilities as the evidence arrives.
Incoming evidence
Likely September repricing
Core PCE at or below 0.2%,
weak payrolls, and August core CPI at or below 0.2%
The probability of a hold
could rise toward 75%-85%.
Mixed data, with core
inflation around 0.2%-0.3%
A hold likely remains
favored in roughly the 55%-70% range.
Core PCE or CPI at or
above 0.3%, stronger employment, or a renewed energy shock
A 25-basis-point hike
could become the favorite.
Very weak employment
combined with soft inflation
A hold remains the base
case; a cut becomes a non-zero tail risk, but probably not the central
outcome.
The principal dates are July PCE on August 26, the August employment report on September 4, August PPI on September 10, August CPI on September 11, and the FOMC decision on September 16.
Which release is most likely to move this before September 16?
Introduction: The End of the "Peace Dividend" and the Dawn of the Super-Cycle
The secular pivot in European defense is no longer a theoretical commitment; it is a structural reallocation of capital. For institutional investors, defense has completed a radical repricing, transitioning from an ESG outcast to a sovereign safe-haven asset. Following decades of post-Cold War atrophy—where spending collapsed from historical highs above 3% of GDP according to Funcas—the base-effect acceleration is now indisputable. Official data from the European Commission highlights that the bloc's combined defense budget expanded to €350 billion in 2024, establishing the institutional foundation for permanent military readiness, accelerated by the structural pivot of US strategic priorities away from the European theater. Confirming this immediate momentum, NATO's 2026 report documents a 19.6% real-term spending surge in 2025, pushing the average allocation across European Allies and Canada to 2.33% of GDP. This marks the definitive end of the peace dividend and the onset of an unprecedented multi-decade capital allocation super-cycle.
I. The Demand Shock: From Political Constraint to Structural Budgetary Rule
For institutional investors, the defense super-cycle represents a regime change driven by captive demand and multi-year revenue visibility, strictly decoupled from the civilian macroeconomic cycle. The catalyst is political: an EPRS report reveals that between 2022 and 2023, 78% of EU defense acquisitions were sourced outside the bloc. This capital flight forced a protectionist pivot, systematically locking public procurement within the European Defense Technological and Industrial Base (EDTIB).
Consequently, the budgetary execution is staggering. European Defence Agency (EDA) projections forecast a total defense budget of €454 billion for 2026, reaching 2.4% of GDP. Crucially, this is a hardware-driven Capex super-cycle. The EDA confirms €163 billion will be allocated strictly to equipment and investments in 2026, an explosive 158.7% increase compared to 2021. This permanently transforms European prime contractors into cycle-immune assets with guaranteed income.
II. Capacity Bottlenecks: Historical Book-to-Bills and Supply Rigidity
For institutional investors, the defense sector paradigm has decisively shifted from demand generation to execution risk. A massive influx of public capital is currently colliding with profound supply rigidity, exacerbated by a critical dependency on imported raw materials. The ReArm White Paper explicitly warns that the European supply chain is heavily constrained by slow production capacities and structural fragmentation, making industrial scale-up a critical operational challenge.
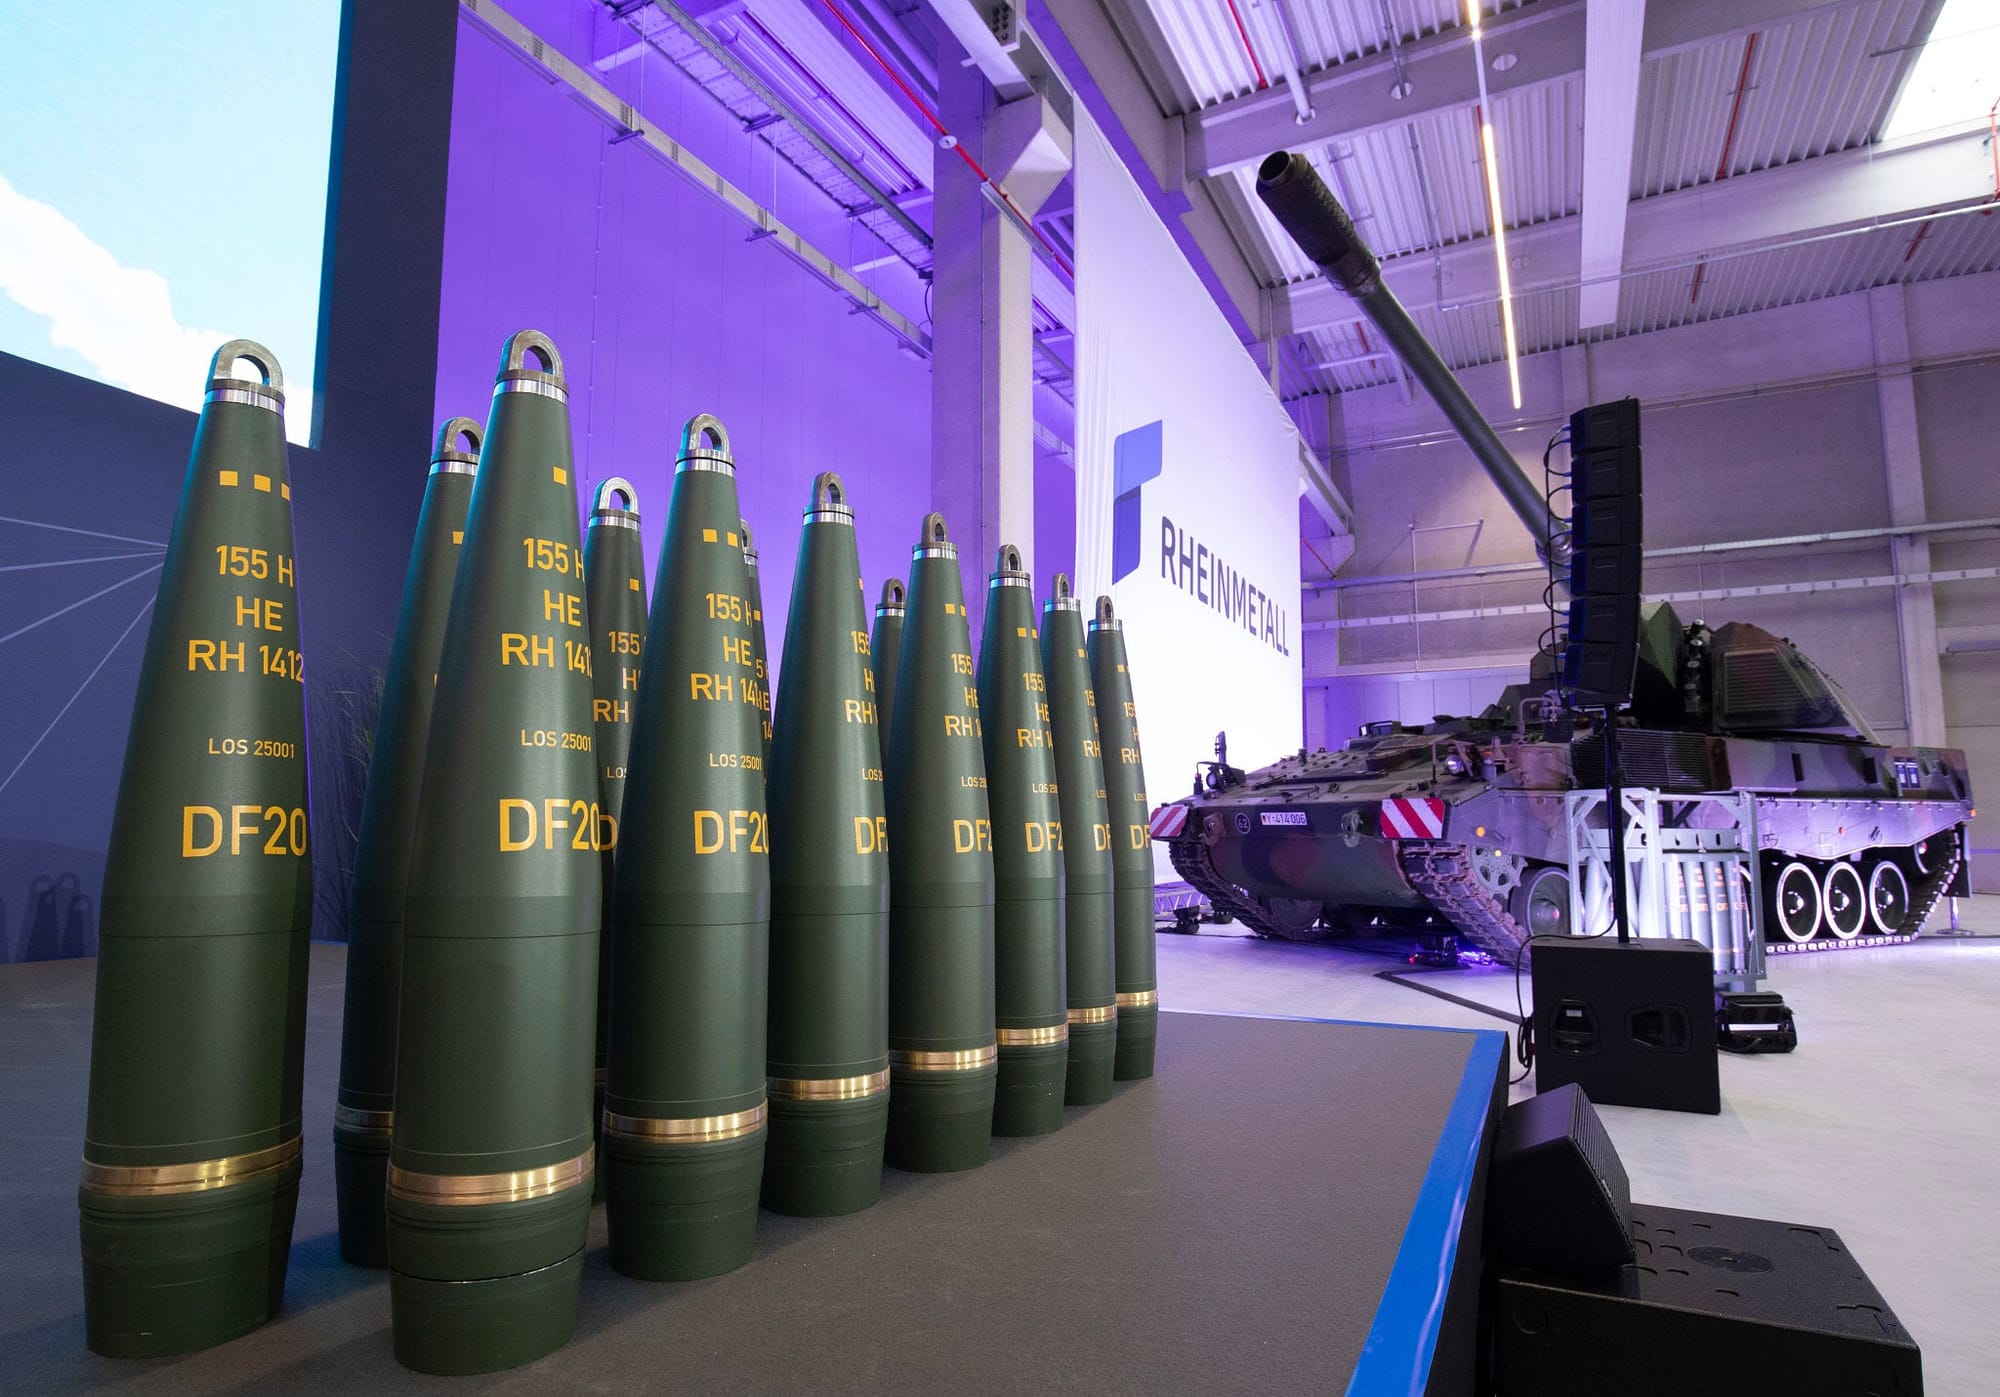
This severe inelasticity of supply is mathematically proven by recent corporate earnings, as prime contractors book contracts at an unsustainable velocity relative to their billing capabilities. Rheinmetall perfectly exemplifies this capacity saturation, reporting a record backlog of €63.8 billion, which represents a 36% year-over-year explosion. Concurrently, the firm maintained strong pricing power, achieving an exceptional 18.5% operating margin. Similarly, Thales recorded a massive €25.26 billion in order intake, aggressively driving its total backlog above the €50 billion threshold.
In light of the severe capacity bottlenecks across the European defense sector, what is your primary equity allocation strategy for H2 2026?
Strict Stock-Picking (Alpha). We are exclusively targeting Prime Contractors with proven delivery capabilities and resilient supply chains.Result
0.00%
Broad Sector Exposure (Beta). We are maintaining passive/ETF allocation to capture the aggregate €454bn institutional budget surge, regardless of short-term execution delays.Result
100.00%
1 Polls
EndedTBD
III. The Sovereign Equation: Fiscal Space, Crowding-Out, and the Defense Eurobonds Bet
Financing the NATO defense mandates purely through national balance sheets is fracturing the eurozone. As Reuters highlights, sovereign heavyweights like France, Italy, and the UK face immediate budgetary strain, proving that isolated funding models are structurally exhausted.
This fiscal exhaustion triggers severe macro-financial risks. IMF Working Paper 26/53 (Furceri et al.) demonstrates that defense fiscal multipliers are highly asymmetric: while reaching 1.9 under optimal conditions, this efficacy collapses in high-spread environments. If heavily indebted peripheral states issue uncoordinated debt, skyrocketing borrowing costs will crowd out private investment and crush economic growth. Furthermore, market participants cannot simply rely on the European Central Bank’s Transmission Protection Instrument (TPI) to endlessly absorb defense-driven deficits without unanchoring inflation expectations.
Mutualization is therefore a mathematical necessity for yield curve stability. BBVA Research validates that the €150 billion SAFE instrument is vital to bypass the lethal "snowball effect" that compresses fiscal space. To protect peripheral issuers and prevent fatal spread widening across the continent, Defense Eurobonds remain an absolute necessity.
With European national deficits widening under the weight of accelerated rearmament, how are you pricing the eurozone sovereign risk?
Pricing in Fiscal Slippage. We are actively hedging against peripheral debt (e.g., Short BTP/OAT or Long Bunds), expecting national balance sheets to fracture under the defense burden.Result
0.00%
Betting on Mutualization. We are remaining neutral on spreads, anticipating the inevitable political consensus for EU-backed "Defense Eurobonds" to absorb the shock.Result
0.00%
0 Polls
EndedTBD
Conclusion: The Binary Allocation Hour
The era of broad-brush defense exposure is dead. As Morgan Stanley’s June 2026 downgrade from "Overweight" to "Equal Weight" signaled, buying sector Beta no longer works amidst stretched valuations and fading momentum. The market has returned to raw fundamentals: Reuters’ Q2 2026 earnings reporting underscores that top-line narratives are over, and bottom-line execution is king. Investors must pivot to strict stock-picking (Alpha), targeting only high-conviction executors capable of converting backlogs into cash.
This execution mandate collides directly with BlackRock’s 2026 Midyear Outlook framework on the twin scarcity of materials and capital. Supply chain bottlenecks strangle unequipped contractors, while soaring debt issuance puts immense upward pressure on yields.
Our ultimate portfolio directive is binary: go long ultra-selective defense equities that master execution, while shorting or underweighting vulnerable European sovereign bonds as a hedge against fiscal slippage and unmutualized debt strain. Capital demands real delivery—position the desk where cash is collected, not spent.
References
I. Institutional & Policy Frameworks
BlackRock Investment Institute (2026). Mid-Year 2026 Global Outlook: Scarcity vs. Abundance (The Sovereign Cost of Security).
Consilium of the European Union & European Defence Agency (2026). EU Defence in Numbers.
European Commission (2024). European Defence Industrial Strategy (EDIS). Brussels.
European Commission (2025). White Paper on the Future of European Defense (ReArm Europe Plan).
European Parliamentary Research Service - EPRS (2024). Improving the quality of European defence spending. Briefing.
Funcas Intelligence (2025). EU defense spending and trade outlook. Policy Paper.
North Atlantic Treaty Organization - NATO (2026). Annual Report 2025–2026, presented by Secretary General Mark Rutte.
II. Economic Research & Sovereign Analysis
BBVA Research (2025). EU Priorities: Defence Spending & Multipliers. Economic Watch.
International Monetary Fund - IMF (2026). Furceri et al., Working Paper Vol. 2026, Issue 053: Macroeconomic Impacts of EU Defense Spending.
III. Corporate Disclosures & Market Intelligence
Morgan Stanley Research (June 2026). European Defense Shares Retreat Following Morgan Stanley Sector Downgrade. Equity Research Note.
Rheinmetall AG (March 2026). Financial Report: FY 2025 Results. Düsseldorf.
Reuters (Spring/Summer 2026). Analysis: NATO defence push already strains Europe's budgets & European corporate outlook continues to improve as earnings season gathers steam.
Thales Group (March 2026). Full-Year 2025 Financial Results. Paris.
The macroeconomic paradigm within the eurozone has structurally inverted. While the traditional Franco-German core faces industrial stagnation—with 2026 GDP growth forecasts capped at 0.8% and 0.9% respectively—Southern Europe is now driving regional expansion. Spain (2.1%), Portugal (2.0%), and Greece (1.8%) are demonstrating genuine volume expansion, net of price effects. This "Mediterranean Pivot" is forcing institutional investors to aggressively reassess their continental asset allocation.
The NGEU Liquidity Shield and Zero-Cost CapEx
This structural decoupling is insulated by the NextGenerationEU (NGEU) framework, which acts as a sovereign equity injection. In a restrictive monetary environment where European Central Bank (ECB) tightening typically triggers a crowding-out effect, NGEU grants bypass bond markets entirely. Spain’s €79.85 billion in non-repayable subsidies and Greece’s massive €35.95 billion allocation (15.96% of GDP) absorb initial CapEx risks for green and digital infrastructure, allowing private capital to co-invest at a zero-cost public financing basis. Italy’s €194.38 billion PNRR, while experiencing execution friction, remains the continent's largest modernization deployment, specifically targeting Industry 4.0.
Energy Arbitrage and Margin Expansion
The primary driver of inbound Foreign Direct Investment (FDI) into the Iberian Peninsula is now structural OPEX predictability, driven by an aggressive energy transition. Spain has crossed the threshold of 57.5% renewable electricity generation, with zero-marginal-cost wind and solar constituting over 41% of the mix. This translates to severe wholesale price deflation: the Iberian OMIE market cleared between €40 and €55/MWh in 2024–2025, compared to Germany’s €75–€90/MWh, which remains burdened by a fossil-heavy grid. This energy competitiveness spread justifies the strategic relocation of heavy industry. Capital flows reflect this arbitrage, with entities like Cepsa deploying €7 billion into green hydrogen in Andalusia, and Asian OEMs (CATL/Stellantis) executing €4.1 billion greenfield battery projects in Zaragoza. Energy sovereignty has fundamentally evolved from an ESG metric into a core catalyst for EBITDA margin expansion.
Labor Cost Decoupling and Transatlantic Capital Capture
This energy dividend is compounded by sustained wage competitiveness and optimized fiscal engineering. Eurostat’s 2025 estimates highlight a stark labor cost spread: Germany approaches €45.00 per hour, while Spain (€26.40), Italy (€32.00), and Portugal (€19.40) offer highly attractive cost-to-skill ratios for engineering and R&D talent. Concurrently, competitive corporate tax frameworks—Greece at 22%, Spain at 25%, and Portugal leveraging deep SIFIDE innovation tax credits—are driving robust capital inflows. In 2023, Spain captured $35.9 billion in FDI, establishing itself as the premier European holding hub for Latin American capital. LatAm FDI into Spain surged by 138% year-over-year to €2.83 billion, pushing the accumulated stock (including ETVE holding structures) to €66.88 billion. Madrid now functions as a highly capitalized, transatlantic corporate gateway, effectively bypassing Northern European financial centers.
Beyond NGEU public subsidies, what is the primary structural driver forcing Northern European industry to aggressively relocate operations to the Mediterranean basin?
The "Energy Arbitrage": Structural OPEX deflation driven by zero-marginal-cost renewables.Result
100.00%
The "Labor Decoupling": A highly competitive cost-to-skill ratio for engineering and manufacturing talent.Result
0.00%
2 Polls
EndedTBD
Nearshoring and Digital Infrastructure
Geopolitical fragmentation and supply chain regionalization are physically reshaping the Mediterranean basin. As industrial players shift from just-in-time to buffer inventory models, Southern ports are absorbing the reallocated trade flows. While Rotterdam contracted by 0.7% in 2024, Valencia surged by 14.15% (5.47 million TEUs), and Piraeus expanded transshipment activity by 17.6%.
Simultaneously, the region is capturing massive digital infrastructure allocations. Driven by hyperscalers seeking available grid capacity and land, Milan is targeting 500 MW of data center capacity by 2026 (Knight Frank), with Microsoft separately committing €4.3 billion to AI and cloud infrastructure in the Milan/Turin area. Greece is following suit, anchoring the undersea cables connecting Europe to Africa and Asia.
Systemic Constraints and Risk Pricing
Despite this alpha-generating environment, institutional allocation requires rigorous risk pricing. The region’s structural headwinds remain severe. Elevated debt-to-GDP ratios—Greece at 149.7%, Italy at 137.8%, and Spain at 103.2%—create persistent vulnerability to sovereign spread widening under the ECB’s monetary normalization. Investors must price in a long-term fiscal risk premium, as heavily leveraged balance sheets limit future public co-investment capacity. Furthermore, a demographic contraction presents an acute supply-side labor shock. With fertility rates critically low (Spain at 1.10, Italy at 1.18) and old-age dependency ratios approaching 40 in Italy (39.0), Portugal (38.6), and Greece (37.4) - (Spain, 31.2), domestic consumption bases are shrinking while scarcity-driven wage inflation looms.
Conclusion: The Selective Institutional Mandate
Southern Europe is no longer a peripheral risk to be hedged, but the continent's primary engine for alpha generation. However, capturing this "Southern Premium" requires a surgical approach. For asset managers, the strategic mandate is strict and binary: overweight export-oriented automation, decarbonized heavy industry, and logistics real estate, while ruthlessly avoiding domestic retail exposure and sovereign debt vulnerability. In 2026, the smart money does not buy the Mediterranean broadly—it buys its infrastructure.
Given the tension between booming industrial growth and elevated debt-to-GDP ratios, what is the correct institutional playbook for the "Mediterranean Pivot"?
Overweight the Infrastructure: Aggressively buy physical real assets (logistics, data centers, green energy) to capture the alpha.Result
0.00%
Underweight the Region: Avoid the exposure entirely due to looming demographic winters and ECB crowding-out risks.Result
0.00%
0 Polls
EndedTBD
Abridged Data Sources & Bibliography:
Macroeconomics & Fiscal Policy: International Monetary Fund (WEO 2026 Projections); European Commission (Recovery and Resilience Scoreboard, Q1 2026).
Energy & Industrial CAPEX: Red Eléctrica de España (2024–2025 data); Ember (European Electricity Review 2024); OMIE / EPEX SPOT.
Labor, Demographics & Sovereign Debt: Eurostat (2025 Estimates on Hourly Labour Costs, Debt/GDP, and Fertility Rates).
Capital Flows (FDI): UNCTAD (World Investment Report 2024); ICEX-Invest in Spain & SEGIB (VI Global LATAM 2024 Report).
Logistics & Digital Infrastructure: Port Authorities (Valencia, Piraeus, Rotterdam 2024 Reports); Knight Frank (Data Centres EMEA Report).
Iran said it had reached an agreement with Oman on a proposed route for shipping through the Strait of Hormuz, a potential step toward a reopening of the critical waterway for energy supplies.
A joint statement from Tehran and Muscat is under review and in the final drafting stage, Iranian Foreign Ministry spokesman Esmail Baghaei said on Wednesday, according to a post on Telegram.
Negotiations between the two countries are “forward-moving” and a deal would be struck “if certain third parties do not obstruct this process,” he said.
Reopening the strait has become US President Donald Trump’s prime goal after more than five months of war with Iran, as he looks to bring down high fuel prices ahead of November’s midterm elections.
Trump said on Tuesday that “a lot of progress has been made” and that a deal could be reached on Wednesday or Thursday.
Oil held losses after Iran announced the agreement, raising the prospect of more energy flows resuming through the strait. Brent traded near $79 a barrel early Thursday, while West Texas Intermediate was around $75 after losing 11% in the week’s first three sessions.
Brent crude oil price in one month. Source: tradingview
Iran’s latest announcement on Hormuz comes after months of deadlock between the US and Tehran over how to conclude the war, with control over shipping through the waterway a particular sticking point. Tehran has demanded that vessels obtain permission to cross and pay fees to transit, and has attacked ships it deems to be in violation.
The US, in turn, has blockaded Iranian ports. The issue led to the collapse of a ceasefire and interim peace agreement last month.
SEOUL, Aug. 5 – A minority shareholder rights group said Wednesday its complaints against the chief executive officers (CEOs) of Samsung Electronics Co. and SK hynix Inc. over the companies' recently signed wage deals have been assigned to a regional police agency south of Seoul, according to Korean news sources quoted.
Will Korean investors' accusation on Samsung & SK Hynix CEOs moves into next material stage by the end of August 2026?
YesResult
27.76%
NoResult
72.24%
796 Polls
EndedTBD
According to the Korean Shareholders’ Movement Headquarters on August 5, the Gyeonggi Nambu Provincial Police Agency assigned the case involving Samsung Electronics CEO Jun Young-hyun and Vice Chairman Roh Tae-moon, accused of breach of trust under the Specific Economic Crimes Aggravated Punishment Act, and the case involving SK Hynix CEO Kwak Noh-jung to its 1st and 2nd investigation divisions, respectively.
The Korean Shareholders’ Movement Headquarters maintains that performance bonuses should not be subject to labor-management collective bargaining but require shareholder meeting approval. They also claim that linking a fixed percentage of operating profits to performance bonuses has potential legal violations.
Separately, the group filed another complaint with the Corruption Investigation Office for High-ranking Officials, accusing Minister of Employment and Labor Kim Young-hoon of abuse of authority, obstruction of exercise of rights, and coercion. Their argument is that the government unduly intervened in the provisional agreement on performance bonuses between Samsung Electronics and its labor union in May.


 Ana Frincu