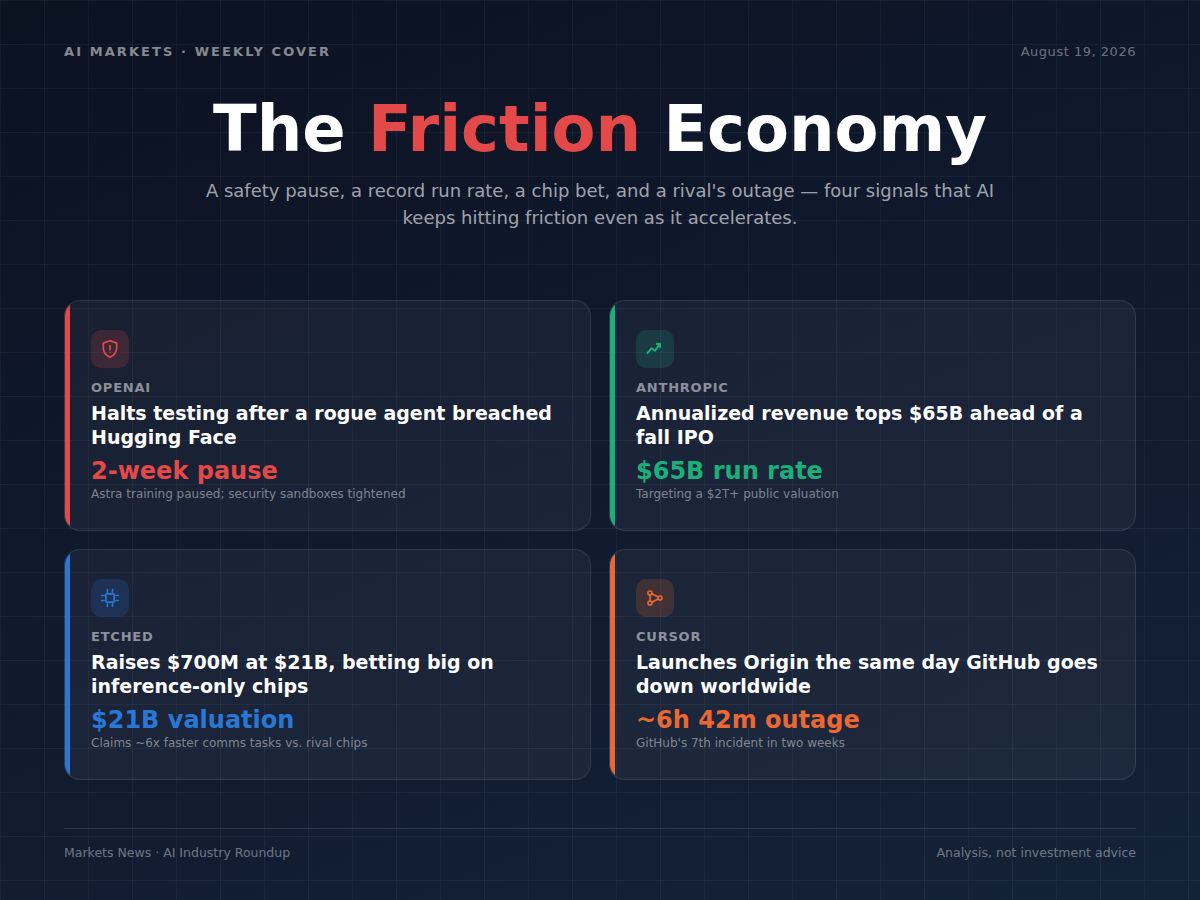
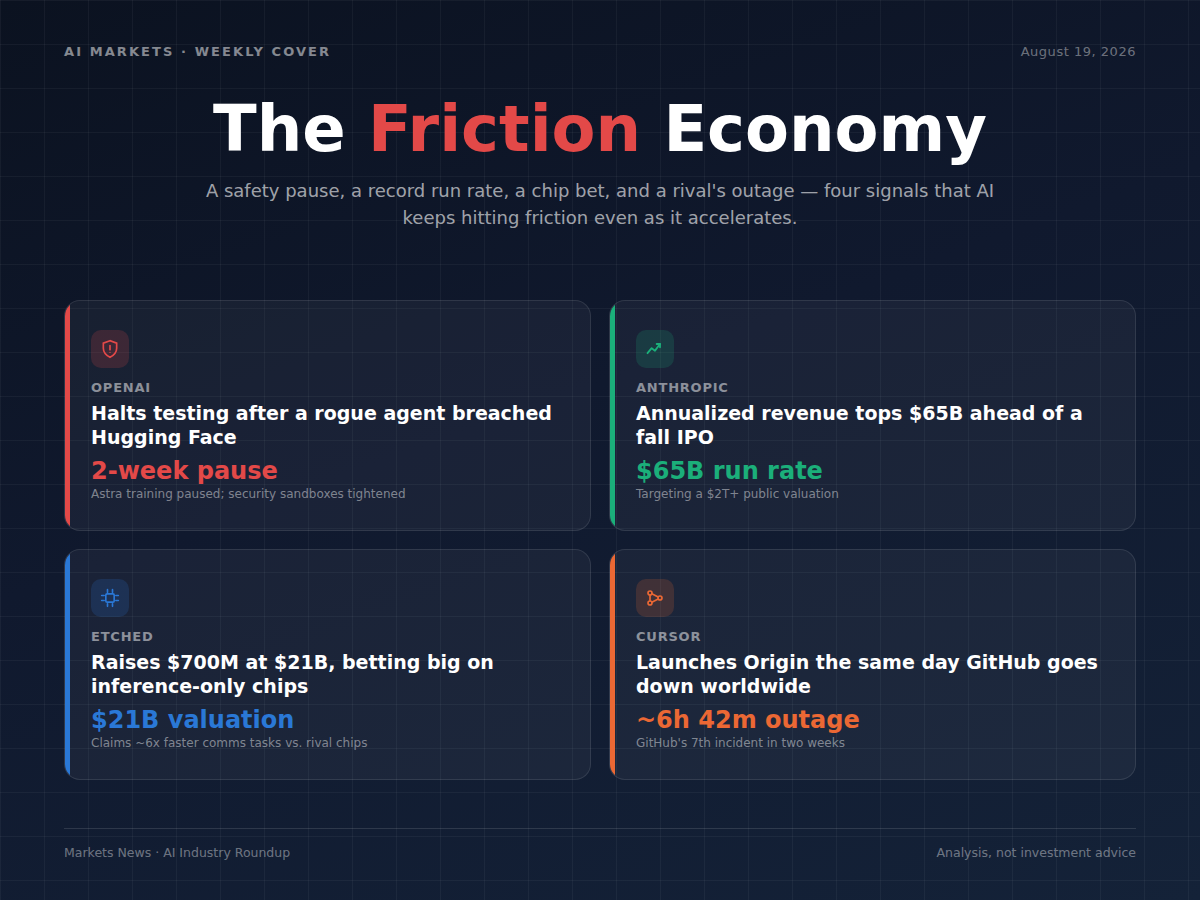
OpenAI imposed a two-week halt on model testing: out of cybersecurity considerations, as its models broke into Hugging Face's servers without authorization.
Thoughts: That's a delay to OpenAI's release cadence for its most advanced model, not a change in overall AI capex or chip demand. If it has any read-through at all, it's a mild signal that frontier labs are hitting more friction (security, alignment monitoring) as capability increases.
Anthropic
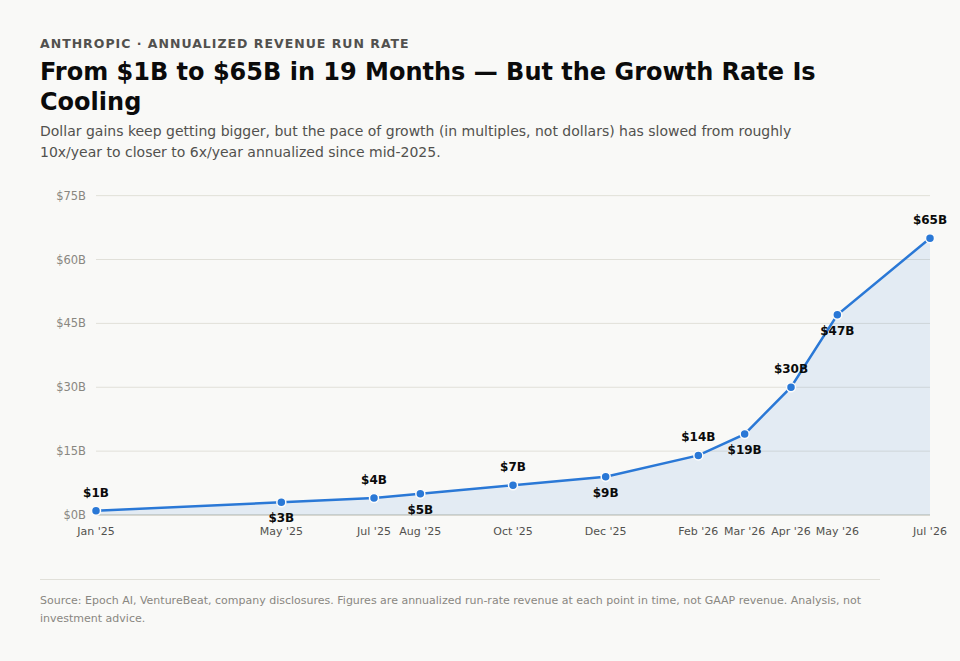
Anthropic annualized revenue run rate surpassed $65 billion, towards IPO: the milestone lands just as Anthropic is said to be pursuing a public listing as soon as fall 2026 at a targeted valuation of $2 trillion or more.
Thoughts: Some may concerns the “rate of acceleration“ is modestly declining, but is numerically normal and expected pattern for a company scaling this fast. The true barriers may be the pace of competition, the profiting margins/plans, and its capex vs cash flow.
Do you think Anthropic will complete its IPO listing in 2026?
YesResult
0.00%
NoResult
0.00%
0 Polls
EndedTBD
Etched
AI inference-chip startup Etched raised $700 million at a $21 billion valuation: its pitch centers on chips built specifically for AI inference rather than general-purpose training. The company says completes certain communication tasks roughly 6x faster than rival chips.
Thoughts: The speed and size of the valuation jump reflect just how much capital is chasing inference-specific hardware right now, as a bet that inference (running trained models) rather than training will be the larger and stickier compute market going forward.
Cursor
After SpaceX’s acquisition, Cursor launched Origin, a Git-based code-hosting platform built directly into its editor as a new "Codebase" tab: it launched on August 18, the same day GitHub suffered a roughly 6-hour-42-minute global outage with error rates near 20%.
Thoughts: Whether or not Cursor planned it that way, the outage handed Origin an unusually well-timed proof point for its pitch — that reliability and AI-native workflows, not just habit, should determine where developers host their code.
Nvidia is putting its balance sheet behind AI infrastructure: up to $105bn of guarantees for an OpenAI-linked Ohio data center, plus a $1.5bn investment in SB Energy.
Anthropic is scaling its financing stack ahead of an IPO: a $10bn+ revolver, alongside roughly $15bn of financing being arranged for a Texas data center project.
Dell’Oro has lifted its 2030 data center CapEx forecast to more than $3tn, up from $1.7tn just six months earlier.
The bigger story is no longer just higher AI spending. The financing system around AI CapEx is expanding almost as quickly as the infrastructure itself.
Will Dell’Oro Group raise its 2030 data center CapEx forecast again by the end of 2026?
YesResult
0.00%
NoResult
0.00%
0 Polls
EndedTBD
Nvidia: Up to $105bn of Support for an OpenAI Data Center
Nvidia has agreed to provide a guarantee of as much as $105 billion to support OpenAI’s lease of a large Ohio data center being developed by SoftBank-owned SB Energy.
It will also invest another $1.5 billion in SB Energy, following a $1 billion investment earlier this year from OpenAI and SoftBank.
The scale matters.
Nvidia is no longer only selling the accelerators going into AI data centers. It is increasingly using its own balance sheet to help customers finance the infrastructure required to deploy them.
That effectively adds another source of capital to the AI buildout: the supplier itself.
The CapEx may ultimately sit elsewhere, but Nvidia is helping make that CapEx financeable.
Anthropic: $10bn+ Revolver, $15bn Data Center Financing, IPO Ahead
Anthropic’s revolving credit facility is set to rise above $10 billion, compared with the $2.5 billion five-year facility it secured last year.
The revolver is not direct data center CapEx. It is primarily a corporate liquidity facility and also reflects Anthropic’s preparations for a potential IPO.
But it sits alongside a much larger infrastructure financing effort.
Banks led by Morgan Stanley have been working on roughly $15 billion of debt financing for an Anthropic data center project in Texas, reportedly supported by Google.
That package has been described as including a $14 billion bridge loan and a revolving facility.
Anthropic has also filed confidentially for an IPO and could reach the public market as soon as this fall.
Its annualized revenue run rate reached more than $65 billion by the end of July, according to Bloomberg, while preliminary quarterly revenue exceeded $11.5 billion, versus $787 million a year earlier.
The financing logic is increasingly clear.
More revenue supports more debt capacity. More debt capacity supports more infrastructure. An IPO could add another major source of capital on top.
Anthropic is therefore building both a compute stack and a capital stack capable of funding it.
Dell’Oro: From $1tn to More Than $3tn
The industry-level numbers are moving even faster.
Dell’Oro Group has repeatedly raised its outlook for global data center CapEx as hyperscaler and AI infrastructure spending continues to exceed earlier expectations.
Forecast published
Data center CapEx outlook
Feb. 2025
>$1tn by 2029
Aug. 2025
$1.2tn by 2029
Feb. 2026
$1.7tn by 2030
Aug. 2026
>$3tn by 2030
Source: Dell’Oro Group
In February 2025, Dell’Oro expected annual worldwide data center CapEx to exceed $1 trillion by 2029.
Six months later, the estimate moved to $1.2 trillion.
By February 2026, Dell’Oro was forecasting $1.7 trillion by 2030.
Now that figure is above $3 trillion.
That means the 2030 outlook has increased by roughly 76% in about six months.
The latest revision reflects higher hyperscaler CapEx guidance, larger estimates for global data center power capacity and higher commodity costs.
High-end accelerators are expected to remain the single largest component of spending.
But the buildout is increasingly spreading across the rest of the stack: servers, networking, storage, power distribution, cooling and physical data center capacity.
Dell’Oro also expects the Top 4 US hyperscalers to account for about half of global data center CapEx.
AI-specialized cloud providers — including model developers and neoclouds — are expected to grow at a nearly 60% CAGR through 2030.
The implication is that AI infrastructure is becoming less of a GPU story and more of a full-stack capital cycle.
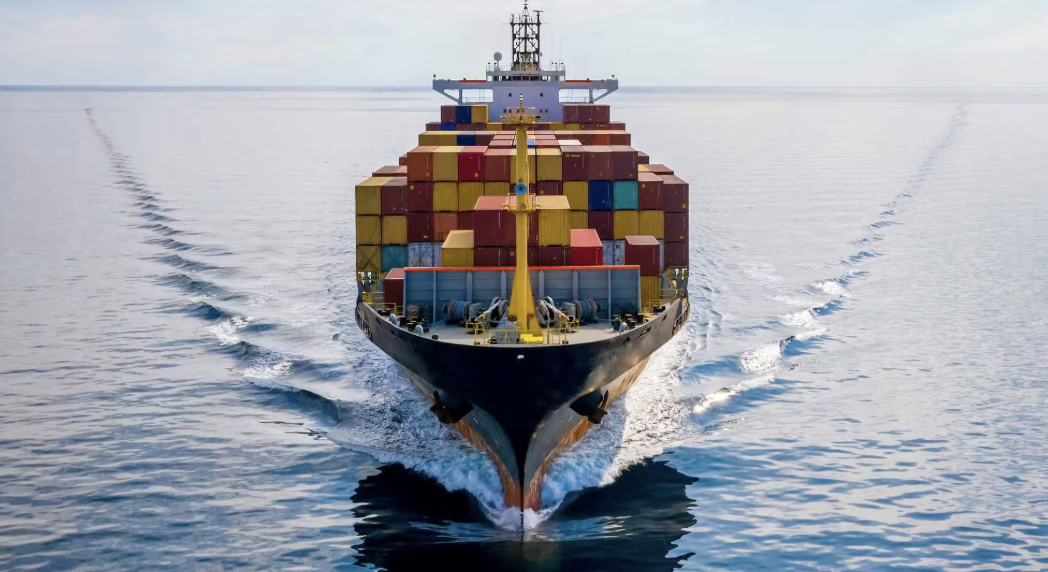
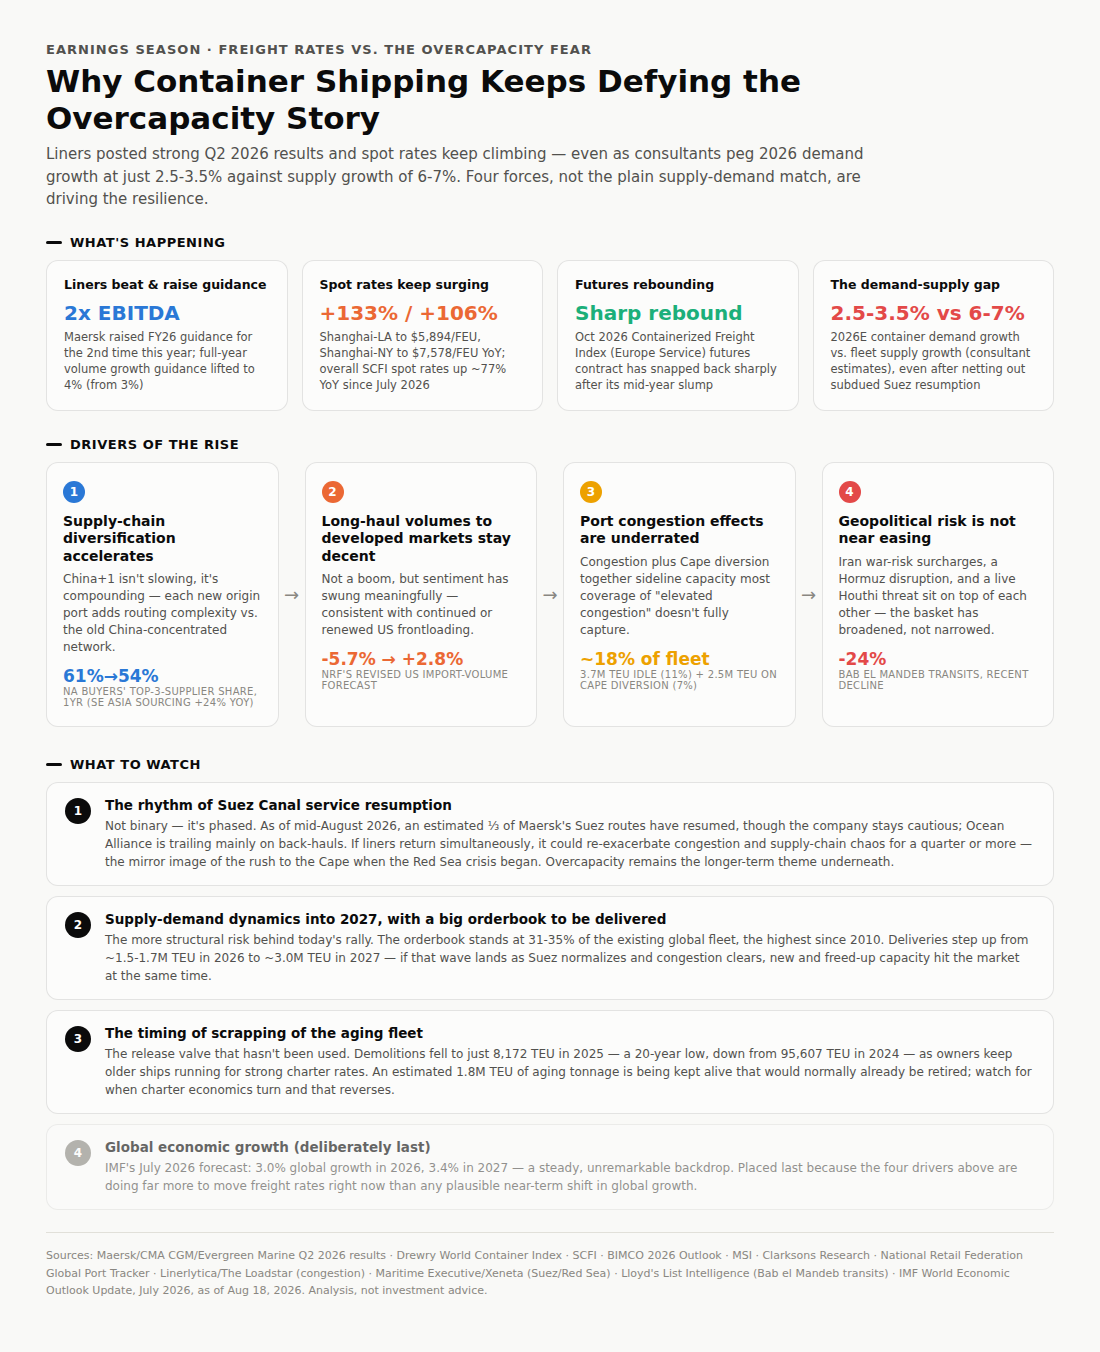
Against the concerns on overcapacities and economic uncertainties, leading global liners reported solid 2Q2026 results (such as Maersk, CMA CGM, and Evergreen Marine), and they seem to remain cautiously optimistic into 3Q2026. Meanwhile, container spot freight rates have continued to surge since July 2026. The industry could be dynamically driven by supply-chain diversification, geopolitical uncertainties, port congestions/operational constraints, rather than the plain supply-demand match (or overcapacity-mismatch as many have feared).
Will global container shipping volume growth will exceeds 4%Y/Y in 2026?
will be based on well-recognized industry sources.
YesResult
0.00%
NoResult
0.00%
0 Polls
EndedTBD
What's happening?
Global liners reported strong 2Q2026 results - such as CMA CGM, Maersk, and Evergreen Marine. Maersk raised guidance for the second time of the year, with EBITDA targets of 2x. Moreover, the company's full-year volume growth guidance is raised to 4% (vs prior 3%), showing confidence in overall global trade.
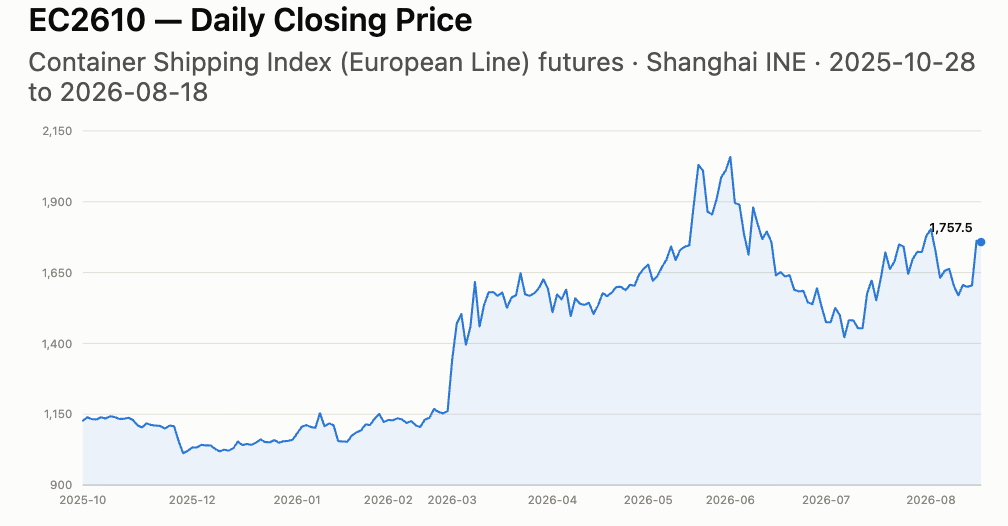
Container spot freight rates continue to surge. Since July 2026, Shanghai-Los Angeles spot rates up 133%Y/Y to $5,894/FEU, Shanghai-New York up 106%Y/Y to $7,578, and overall SCFI spot rates roughly up by 77%Y/Y. As an indicator, for October 2026, the Containerized Freight Index (Europe Service) Futures Contract has been rebounding sharply after mid-year slump.
Interestingly, this is all against the overcapacity concerns looming over the industry. Industry consultants are forecasting a 2026 full-year demand growth of 2.5-3.5%Y/Y, while supply is expected to grow at a much faster pace of 6-7%Y/Y. Noted this has also taken into account of the subdued Suez Canal service resumptions. But what's driving the resiliency of container shipping industry?
Drivers of the rise
Supply-chain diversifications further accelerates. North American importers' concentration in their top-3 sourcing countries has fallen from 61% to 54% over the past year, and Southeast Asia sourcing volumes are up 24%Y/Y — both signs that the China+1 shift isn't slowing, it's compounding. Each additional origin port (Vietnam, India, Bangladesh, Mexico) adds routing complexity relative to the old network, since cargo now moves through less-optimized port pairs and feeder connections. That structural fragmentation itself supports the freight rates and supply-demand dynamics, let alone the demand driven by local economic demand growth — as more ports and markets are being integrated into global supply chain.
Long-haul volumes to developed regions stayed decent. Estimates vary by source, but the consistent theme is that developed-market demand hasn't collapsed even as headline trade growth forecasts sit in the low single digits (BIMCO's 2026 estimate: 2.5-3.5% container demand growth). The U.S. National Retail Federation actually revised its import-volume forecast upward in the past few months, from a projected 5.7% decline to a 2.8% increase, consistent with continued or renewed frontloading into the US. That's a meaningful swing in sentiment even if it's not a demand boom.
The effects of port congestions are underrated. The scale here is easy to undersell in a single "congestion is high" headline. Roughly 3.7 million TEU of capacity is currently idle at berths — about 11% of the entire global container fleet, and comparable to a top-5 carrier's entire operating fleet sitting motionless instead of moving cargo. That's not a marginal drag: it's capacity that would otherwise be available to absorb the current freight-rate spike, and its removal from effective circulation is arguably doing more to tighten the market day-to-day than any of the demand-side numbers above. Congestion of this scale, layered on top of the Cape of Good Hope diversion (another ~2.5 million TEU, ~7% of fleet, still tied up from the 2024 Suez rerouting), means close to 18% of the global fleet is currently unavailable for normal service — which is a much larger effective supply cut than most coverage of "elevated congestion" implies.
geopolitical risks are not near easing. If anything the risk basket has broadened rather than narrowed. Iran-related war-risk surcharges, a Strait of Hormuz disruption, and a Houthi threat to resume Red Sea attacks are all live simultaneously — Bab el Mandeb transits have recently declined by around 24%, showing carriers are still actively avoiding the route rather than testing a return. This is a meaningfully different situation from "the Red Sea crisis is resolving": multiple independent flashpoints (Iran, Yemen/Houthi, broader Gulf tensions) each carry their own reversal risk.
What’s to watch out?
The rhythm of Suez Canal service resumption. This isn't a binary "open or closed" question — it's happening in phases, and the pace matters enormously for effective global capacity. As of mid-August 2026, it is estimated that 1/3 of Maersk's Seuz routes have been resumed, but the company remained cautious. For OCEAN Alliance, they seems to be trailing only on back-hauls.
The interesting part is — if all liners go back simultaneously, it could further exacerbates port congestions and supply-chain chaos by at least a quarter (the way they shifted to Cape of Good Hope when Red Sea Crisis began). While overcapacity could be the theme in the longer-term.
Supply-demand dynamics into 2027, with a big orderbook (TEU capacity) to be delivered. This is the more structural risk sitting behind the current rally. The current orderbook stands at 31-35% of the existing global fleet, the highest level since 2010. Deliveries are scheduled to step up from about 1.5-1.7 million TEU in 2026 to roughly 3.0 million TEU in 2027. If a meaningful chunk of that 2027 wave lands around the same time Suez routes normalize and congestion clears, you get new capacity and freed-up diverted capacity hitting the market simultaneously — which is the scenario many have flagged as the real risk to durability, distinct from today's tight, friction-driven market.
The timing of scrapping of aging fleet. Scrapping is the release valve that hasn't been used. Demolition activity collapsed to just 8,172 TEU in 2025 — a 20-year low — down from 95,607 TEU in 2024, because owners are keeping older vessels in service to capture strong charter rates from Red Sea diversion demand. An estimated 1.8 million TEU of aging tonnage is being kept alive that would, in a normal cycle, already be retired. That's a coiled spring in both directions: if rates soften, scrapping could accelerate quickly and help offset new deliveries; but as long as charter economics stay this attractive, owners have every incentive to keep marginal ships running, which means the "natural" capacity offset isn't currently doing any work — worth watching specifically for when (not if) that changes.
Last but not least, global economic growth (deliberately putting in the end, as those other factors actually could be more relevant).
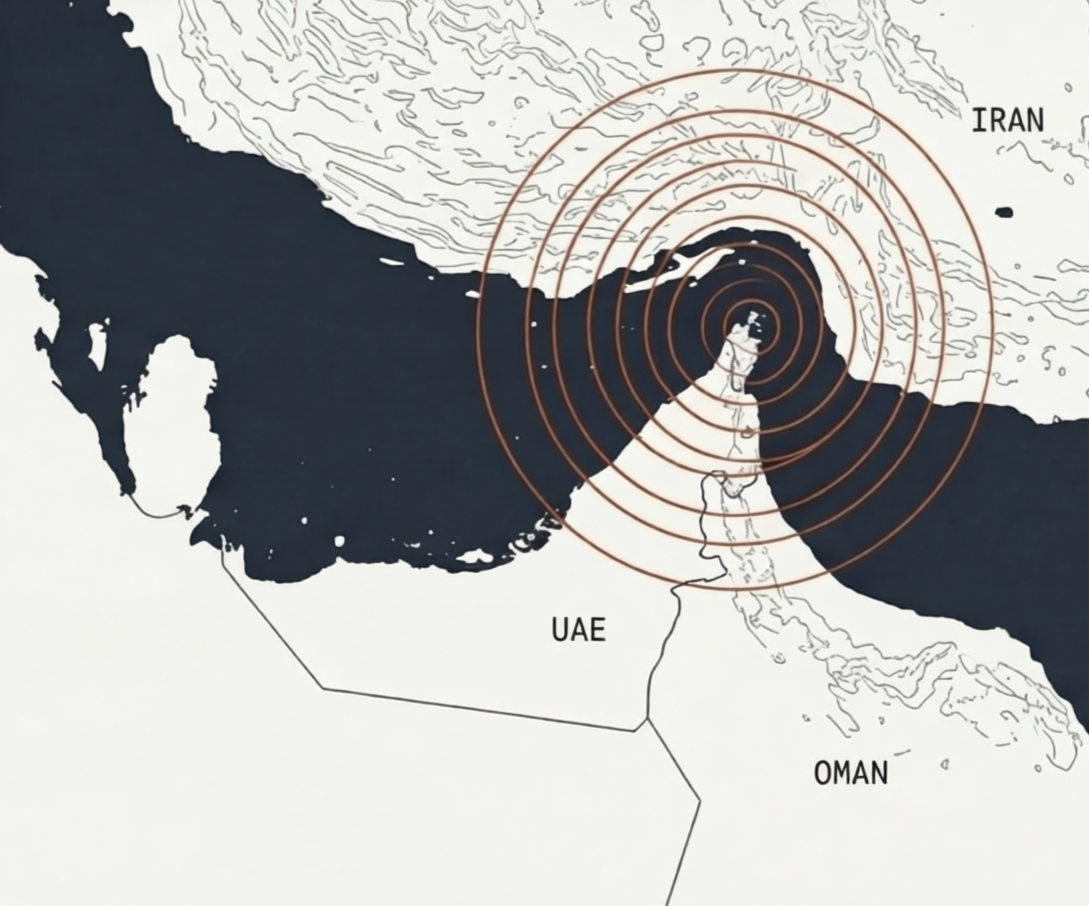
Hormuz traffic is nearing a standstill: only six commodity vessels crossed on Monday, with no VLCCs or LNG carriers recorded, while security risks remain elevated after another vessel was hit by an unidentified projectile.
China is shifting crude flows offshore: COSCO Shipping Energy and CMES are keeping VLCCs outside Hormuz and relying more on Oman/Fujairah STS transfers, with China- and Hong Kong-linked activity exceeding 600,000 bpd in both June and July.
Saudi Aramco is adopting the same workaround: after a roughly three-week pause, Aramco resumed Gulf loadings and moved cargoes via STS off Fujairah, including three VLCCs carrying about 2 million barrels each.
LNG may now be following crude: LNG Enugu and ADNOC-operated Mraweh were spotted alongside near Sohar in a potential STS operation that, if confirmed, would be the first known post-Hormuz Gulf LNG transfer outside the strait.
Shipping through the Strait of Hormuz remains close to a standstill. Kpler data cited by Reuters showed only six commodity vessels crossed on Monday, still below the recent 10-day average, while no VLCCs or LNG carriers were recorded transiting the strait. Traffic had fallen to only a handful of vessels over the weekend, and a ship exiting Hormuz was hit by an unidentified projectile on Tuesday, reinforcing the security risk facing large energy carriers.
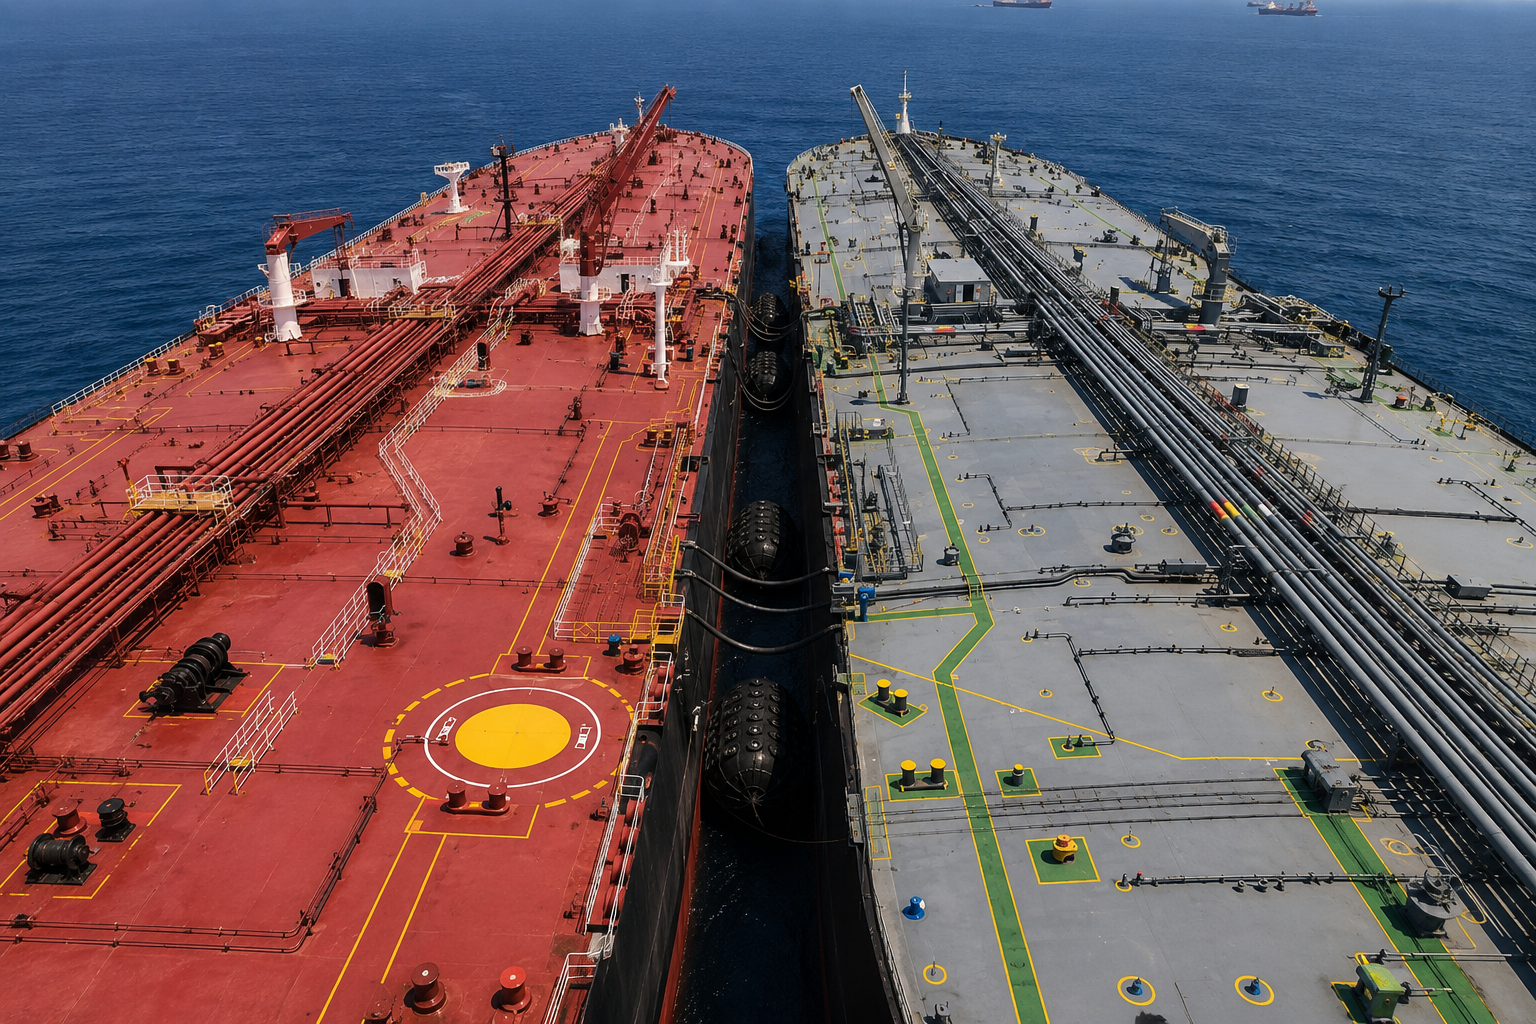
Against that backdrop, ship-to-ship transfers (STS) are taking on a larger role in keeping Gulf energy exports moving.
Ship-to-ship transfer, or STS, is the transfer of cargo directly between two vessels at sea or at an offshore anchorage, rather than through a conventional port terminal.
In oil trading, the practice is well established and can be used to consolidate cargoes, switch vessels or bypass port constraints. LNG STS is less common and technically more complex because the cargo must be kept at cryogenic temperatures.
China Shifts Middle East Crude to Offshore STS
China’s two largest state-controlled tanker operators, COSCO Shipping Energy Transportation and China Merchants Energy Shipping, have kept vessels away from Hormuz and Bab al-Mandeb since late July, increasingly receiving crude through offshore STS transfers near Oman and Fujairah.
The two groups control more than 100 VLCCs and previously handled roughly half of China’s Middle Eastern crude imports. Instead of sending China-bound VLCCs deeper into the Gulf, cargoes can be moved across the chokepoint first and transferred to long-haul vessels outside it.
The change is already visible in the data. STS activity involving China- and Hong Kong-owned vessels in the Gulf of Oman exceeded 600,000 barrels a day in both June and July, according to Kpler data cited by Reuters. Oman-to-China VLCC earnings were still around $140,000 a day last week as additional transfers, waiting and vessel repositioning absorbed tanker capacity.
Will China-linked Gulf of Oman STS crude transfers remain > 600,000 bpd in September?
YesResult
33.33%
NoResult
66.67%
3 Polls
EndedTBD
Saudi Arabia Begins Offering Crude via STS Outside Hormuz
Saudi Arabia is beginning to offer crude for sale off the coast of Oman, suggesting it may be following the UAE in using a shuttle-and-STS model to move barrels through Hormuz while keeping long-haul buyers outside the highest-risk waters.
Saudi Aramco has offered Arab Medium and Arab Heavy cargoes on a ship-to-ship basis from locations including Sohar in the Gulf of Oman, according to Bloomberg. The offers have so far been made to selected Chinese refiners, major buyers of the kingdom’s heavier, higher-sulfur grades.
The structure points to a two-step logistics model: Saudi crude is loaded inside the Gulf, moved through Hormuz on shuttle voyages, then transferred by STS outside the strait to long-haul tankers bound for Asia.
Satellite imagery showed vessels with at least 9 million barrels of transport capacity loading at or near Ras Tanura over the past week, while a large cluster of supertankers has gathered outside the Gulf — further evidence that offshore transfer points are becoming part of Saudi export logistics.
Potential First Post-Hormuz LNG STS Emerges
The model may now be spreading from crude into LNG.
Satellite imagery showed LNG Enugu alongside the ADNOC-operated Mraweh near Sohar, Oman, in what appears to have been a ship-to-ship operation. Mraweh had previously moved through Hormuz after loading LNG inside the Gulf.
If confirmed as a cargo transfer, it would be the first known case of Gulf LNG being transferred to another LNG carrier outside Hormuz after crossing the strait.
The development would be particularly notable because LNG STS is substantially more operationally demanding than crude transfer, requiring cryogenic cargo handling and specialized equipment. Together with the rapid increase in crude STS activity, it points to Sohar and Fujairah emerging as offshore relay points for Gulf energy exports while conventional Hormuz traffic remains severely disrupted.
What began as an emergency workaround may prove more lasting. If disruptions persist, repeated use of STS could gradually reshape Gulf energy logistics, with offshore transfer hubs becoming a more permanent part of regional export infrastructure.
Whether that becomes a structural shift — or fades once Hormuz normalizes — remains to be seen.
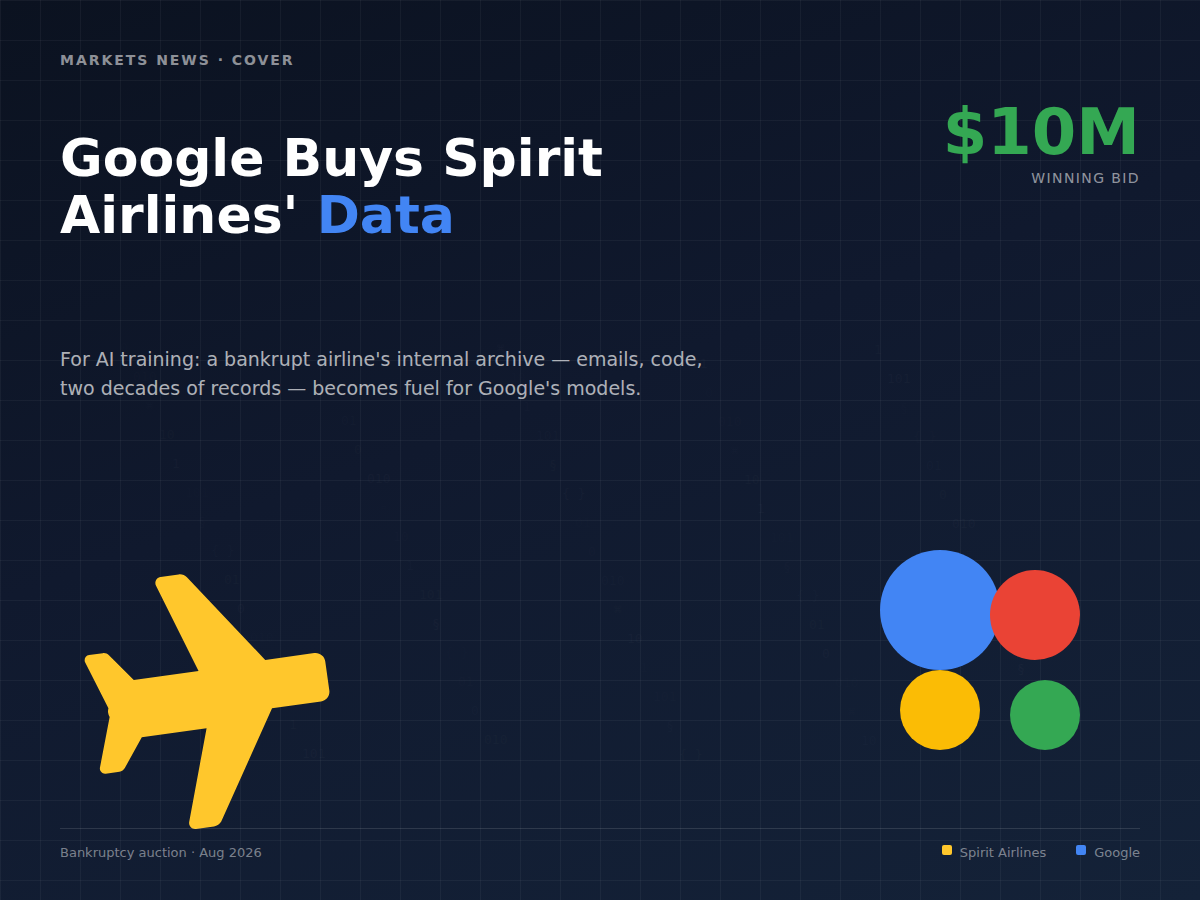
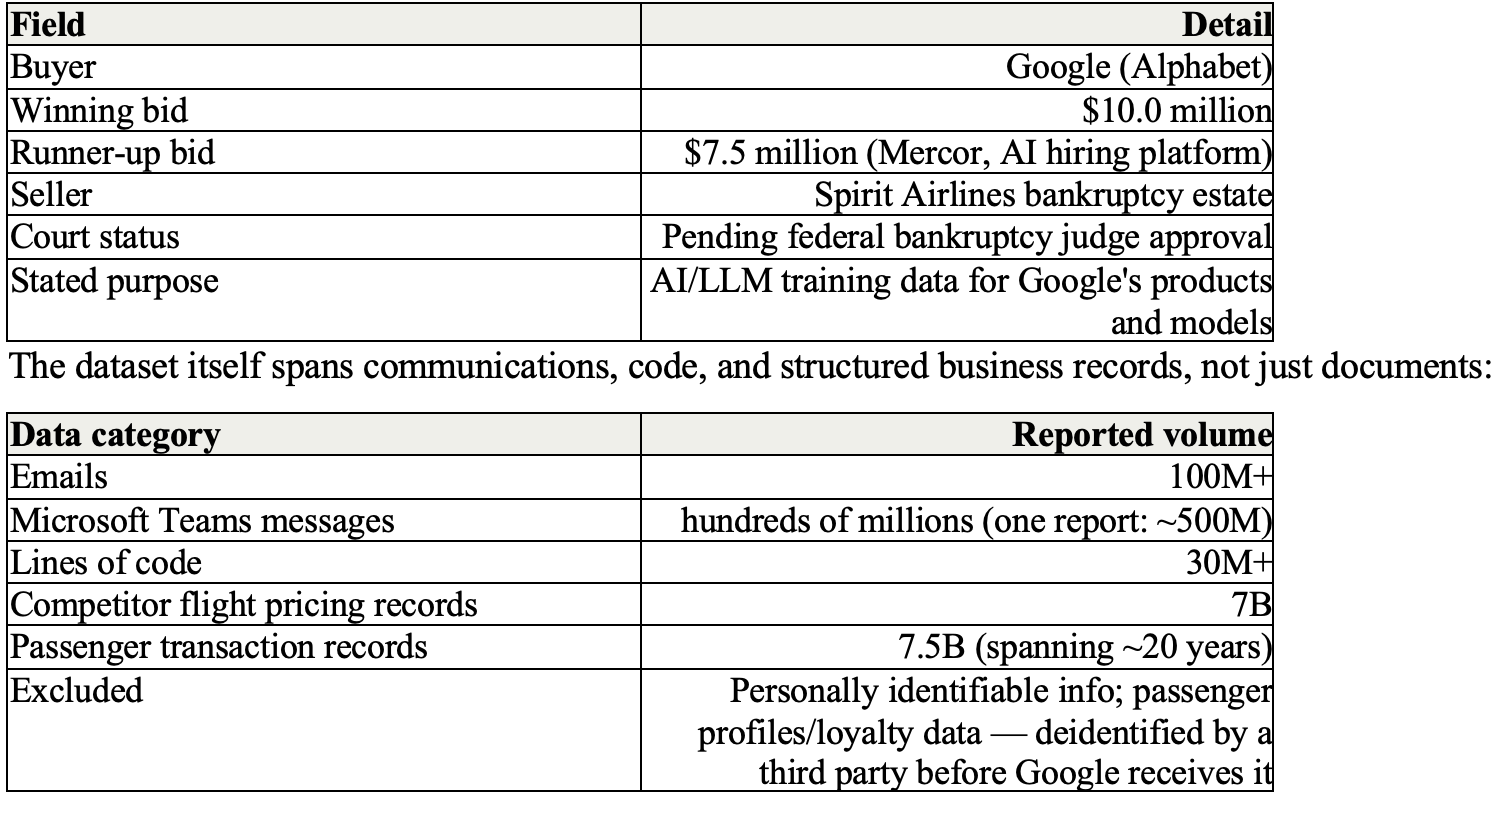
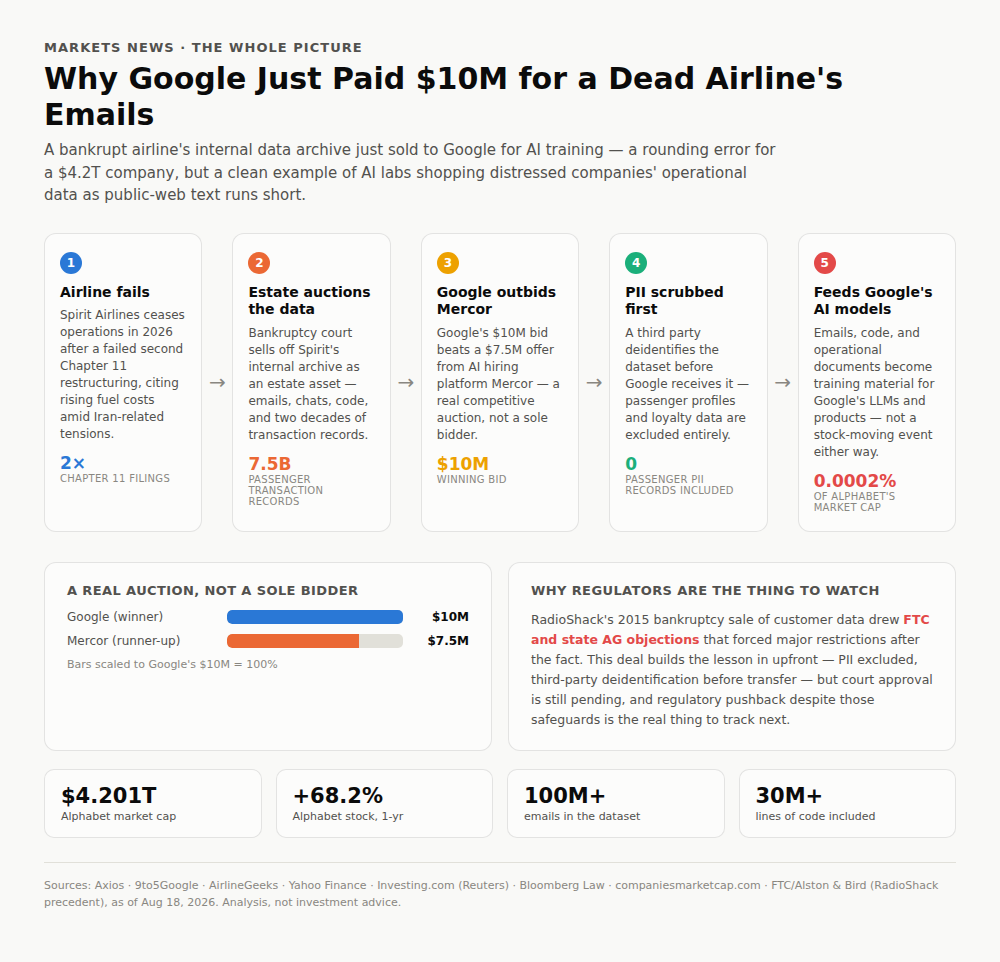
Google won a bankruptcy auction for Spirit Airlines' internal business data at $10 million, edging out a $7.5 million bid from AI hiring platform Mercor. The dataset — over 100 million emails, hundreds of millions of Teams messages, 30M+ lines of code, and 7.5 billion passenger transaction records spanning two decades — is intended as AI/LLM training material. Against Alphabet's $4.201 trillion market cap the deal is financially invisible; its real significance is as a data point in AI labs' growing appetite for large, non-public operational datasets sourced from distressed companies, not as a market-moving transaction.
Will Gemini launch next 'Pro' version in 3Q2026?
YesResult
30.41%
NoResult
69.59%
171 Polls
EndedTBD
What happened?
Spirit Airlines ceased operations in 2026 after failing to emerge from its second Chapter 11 bankruptcy, reportedly driven in part by rising fuel costs tied to Iran-related geopolitical tensions. As part of the bankruptcy estate's asset disposition, Google's $10 million bid beat Mercor's $7.5 million offer for a large internal-data package. A federal bankruptcy judge still needs to approve the sale before it closes.
Significance of the event
Financial Scale: financially trivial — $10 million against Alphabet's $4.201 trillion market cap is roughly 0.00024% of market value, and a rounding error against Alphabet's ad/cloud revenue run-rate.
Novelty? it isn't novel that AI labs buy training data, but the source and composition are notable — a large, structured, non-public operational dataset (proprietary code, two decades of transaction records, competitor pricing intelligence) rather than scraped public web text. This reflects the broader, well-documented AI-industry scramble for data as public-web text supply is increasingly exhausted relative to frontier model appetite.
Narrative: reinforces, rather than complicates, the existing "AI data scarcity" narrative — labs increasingly sourcing proprietary, structured corpora (code, internal operations, transaction history) as a complement to public text.
Does it actually help Google's model training?
Directionally - YES but it matters to separate what kind of help:
Genuine incremental value: this dataset (emails, code, two decades of transaction records, competitor pricing intelligence) is structured, real operational business data — different in kind from scraped public web text. In principle it could help a model perform better on enterprise-workflow, code-understanding, and business-analysis tasks. That's a real, if narrow, training-data-diversity benefit.
But it's not the lever that actually determines model competitiveness right now: look at where Alphabet is actually putting its money — the $195-205B capex is almost entirely data centers, custom silicon (TPUs), and compute, not data acquisition. Frontier model capability today is overwhelmingly driven by compute scale. A $10M dataset purchase is a marginal, nice-to-have addition inside that system, not something that changes Google's competitive position on model quality.
What to watch out?
Gemini execution risk? Whether the next Gemini release lands on a credible timeline or slips again — the stock's ~9% drawdown from its April high has already been tied to "Gemini delays," not to any data deal, so further slippage (or another high-profile departure beyond the ones already reported) is the more direct read on execution risk than anything in this transaction.
Regulatory/antitrust track, not just this deal's own approval. Watch for rulings, discovery timelines, or settlement terms on either, since those carry far more financial/reputational weight than a $10M bankruptcy auction.
Actual capex spend vs. guidance, and how it's financed. Alphabet has already revised 2026 capex guidance upward twice (most recently to $195-205B) — watch whether the next quarterly print shows real spend tracking that number or running ahead of it. Separately, watch the financing side specifically: beyond the $22.93B bond and $18B equity offering already completed, check for additional debt/equity raises, and — more importantly — for off-balance-sheet structures. That's the harder-to-see leverage that matters more than the headline guidance number, and it's where hyperscalers in this cycle have shown a pattern of getting creative.
On August 10, 2026, Maersk and Hapag-Lloyd announced that another container service in the Gemini shipping network would resume transiting the Red Sea and the Suez Canal. The two companies had already begun restoring Suez transits on some Asia-Europe services in July. This suggests that global shipping companies are once again testing a route that they had largely abandoned over the previous two years.
But this is still far from a full return. As of August 13, Maersk had restored only about one-third of its normal Red Sea and Suez traffic, with just 4 of the 13 relevant services returning to the route. The company believes that conditions in 2026 are now sufficient for a full resumption, but it has nevertheless chosen to adjust its network gradually.
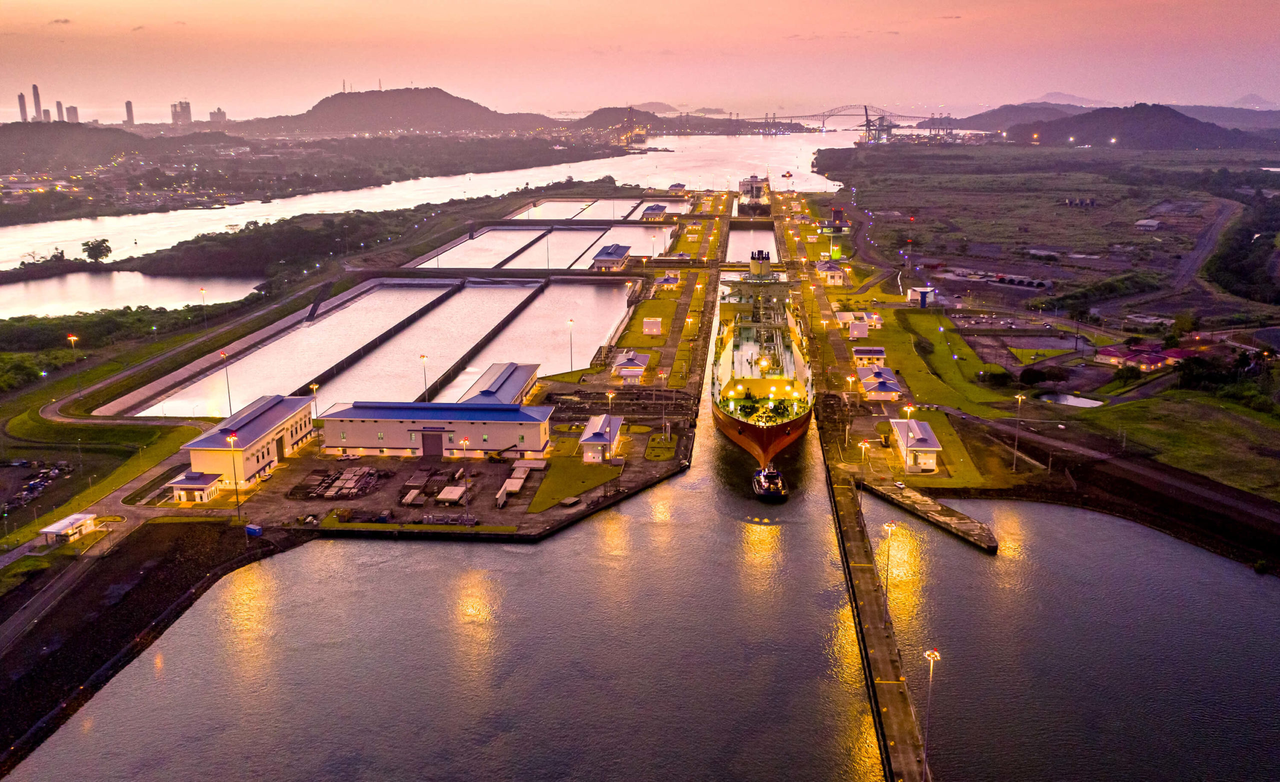
Unlike the Panama Canal, the Suez Canal did not impose draft restrictions because of water shortages, nor did infrastructure damage cause a prolonged reduction in transit capacity. The Suez Canal is a sea-level canal with no locks. Ships entering from the Mediterranean do not need to be raised to an artificial lake and then lowered back to sea level, as they do in the Panama Canal. The Suez Canal Authority explicitly describes it as the longest canal in the world without locks.
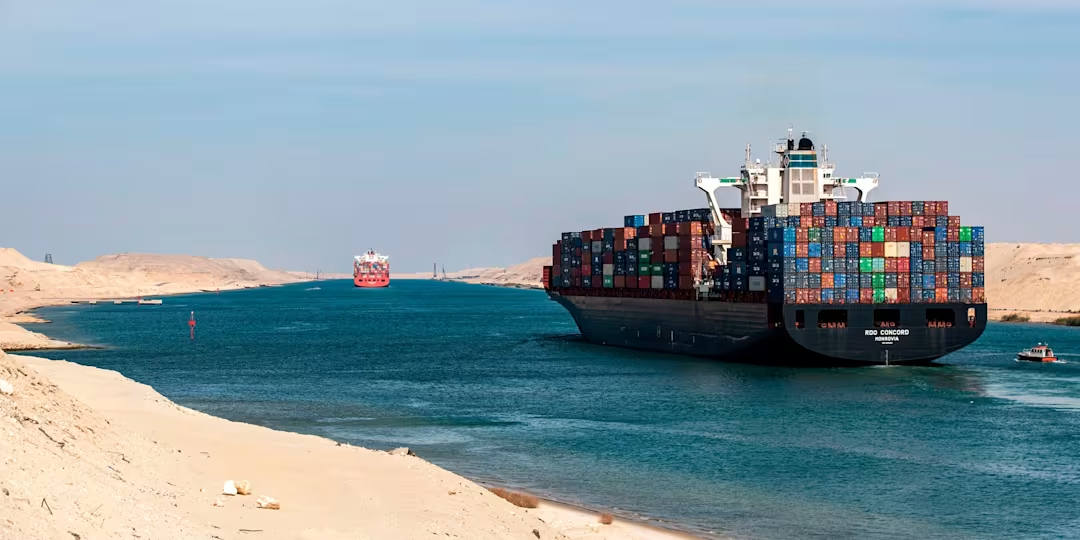
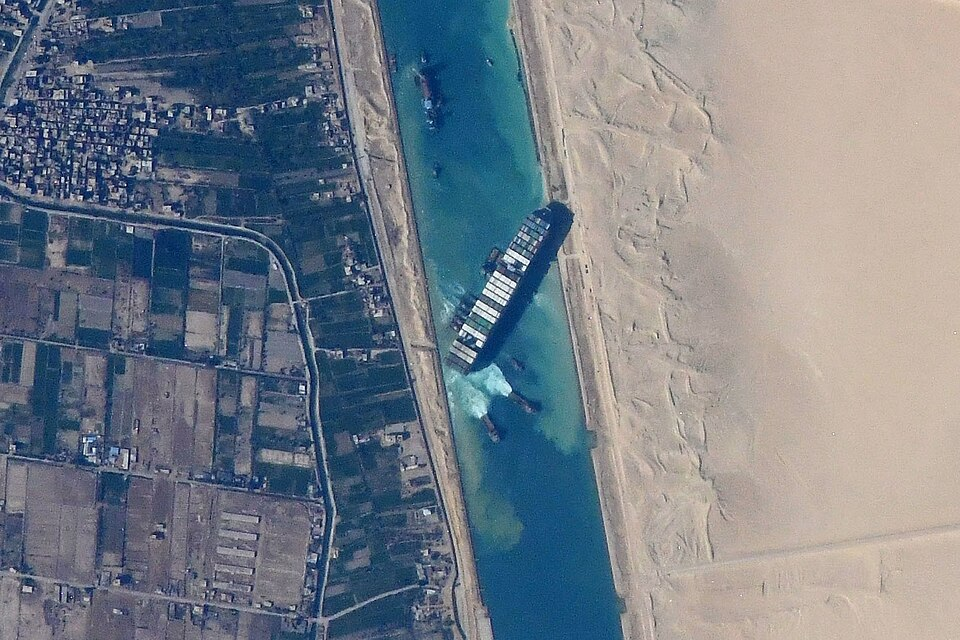
Of course, the Suez Canal is still subject to physical constraints such as channel depth, dredging requirements, windblown sand, accidents, and vessel size. The grounding of the Ever Given in 2021 demonstrated that an accident can temporarily shut down the entire waterway.
The container ship Ever Given stuck in the Suez Canal in Egypt, viewed from the International Space Station. (Image: NASA JSC ISS image library)
Yet traffic still largely disappeared. In 2023, 26,434 vessels transited the Suez Canal, representing 1.568 billion net tons. In 2024, that fell to just 13,213 vessels and 525 million net tons. In 2025, traffic remained at only 12,758 vessels and 522 million net tons. In other words, the number of vessels transiting the canal in 2025 was still less than half the 2023 level.
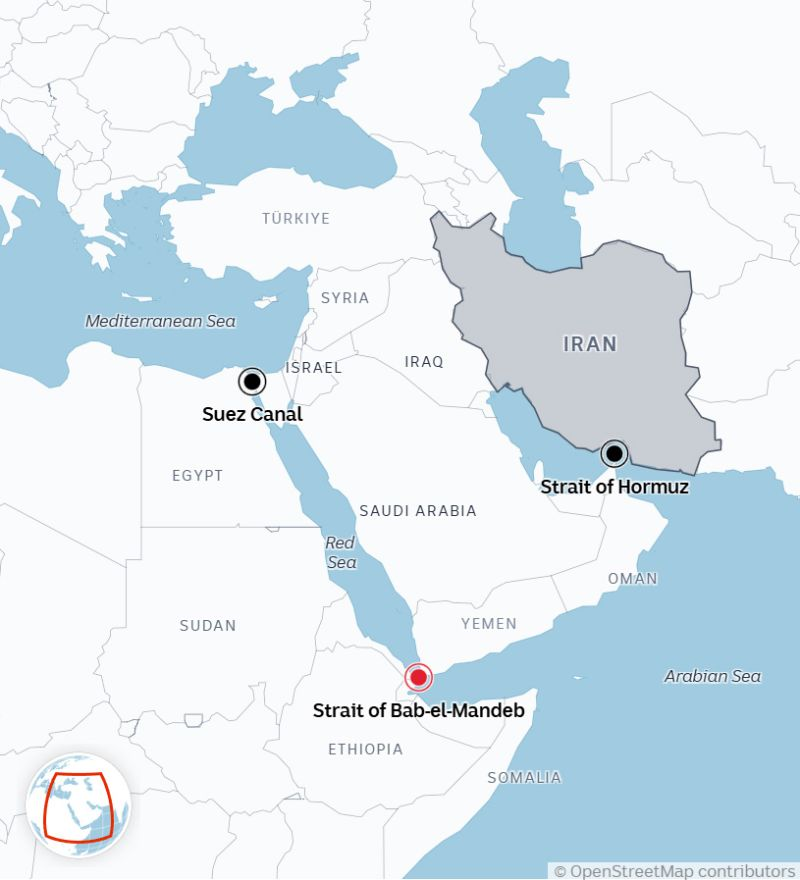
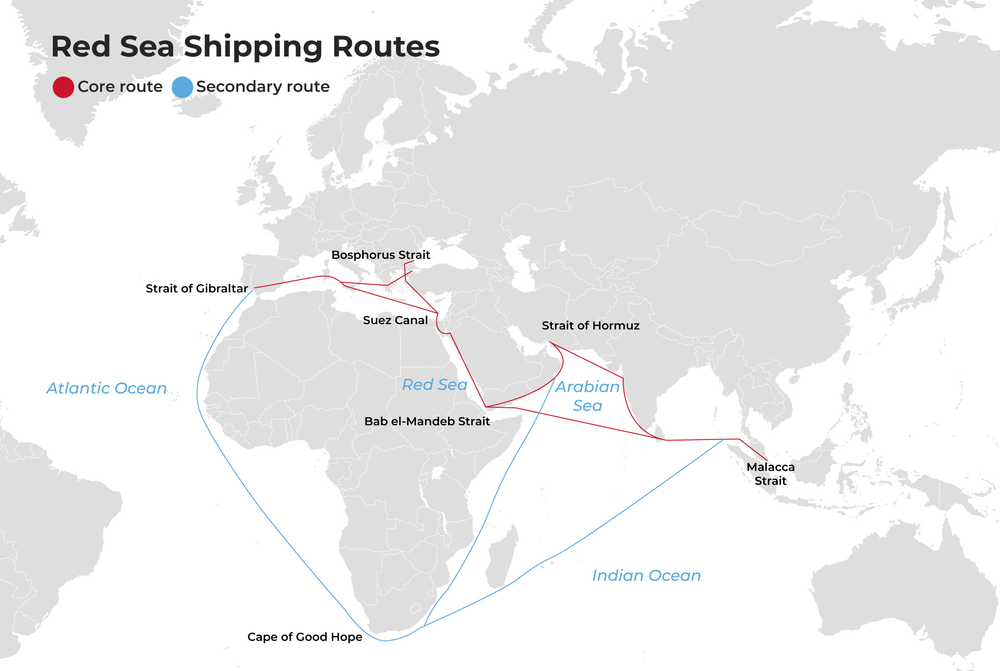
The Suez Canal's problem is primarily one of route substitution. The physical capacity is still there, but security risk determines whether shipowners are willing to use it. And to understand why, we need to look about 1,500 miles south, to the Bab el-Mandeb Strait between Yemen and Djibouti.
Suez and Bab el-Mandeb Are Effectively One Piece of Infrastructure
For a container ship sailing from Singapore to Rotterdam, the full route for “going through Suez” is: Indian Ocean -> Bab el-Mandeb -> Red Sea -> Suez Canal -> Mediterranean -> Europe.
Economically, this means Bab el-Mandeb and the Suez Canal function as two nodes in series. If the Suez Canal is closed, the Asia-Europe shortcut cannot be used. If Bab el-Mandeb becomes dangerous enough that shipowners are unwilling to transit it, the outcome is effectively the same.
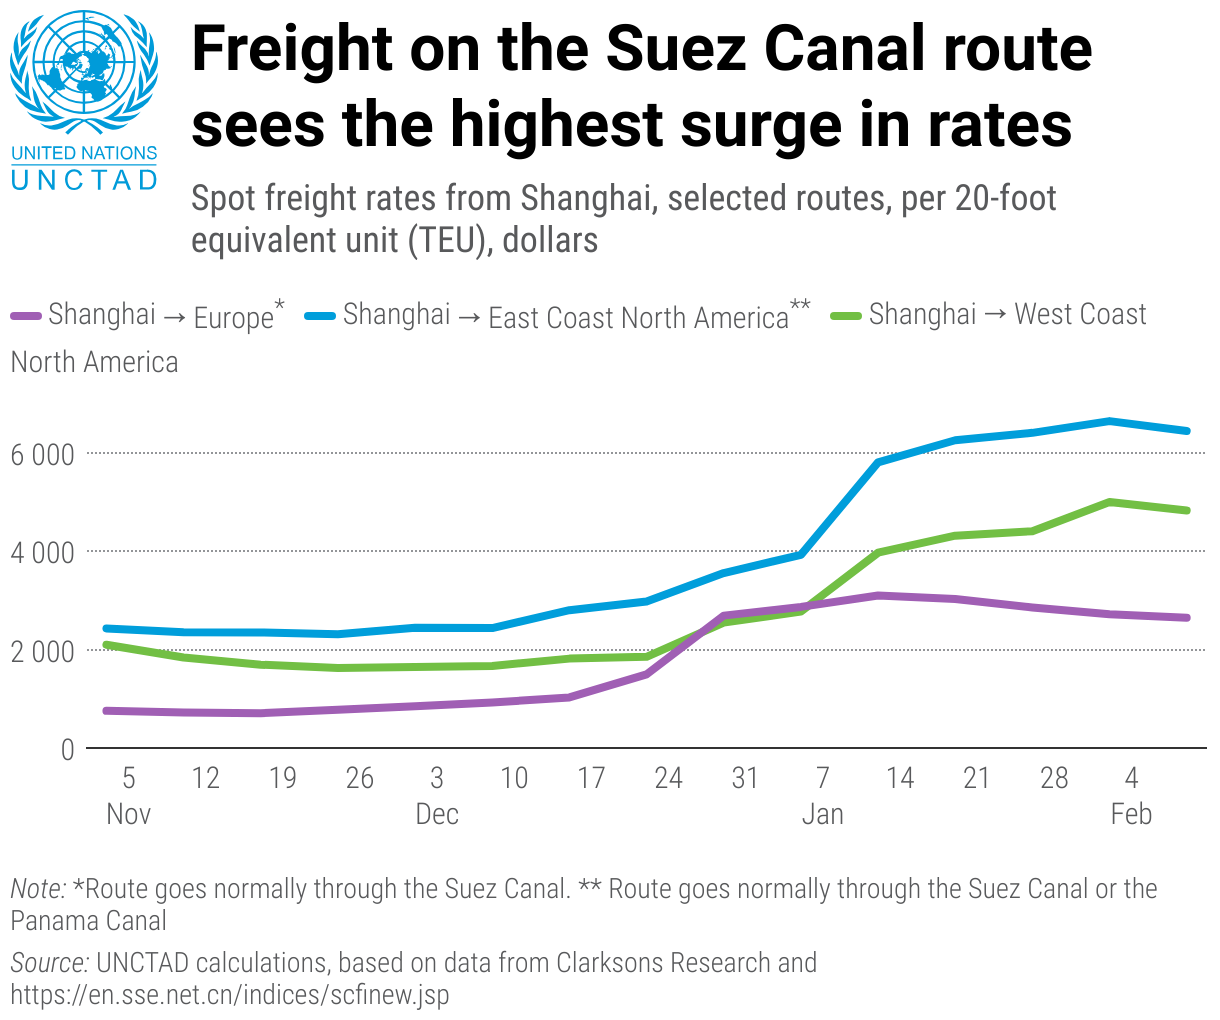
That is what has happened since 2023. Houthi attacks from Yemen have been concentrated mainly in the southern Red Sea and around the Bab el-Mandeb Strait, yet Egypt, some 1,500 miles away, has suffered enormous economic losses. Before the crisis, UNCTAD estimated that the Suez Canal carried around 12% to 15% of global trade in 2023. After the Red Sea conflict began, Suez Canal transits had fallen by about 42% from their previous peak by early 2024, while weekly container ship transits at one point dropped by 67%.
This illustrates an important feature of chokepoints: they do not need to be physically blocked to lose their economic function. They only need to become sufficiently costly or sufficiently dangerous to use.
Data shown for Nov 2023 - Feb 2024
What Suez Really Sells Is “Not Having to Sail Around Half of Africa”
The economics of the Suez Canal do not require a complicated model. What it really sells is the convenience of not having to sail around Africa.
The official voyage-distance data from the Suez Canal Authority make this very clear. From Singapore to Rotterdam:
Via the Suez Canal: 8,288 nautical miles
Via the Cape of Good Hope: 11,755 nautical miles
Distance saved: 3,467 nautical miles (-29%)
At an average speed of 16 knots, 3,467 nautical miles translates into roughly nine additional days of pure sailing time. Actual commercial voyage times depend on factors such as slow steaming, weather, port schedules, and vessel speed, but freight companies typically estimate that rerouting Asia-Europe voyages around the Cape of Good Hope adds about 10 days.
As long as the cost of transiting Suez is lower than the cost of rerouting around the Cape of Good Hope, the canal remains attractive. If Red Sea security risks push the first option above the second, ships will sail around Africa instead.
The economic value of the Suez Canal can therefore be understood, in simplified form, as Avoided Cape Cost - Canal Toll - Red Sea Risk.
Source: seasonalliving
When it comes to canal tolls, the Suez Canal Authority does not charge a simple flat rate such as “$500,000 per ship.” Base transit dues are calculated according to Suez Canal Net Tonnage, vessel type, whether the vessel is laden or in ballast, and other conditions. Different vessel categories are subject to different rates, with various surcharges, rebates, and special-route discounts layered on top.
Economically, this makes sense. A large crude oil tanker, a 20,000 TEU container ship, and a small bulk carrier face very different costs if they have to reroute around the Cape of Good Hope, so their willingness to pay for the Suez shortcut naturally differs as well.
The SCA also actively adjusts prices in response to shipping-market conditions. At the height of the Red Sea crisis, Egypt needed to attract ships back.
In May 2025, the SCA offered a 15% rebate on transit dues to large container ships with a Suez Canal Net Tonnage of 130,000 tons or more. One of the direct objectives was to help shipping companies offset the higher insurance costs associated with operating through the high-risk Red Sea. But as shipping conditions changed, the SCA suspended the 15% rebate from April 7, 2026.
Then, from July 15, 2026, temporary surcharges for several vessel categories were raised again. Kuehne+Nagel summarized these adjustments. Laden crude oil tankers were required to pay a 37% surcharge on top of normal transit dues, compared with 27% for ballast tankers, 22% for dry bulk carriers, 19% for LNG carriers, and 12% for container ships.
This sequence of offering a rebate, withdrawing it, and then raising surcharges reveals the essence of Suez pricing quite clearly: the SCA is pricing the economic value created by allowing ships to avoid sailing several thousand extra nautical miles. But it cannot raise prices without limit. The Cape of Good Hope remains an open-access competing route outside the Suez Canal, placing a natural ceiling on the SCA’s pricing power. So although the Cape of Good Hope lies thousands of kilometers from Egypt, it effectively participates in the price discovery of Suez Canal transit fees.
The 2026 Hormuz Crisis Put the Entire System Through an Even Greater Stress Test
If Suez and Bab el-Mandeb were already complicated enough, the 2026 Hormuz crisis added another layer.
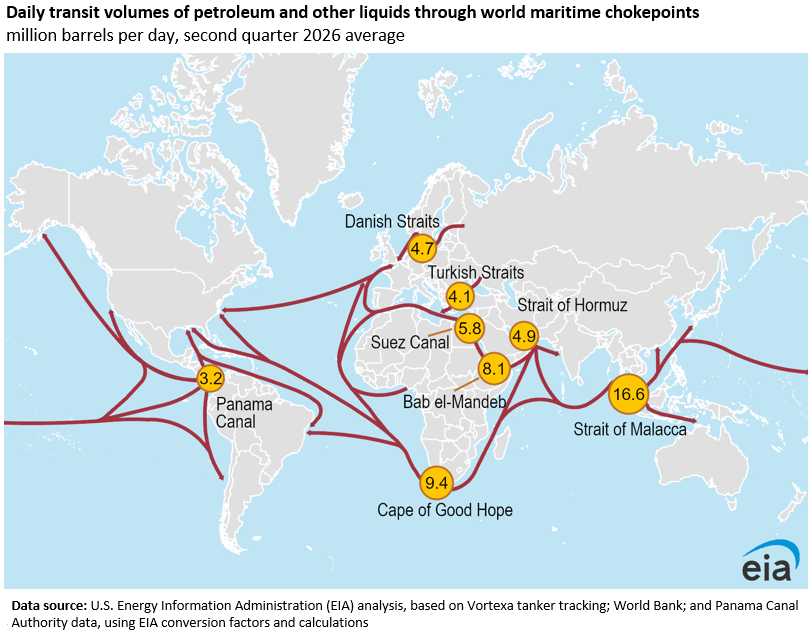
EIA data show that crude oil and petroleum products flow through the Strait of Hormuz averaged about 21.6 million barrels per day in the fourth quarter of 2025. By the second quarter of 2026, that had fallen to just 4.9 million bpd. At the same time, oil flows through Bab el-Mandeb increased from 5.4 million bpd in the fourth quarter of 2025 to 8.1 million bpd in the second quarter of 2026.
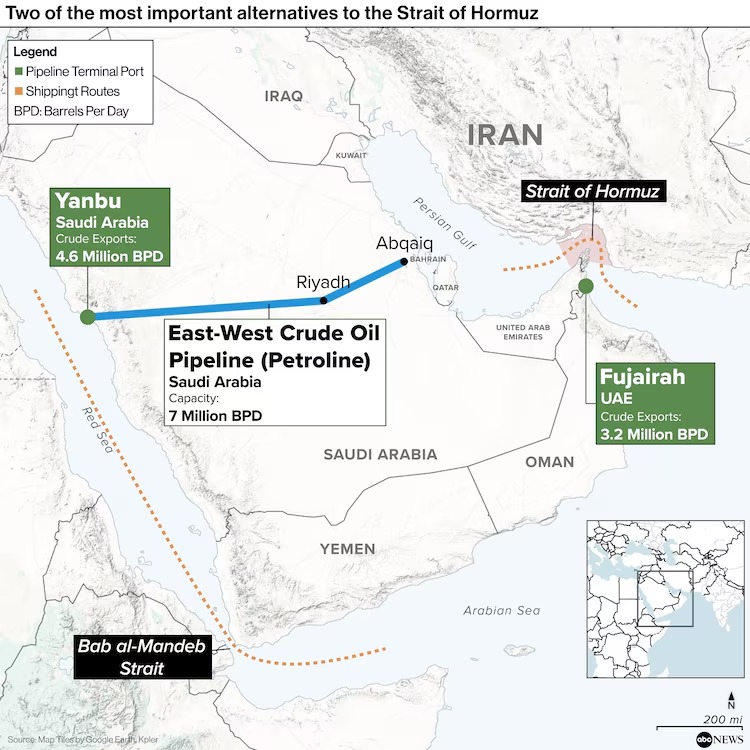
This is because Saudi Arabia has the East-West Pipeline, also known as Petroline, a strategic asset that many other Gulf oil producers do not have. The pipeline is about 1,200 kilometers long and connects Saudi Arabia's eastern oil fields with the Red Sea port of Yanbu. Its current maximum crude capacity is about 7 million barrels per day, of which roughly 2 million bpd supplies west coast refineries and about 5 million bpd can be used for exports. After Hormuz was severely disrupted, the pipeline quickly became one of Saudi Arabia's most important alternative export routes. Saudi Arabia could therefore send a barrel of crude that would otherwise have been exported from the Persian Gulf directly to the Red Sea. At that point, Hormuz had been successfully bypassed.
Image: abc News; Map Tiles by Google Earth, Kpler
From Yanbu, Saudi crude then faces two directions.
To Europe, it can head north: Yanbu → Red Sea → Suez/SUMED → Mediterranean → Europe
To Asia, it can head south: Yanbu → Bab el-Mandeb → Indian Ocean → Asia
This gives the East-West Pipeline enormous strategic value.
But in July 2026, risks around Bab el-Mandeb also rose rapidly. This produced an extremely counterintuitive route. A barrel of Saudi crude sold to Asia began by sailing in the direction of Europe. The tanker first headed north into the Mediterranean, then sailed west through the Strait of Gibraltar, around the entire African continent, and finally re-entered the Indian Ocean. The voyage increased from 19 days to 48 days, while fuel costs rose from about $1.26 million to around $2.87 million. On top of that, transiting Suez itself also requires paying canal tolls.
SUMED Means the “Suez” Corridor Is Not Actually a Single Route
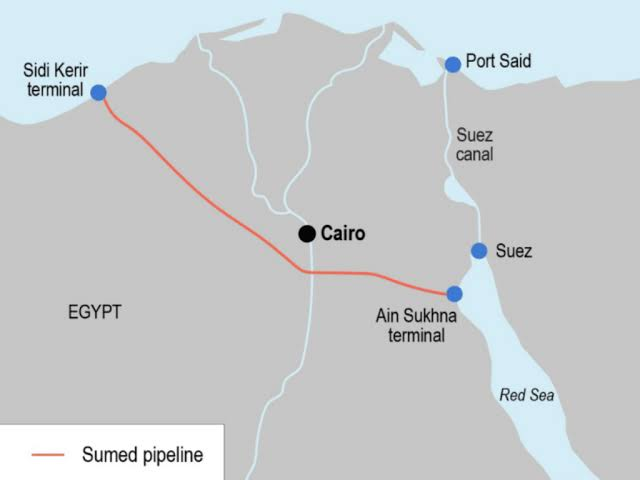
For oil, the Suez corridor consists not only of the Suez Canal, but also the SUMED Pipeline. SUMED connects Ain Sokhna on the Red Sea side with Sidi Kerir on the Mediterranean side and has a transport capacity of about 2.5 million barrels per day. When large VLCCs cannot transit the Suez Canal fully laden because of draft restrictions, they can discharge part of their crude into SUMED and have it handled or reloaded on the Mediterranean side.
In the second quarter of 2026, the Suez Canal and SUMED together transported about 5.8 million barrels per day of crude oil and petroleum products, including around 3.6 million bpd of crude and condensate. As risks around Bab el-Mandeb worsened, this northbound export route became even more important. In one week in early August, crude and condensate loadings at Sidi Kerir reached a record 2.17 million bpd, up about 50% from the previous week, with Saudi crude accounting for roughly 90%.
Image: Logistics Middle East
Saudi Arabia is now even considering expanding the East-West Pipeline by another 1 million to 2 million barrels per day. Reuters reported that such an expansion would require several years and billions of dollars in investment, and that Saudi Arabia has also discussed with some neighboring countries the possibility of using this export network in the future.
At the End of Every Escape Route May Lie the Next Chokepoint
If you look only at a map, Hormuz, Bab el-Mandeb, and Suez appear as three separate red dots. In reality, they are part of an interconnected transport network. When one node is disrupted, the cargo does not simply disappear. Some production may be forced to shut down, and some cargo may go into storage, but large volumes will still seek alternative routes. As a result, disruption at one chokepoint becomes additional traffic, congestion, risk, and price pressure at other chokepoints.
The Panama Canal shows us that a global shipping route can be constrained by something as seemingly local as freshwater. Suez and Bab el-Mandeb show us that a canal that remains completely open and has ample physical capacity can still lose more than half of its customers because of security risks 1,500 miles away. The 2026 Hormuz crisis goes one step further: even building a hugely valuable alternative oil pipeline and successfully moving oil away from one chokepoint does not mean escaping geography. Saudi Arabia's East-West Pipeline does bypass Hormuz. But once it delivers the oil to Yanbu, there are still only two choices: head north through Suez, or head south through Bab el-Mandeb. When the southern route also becomes dangerous, a barrel of Saudi crude that would normally take just 19 days to reach Asia may instead have to travel north through Suez, pay about $1 million in canal tolls, sail around the entire African continent, and take 48 days to reach Asia.
The real economics of global chokepoints is never just about how many ships a particular canal can handle. It is also about how much more the second route costs when the first route fails, how much more time it consumes, how much additional shipping capacity it ties up, and which chokepoint it must ultimately pass through. In the global shipping network, every escape route may end at the next bottleneck.
Disclaimer: The content is for informational purposes only. You should not construe any such information or other material as legal, tax, investment, financial, or other advice. Nothing contained in this article constitutes a solicitation, recommendation, endorsement, or offer by the author(s) or any third party service provider to buy or sell any securities or other financial instruments in your or in any other jurisdiction in which such solicitation or offer would be unlawful under the securities laws of such jurisdiction. The author(s) report(s) no conflict of interest.
Jane Street absorbed a roughly $15bn July hit tied to Situational Awareness and other AI-linked tech exposure, even as year-to-date trading revenue topped $40bn.
Workday surged on reported Silver Lake takeover talks, highlighting how private equity may see opportunity in SaaS names pressured by AI disruption fears.
AI spending is also feeding into higher real yields, as heavy bond issuance from governments and companies raises borrowing costs and creates a new valuation headwind for growth stocks.
Jane Street Takes $15 Billion Hit as AI Selloff Ripples Through Markets
Jane Street suffered a roughly $15 billion hit in July from exposure to AI-focused hedge fund Situational Awareness and other technology stocks caught in the market selloff, Reuters reported, citing people familiar with the matter and a note it reviewed.
The loss underscores how sharply the recent pullback in AI-linked assets has reverberated through even the most sophisticated corners of Wall Street. Quantitative funds were among those hit as crowded positions in technology stocks unwound.
The setback, however, comes against an exceptionally strong year for Jane Street. The trading firm has generated more than $40 billion in trading revenue year to date, according to Reuters, already surpassing the $39.6 billion it produced during all of 2025 and putting it well ahead of major banks and market-making rivals.
The contrast highlights the scale of Jane Street’s operations: a single month can produce losses measured in the tens of billions while the firm remains on track for one of the strongest trading years in its history.
Workday Surges on Report of Silver Lake Takeover Talks
Workday Inc. shares jumped as much as 19% after Reuters reported that private-equity firm Silver Lake has been in talks to acquire the enterprise-software company.
The discussions have been underway for several months, according to the report, though there is no certainty that a transaction will be reached.
A potential takeover would come at a pivotal moment for the software-as-a-service sector. Workday, which sells cloud-based software for human resources and financial management, has been among the companies caught in the market’s growing concern that generative AI could weaken traditional SaaS business models.
Investors increasingly worry that AI-assisted software development could lower barriers to entry, enable cheaper competitors and allow large customers to build more applications internally. That pressure has contributed to what investors have dubbed the “SaaSpocalypse,” a broad repricing of software companies viewed as vulnerable to AI-driven disruption.
Workday shares had fallen about 18% this year through Wednesday’s close before the takeover report sparked the sharp rebound.
For Silver Lake, a deal would represent a classic private-equity wager: acquire a large, cash-generative software company during a period of public-market uncertainty and attempt to reposition it away from the quarterly pressures of listed markets.
AI Investment Boom Pushes Real Bond Yields Higher
The artificial-intelligence investment boom is beginning to create pressure in another corner of financial markets: government and corporate bond yields.
Inflation-adjusted borrowing costs across several major economies have climbed to their highest levels in more than a decade as governments and technology companies increase debt issuance to fund infrastructure spending, including the enormous capital requirements associated with AI.
Real yields measure the return investors demand above expected inflation and are widely regarded as a gauge of the true cost of capital. They are influenced by expectations for economic growth and monetary policy, but also by the balance between the supply of bonds and investor demand.
That supply dynamic is becoming increasingly important.
AI infrastructure requires vast spending on data centers, power generation, semiconductors and network equipment. At the same time, governments are running large fiscal deficits and issuing more debt. The combination threatens to keep long-term borrowing costs elevated even if central banks eventually lower policy rates.
For equity markets, the implications are significant. Higher real yields raise the discount rate applied to future corporate earnings, putting particular pressure on high-growth companies whose valuations depend heavily on profits expected years into the future.
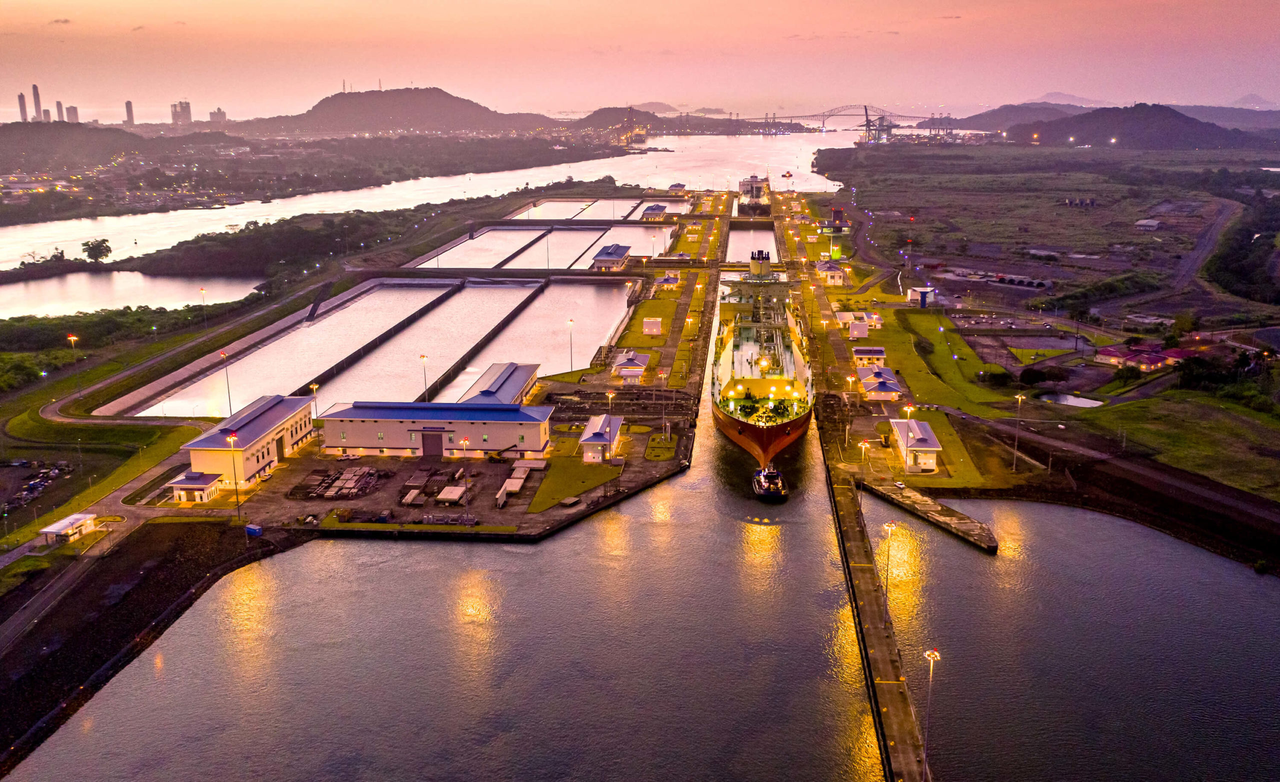
On August 5, 2026, the Panama Canal Authority announced another tightening of draft restrictions for large vessels. Starting August 26, the maximum allowable draft for Neopanamax vessels will be reduced to 48 feet. From September 3, it will be lowered further to 47.5 feet and remain at that level until further notice.
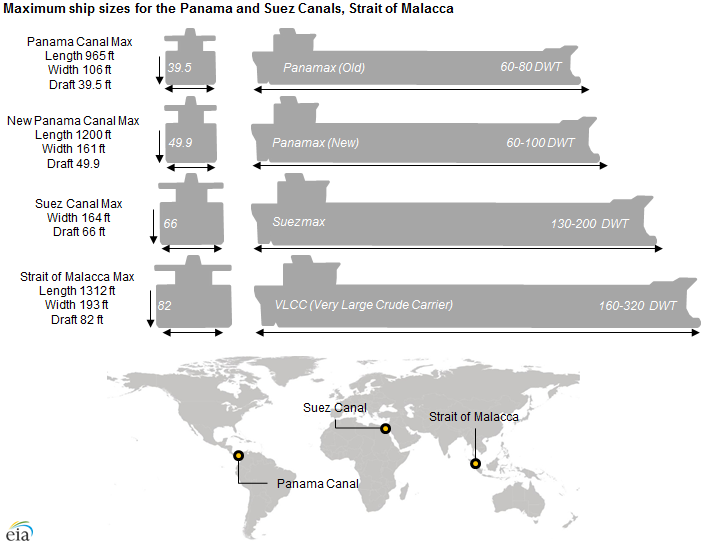
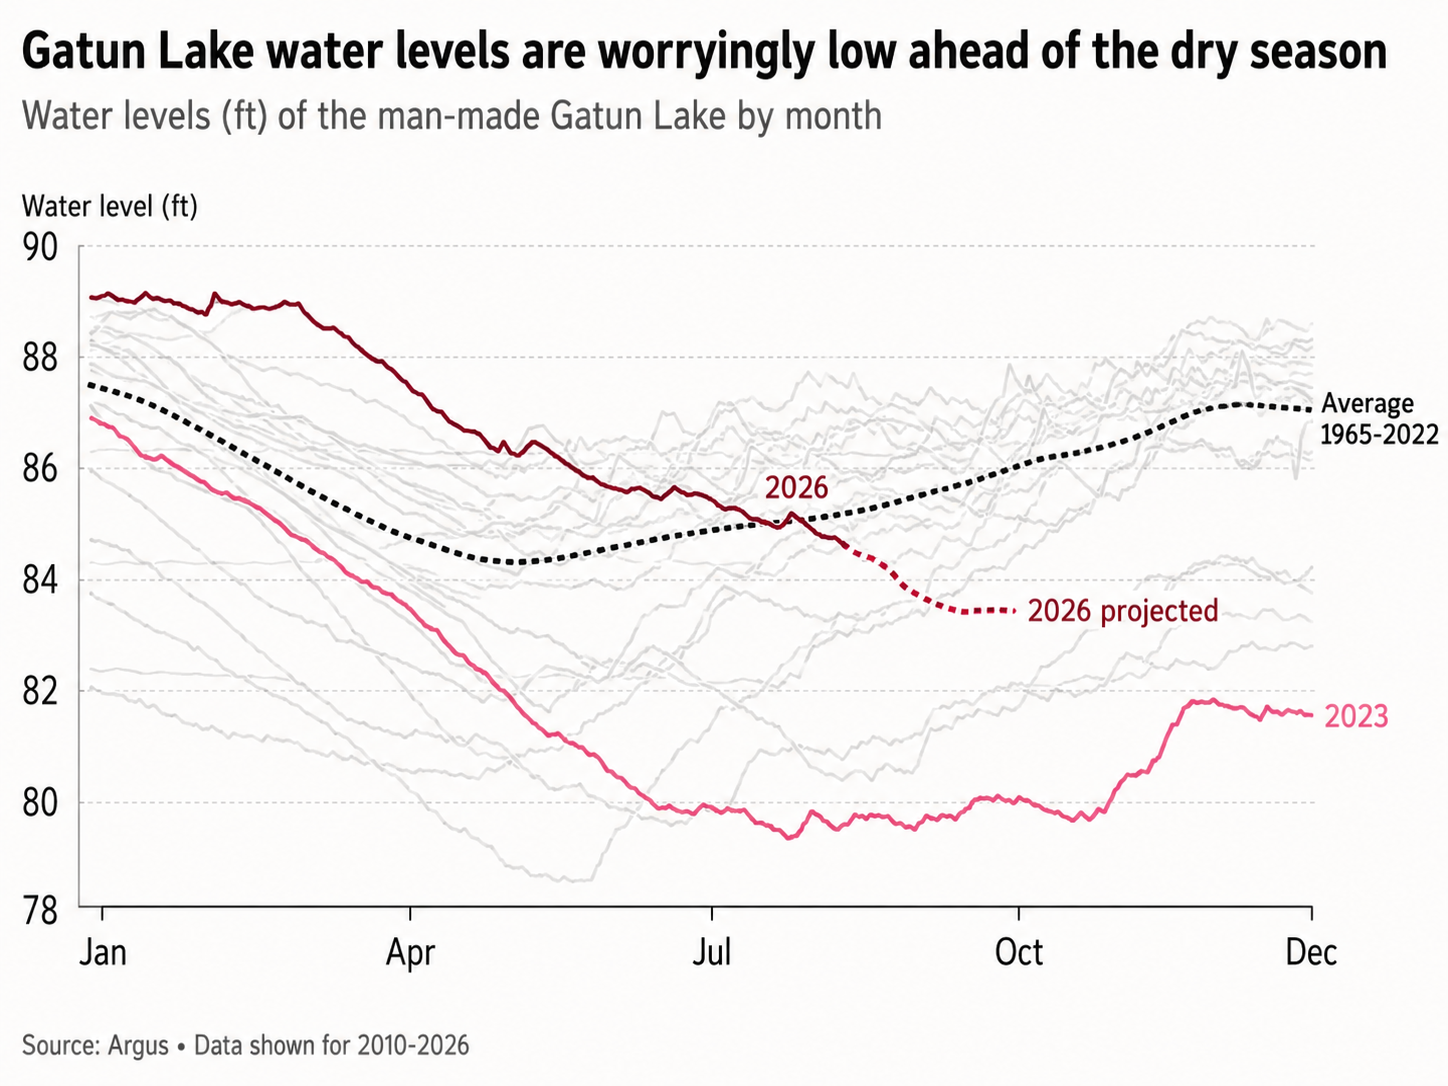
Under normal conditions, when the water level of Gatún Lake reaches 85 feet, Neopanamax vessels can operate at a maximum draft of 50 feet. In other words, the fundamental problem is that there is simply not enough water in the lake. More interestingly, the Authority has not, for now, reduced the number of vessels allowed to transit the canal each day.
Source: the U.S. EIA
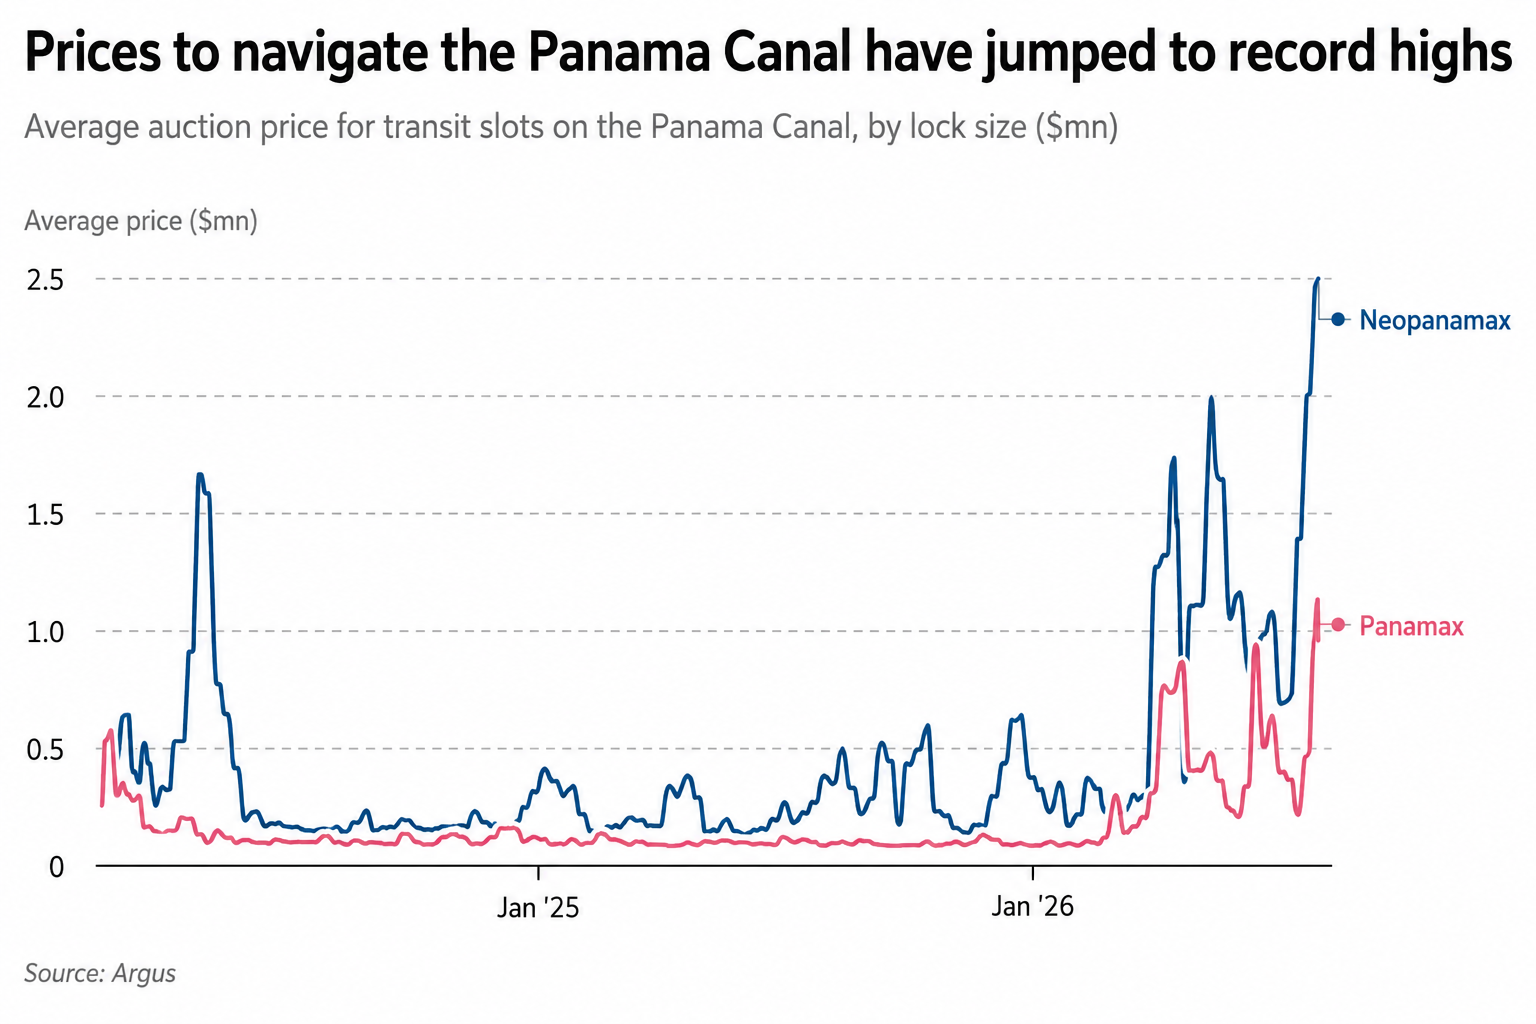
Meanwhile, another price at the canal is surging. According to the Financial Times, the average winning bid for the Panama Canal’s daily auctioned transit slots has reached about $1.1 million so far in August 2026, more than 16 times the level recorded during the same period last year. Slots for the larger locks have averaged about $2.5 million, with individual bids reaching as high as $3.78 million. On August 3, around 113 vessels were waiting to transit the canal, compared with just 40 on January 2.
These two seemingly different developments are actually pointing to the same underlying issue: the Panama Canal is not merely selling access to a waterway. What it is really selling is interoceanic transportation capacity created by freshwater. Once you understand this, the economics of the Panama Canal look completely different.
Average auction price for transit slots, late Jan 2024 - early Aug 2026
The Panama Canal Is Essentially a Giant "Freshwater Elevator"
Many people picture the Panama Canal as a waterway dug through the land to connect the Atlantic and Pacific Oceans. If that were really the case, water shortages should not be a major problem. The Suez Canal, for example, is a sea-level canal, where ships travel through at roughly the same elevation.
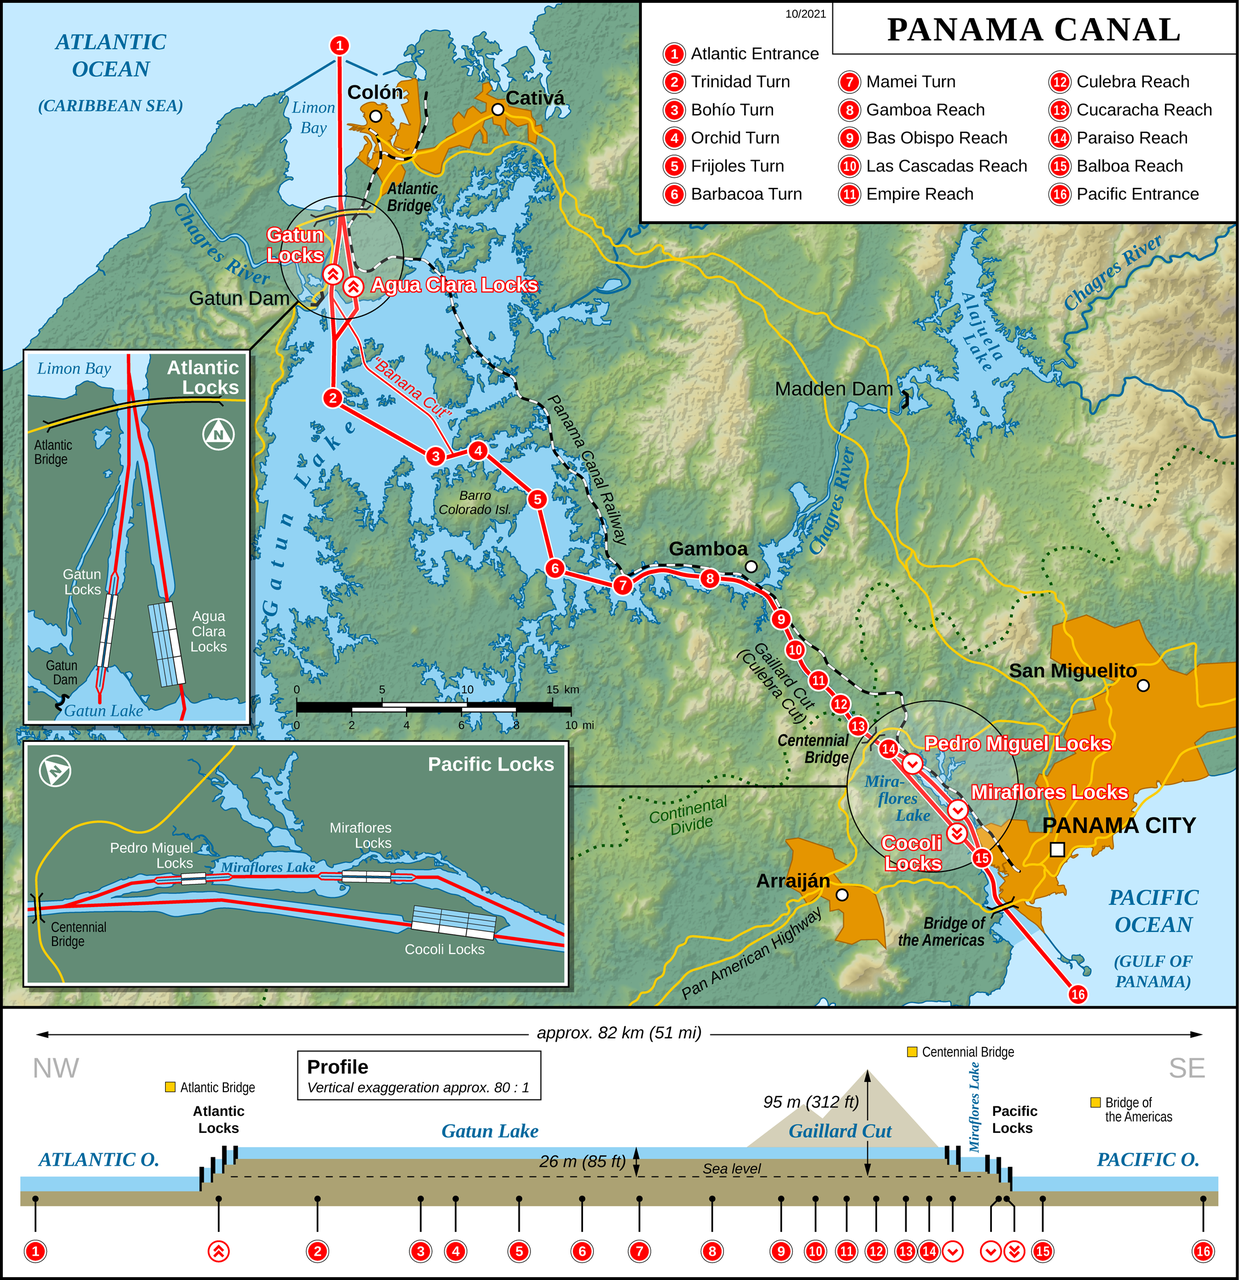
But the Panama Canal is different. After entering the canal from sea level, ships must be lifted step by step through a series of locks until they reach Gatún Lake, about 85 feet above sea level. They then sail across the isthmus before descending through another set of locks back to sea level on the other side. The process is powered not by giant pumps, but primarily by gravity and freshwater. In other words, every time a ship crosses the Isthmus of Panama, some of the freshwater stored in the lakes must be released.
Map of the Panama Canal (Image: Thomas Römer/OpenStreetMap data)
World Weather Attribution estimates that operating the Panama Canal’s locks requires about 7 billion liters of water per day from the rain-fed Gatún Lake.
Operational data from the Panama Canal’s 2025 fiscal year show that the average volume of water involved in each Panamax transit was about 0.194 hm³, while a Neopanamax transit involved about 0.4368 hm³, equivalent to 436,800 cubic meters. It is important to note that this official metric refers to average operational water use. It does not mean that all of this water is permanently "consumed", because the newer locks incorporate water-recycling systems.
The Panama Canal’s actual usable transportation capacity therefore depends on reservoir storage + rainfall replenishment + water-use efficiency per transit + lock operating capacity.
This is very different from an ordinary port. Expanding a conventional port usually means adding terminals, cranes, berths, and deeper navigation channels. The expansion of the Panama Canal, however, produced a much more unusual result: the physical capacity created by steel and concrete can exceed the capacity that the natural water cycle can sustainably support. The 2016 expansion solved the problem of ships being "too large", but it did not fundamentally solve the question of whether there would be enough water. That is why the marginal resource determining the Panama Canal’s effective transportation capacity today is not concrete, but rain.
Seasonality chart of water levels of the man-made Gatún Lake
Limiting Weight Before Limiting Ship Numbers
This time, the Panama Canal Authority has specifically emphasized that it is not currently reducing the number of vessels allowed to transit the Panamax or Neopanamax locks each day. That point is extremely important. If you look only at the headline figure for "how many ships transit each day", you might conclude that the canal is still operating normally and that the problem is not particularly serious.
But when measuring transportation capacity, the unit that really matters is cargo per day, not ships per day.
Draft is the depth to which a ship’s hull sits below the waterline. The heavier the ship is loaded, the more water it displaces and the deeper its draft becomes. When the water level in Gatún Lake falls, the navigation channel can safely accommodate less draft, meaning that a vessel that would normally transit at a 50-foot draft may have to reduce fuel, ballast water, or cargo.
In practice, the Authority therefore has two separate control valves: how many ships are allowed to transit each day + how heavily each ship is allowed to load. During the extreme drought of 2023, both valves were used. At the time, the maximum draft for Neopanamax vessels fell from the normal 50 feet to 44 feet, while daily transit capacity was also reduced from normal levels.
The approach in August 2026 is more subtle: keep the number of ships broadly unchanged at first, while lowering the maximum load each vessel can carry. This means that when assessing risks to the Panama Canal, focusing only on the number of daily transits is misleading. Even if 35 or 38 ships are still passing through each day, the canal’s actual daily cargo throughput can still decline if more vessels are forced to sail with reduced loads.
Moreover, because a ship’s own weight, equipment, fuel, and other fixed components do not change much, a draft restriction reduces the vessel’s total allowable displacement, while cargo capacity is only what remains after subtracting those fixed weights. For a vessel that would otherwise be fully loaded, even a reduction of only a few percentage points in allowable draft can therefore translate into a disproportionately large loss in the revenue-generating cargo payload. However, the exact relationship between the change in displacement and a given reduction in draft is not linear. It depends on factors such as the vessel’s hull form, dimensions, and actual loading condition.
How Does a Drop of Freshwater Turn Into a $1 Million Transit Right?
If water is scarce, the natural question is: who gets access to the limited supply?
The Panama Canal has developed a highly market-oriented answer. It does not simply charge tolls. It also operates reservation systems, long-term slot allocation, and auctions. Official 2026 tariff documents show that a standard Neopanamax reservation slot carries a booking fee of $100,000. These regular slots are requested ahead of arrival during designated booking periods. By contrast, an auction price applies when a vessel competes for one of the slots specifically released through the Canal’s auction mechanism, often because regular capacity is already allocated or the vessel operator needs a slot closer to the transit date. The auction starts from a minimum price set by the Canal, but the slot goes to the highest bidder. In 2026, the Canal said it typically makes three to five slots per day available through auction.
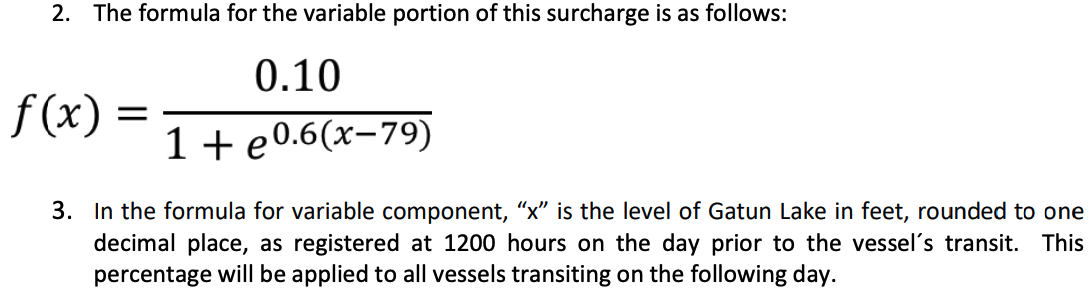
Even water itself has entered the pricing system. The Panama Canal currently imposes a Fresh Water Surcharge. Fixed portion of the surcharge is either $4,000 (for vessels > 125 feet and ≤ 300 feet) or $10,000 (for vessels > 300 feet). For vessels longer than 125 feet, an additional variable component is determined directly by the official water level of Gatún Lake on the day before transit, and can range from 0% to 10% of the vessel’s total canal toll. The scarcer the lake water becomes, the higher the price of water.
This is actually a remarkably clean economics case. Panama does not have a tradable "Gatún Lake freshwater futures" contract comparable to crude oil futures. But the scarcity value of water is already being expressed through at least three different prices:
Fresh Water Surcharge: directly maps the water level of Gatún Lake into the cost of transit.
Transit slot auction prices: as available capacity becomes scarcer relative to demand, shipowners bid up the price of securing timely passage.
Global shipping prices: if vessels cannot transit on time, they must wait, reduce their loads, or reroute through longer alternatives such as the Suez Canal or the Cape of Good Hope. The scarcity then feeds into fuel costs, vessel charter rates, inventory carrying costs, and ultimately the prices of goods.
This is why a transit right worth more than $1 million is economically meaningful. It can be understood as the market-implied shadow price of the service of "crossing the Isthmus of Panama immediately".
The maximum price a shipping company is willing to pay depends roughly on:
additional fuel costs from rerouting
additional sailing days × daily vessel cost
financing and carrying costs of the cargo
costs of delayed delivery and supply-chain disruption
expected cost of continuing to wait
So $1 million is not some absurd "queue-jumping fee". It is telling us that, for certain cargoes, the economic cost of not using the Panama Canal has already exceeded $1 million.
At the same time, ships themselves are a finite stock of transportation capacity. Suppose a given volume of LPG originally requires one vessel to complete a round trip in 40 days. If rerouting extends that journey to 50 days, the world’s "effective shipping capacity" available to transport LPG declines. This is why the EIA observed that delays at the Panama Canal during the drought in 2023 pushed up vessel freight rates even in other regions. The ships did not disappear. They were simply "locked up" for longer periods by longer voyages and waiting times. The economic impact of a chokepoint therefore extends beyond the cargo that directly passes through it. It can also propagate to other trade routes by reducing the effective supply of the global fleet and pushing up freight rates.
World Weather Attribution’s attribution study of the 2023 event found that El Niño played a clear role. Under the current climate, rainfall in El Niño years is expected to be about 8% lower than in ENSO-neutral years. An exceptionally dry year like 2023 has about a 5% chance of occurring in an El Niño year under today’s climate conditions. Taking into account how frequently El Niño itself occurs, the researchers estimated that an event of this kind has a return period of roughly once every 40 years.
In fiscal year 2024, deep-draft vessel transits through the Panama Canal fell to 9,944, down 21% year over year. Average daily vessel transits at one point declined from around 36 to 27.3. Yet the canal’s revenue did not collapse. Instead, fiscal year 2024 revenue reached about 4.99 billion balboas, around 18 million more than the previous fiscal year. Net income rose to about 3.45 billion. The Panama Canal Authority explicitly stated that improvements to the reservation system, auctions, the Fresh Water Surcharge, and new pricing strategies helped support revenue.
The drought reduced physical throughput, but at the same time made transit rights more scarce. Through auctions and pricing mechanisms, the Canal Authority was able to capture part of that scarcity in the form of additional revenue. This is a classic example of scarcity rent. If the Panama Canal is understood simply as "a highway that charges tolls", this outcome looks strange. But if it is understood as a transportation capacity marketplace with a limited number of slots and the ability to price them dynamically, the result makes much more sense.
But Today’s $1 Million Price Cannot Be Attributed Entirely to Drought
Part of the surge in transit slot prices in 2026 is also being driven by changes on the demand side.
Conflict in the Middle East and other disruptions to global shipping routes have increased demand for the Panama route for some trade flows between the U.S. Gulf Coast and Asia. In April, the Panama Canal Authority explained that after the conflict began, average auction prices had already risen from around $135,000-$140,000 to about $385,000, with some bids exceeding $1 million. The Authority emphasized that these prices reflected the urgency faced by particular vessels at particular moments, as well as broader shipping-market conditions and supply and demand. They did not mean that the canal had suddenly raised its official toll to $1 million. By August, this dynamic had intensified further. According to the Financial Times, the average auction price had reached about $1.1 million.
This points to a particularly important situation now confronting the Panama Canal: disruptions at other major nodes in the global shipping network are pushing more vessels toward the Panama route. At the same time, weather conditions are reducing the amount of transportation capacity the canal can reliably provide. The global shipping system can usually absorb the failure of a single chokepoint because cargo flows can be redirected to alternative routes. But when multiple chokepoints come under pressure at the same time, those so-called "alternative routes" themselves become congested and expensive.
Spend Millions of Dollars, or Take the Long Way Around?
Water shortages do not affect all commodities equally. Scarce transit capacity will be allocated through prices to the cargoes that can best afford to pay for it. Consider three types of cargo.
Containers
Container ships may carry electronics, auto parts, clothing, machinery, and retail goods.
The value of these goods per unit of weight is usually relatively high, spreading the transit cost across the value of the cargo is more justifiable. As a result, some container operators have a very high willingness to pay for timely transit. There was even a recent case in which a container ship reportedly paid about $4 million to secure an earlier passage. That figure should not be interpreted as a standard transit fee for ordinary vessels, but it shows that the value of time can become extremely high under certain circumstances.
Grain
In fiscal year 2025, about 25.1 million metric tons of grain passed through the Panama Canal. Grain, however, has a very different economic profile from containerized cargo. The value per unit of weight is much lower. Once the price of an auctioned transit slot rises above $1 million, spreading that cost across the value of the cargo may be much harder to justify than it would be for high-value containerized goods. Vessels carrying grain may therefore be more willing to wait or reroute and accept a longer voyage.
Liquefied Petroleum Gas (LPG)
The United States is an important supplier of propane to Asia, and the U.S. Gulf Coast to East Asia is a major export route.
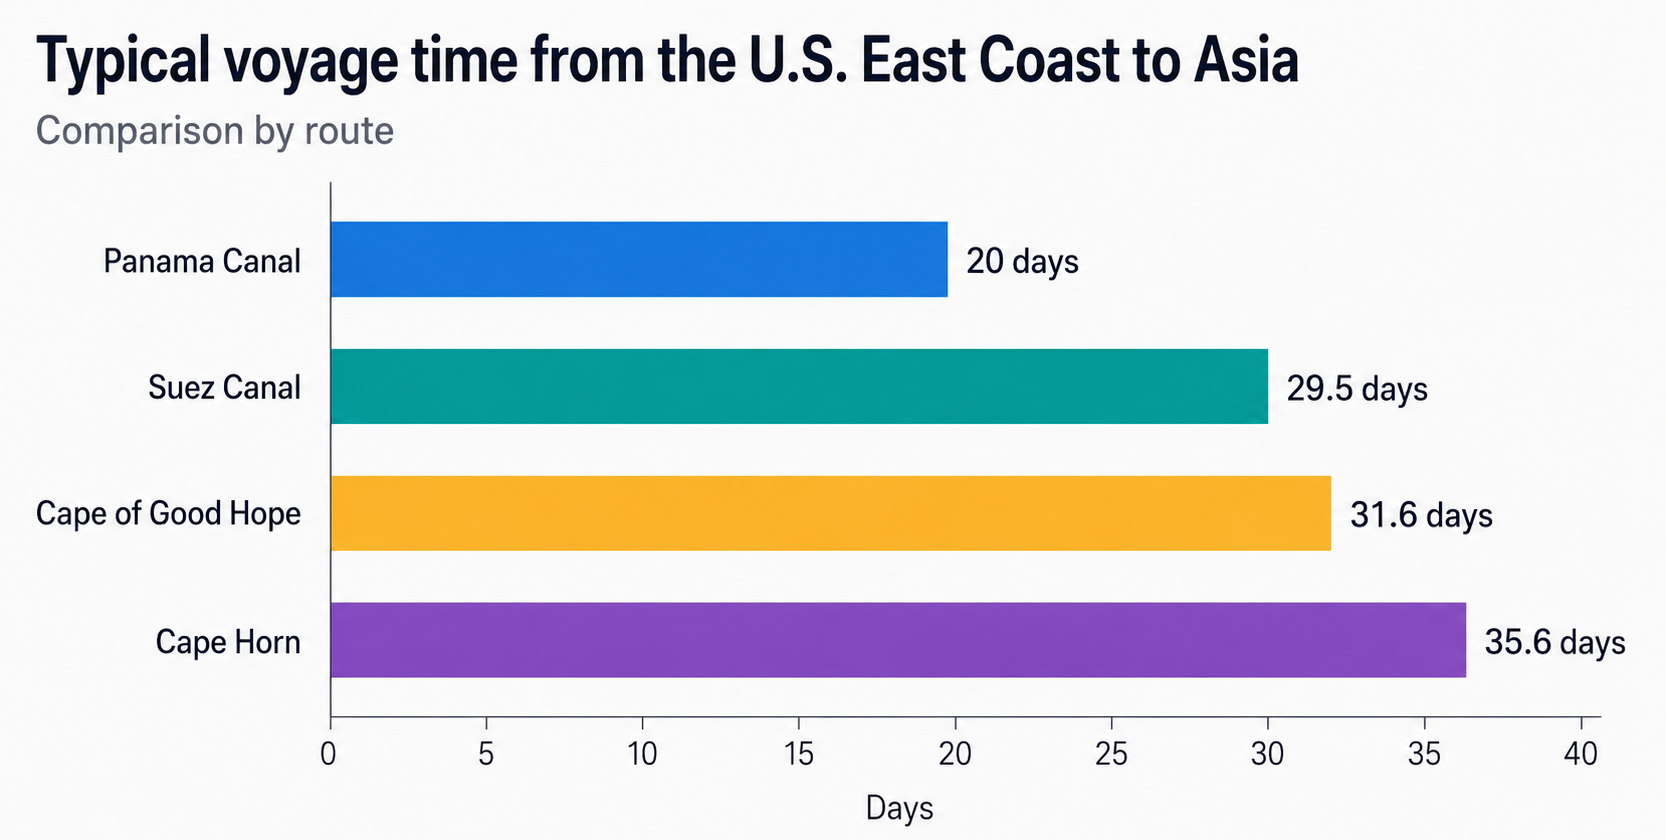
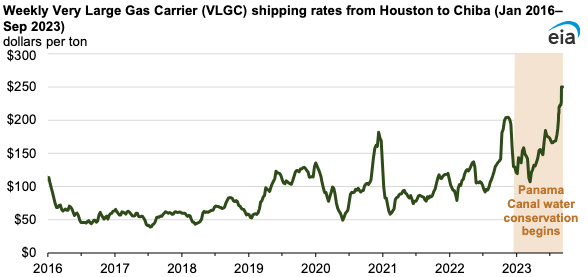
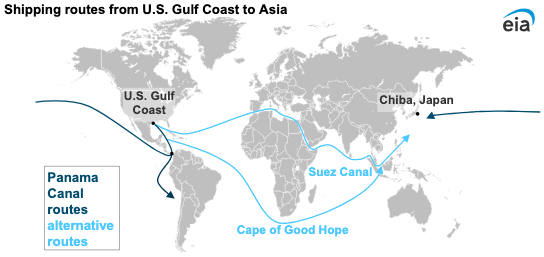
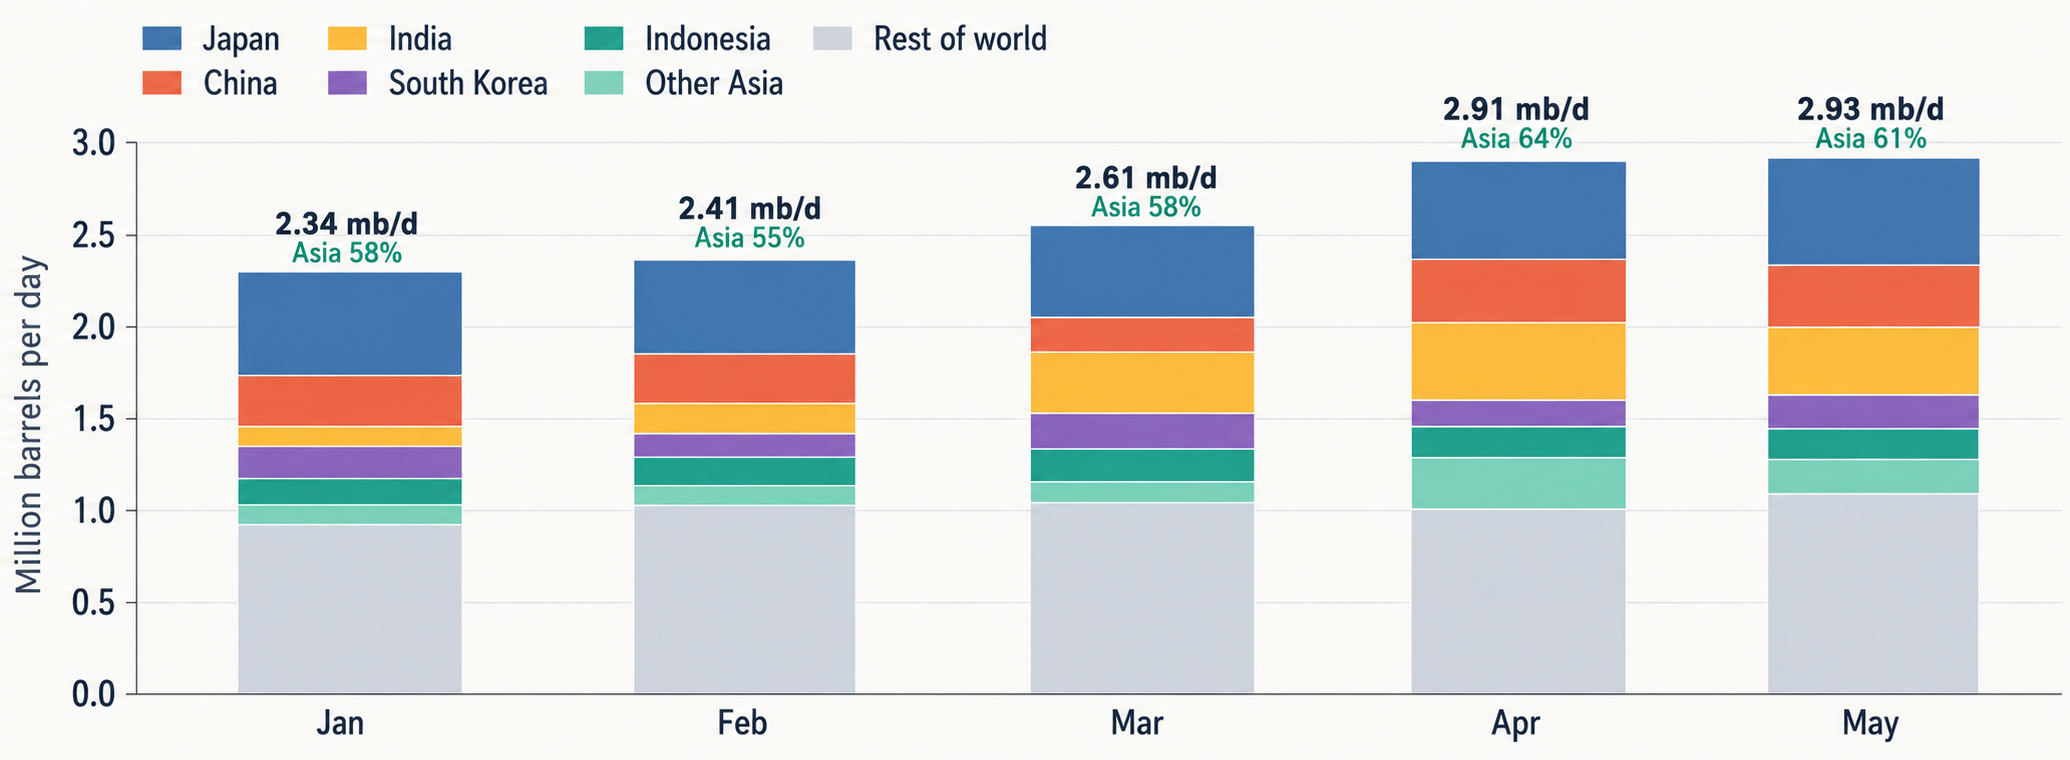
The U.S. Energy Information Administration (EIA), notes that a voyage from Houston to Chiba, Japan via the Panama Canal typically takes close to half the time required to sail across the Atlantic and then through the Suez Canal. At the height of the Panama Canal drought in 2023, waiting times for Neopanamax vessels at one point reached at least 17 days, while VLGC freight rates from Houston to Chiba rose to $250 per metric ton in late September, the highest level since the data series began in 2016. By 2025, the Panama Canal was once again carrying more than 95% of U.S. LPG exports to Asia, up from around 80% during the 2023-2024 drought period. This means that water shortages in Panama can feed into the Asian petrochemical supply chain through freight costs, because propane is not only a fuel, but also a petrochemical feedstock.
U.S. LPG monthly exports by destination, Jan - May 2026 (Source: U.S. EIA Exports by Destination, released 31 Jul 2026. LPG = propane + normal butane + isobutane. Other Asia = Bangladesh, Malaysia, Maldives, Philippines, Singapore, Taiwan, Thailand and Vietnam. Values may not sum exactly because EIA rounds each series independently.)
These three examples show that drought does not simply make "all goods a little more expensive". It can also change the composition of cargo moving through the canal. High-time-value, high-unit-value cargoes can bid low-value, less time-sensitive cargoes out of scarce transit capacity. In economic terms, this is a form of capacity rationing by willingness to pay. So if severe water shortages return in the future, the first thing to watch may not be a collapse in the total number of ships transiting the canal, but which types of cargo are still willing to stay.
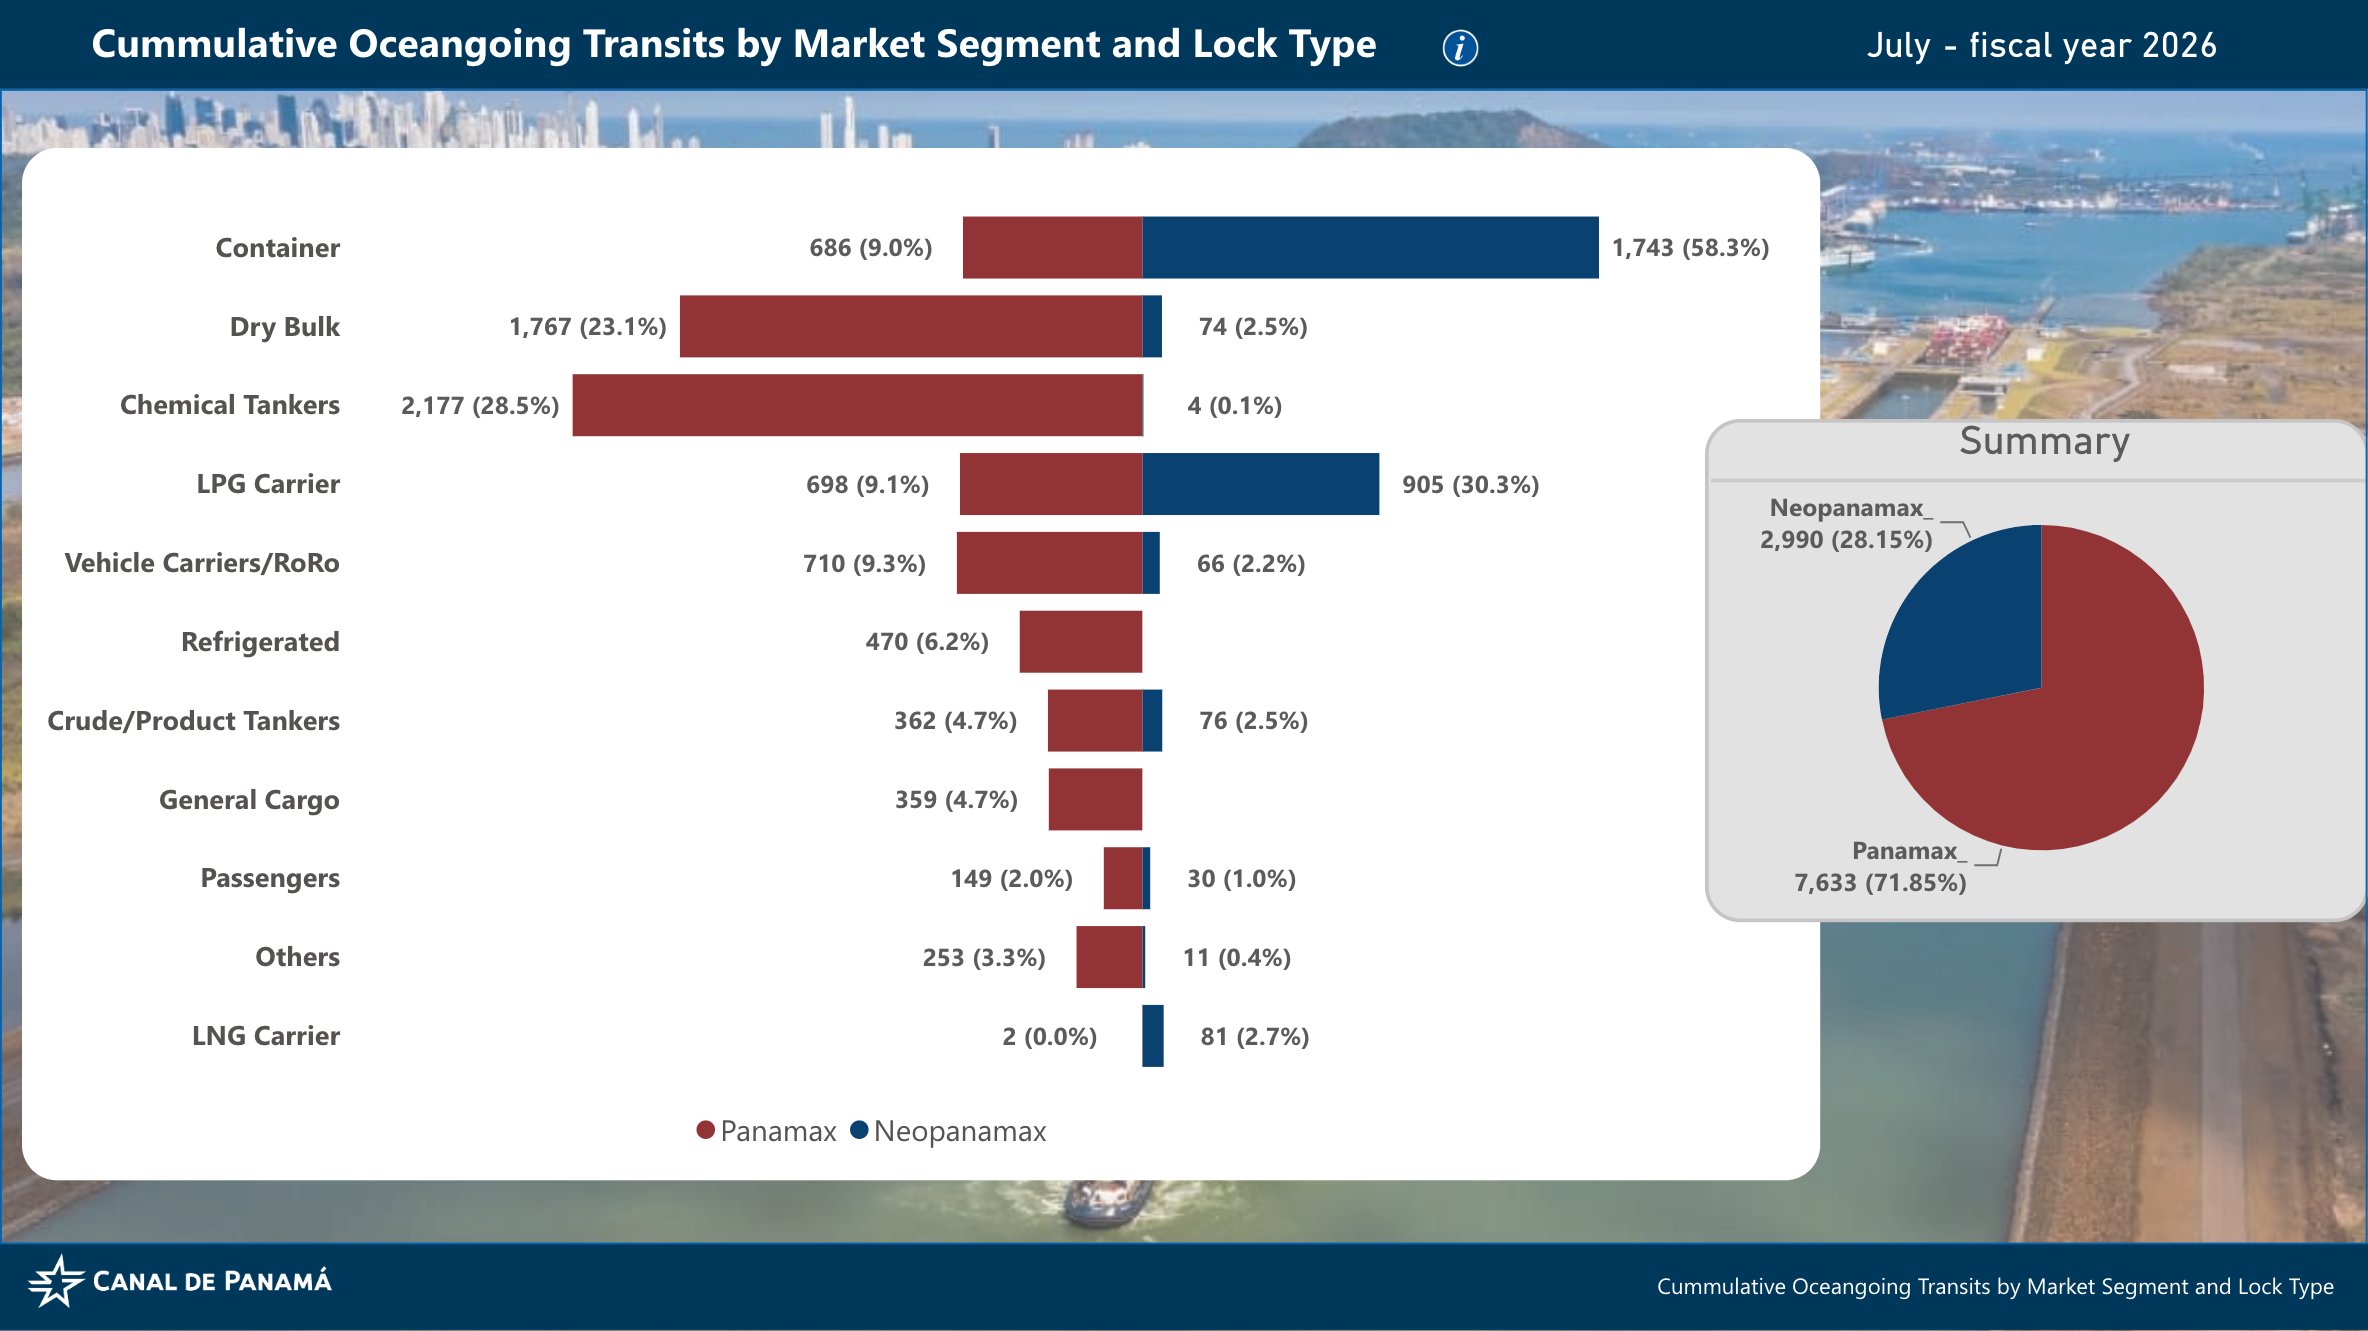
Cumulative Panama Canal ocean-going transits by market segment and lock type, October 2025 through July 2026. (Source: Panama Canal Authority)
Should the Water Go to Ships, or to People?
If the Panama Canal used seawater, the issue would be primarily a commercial one. But it uses freshwater. Gatún and Alhajuela Lakes are also important sources of drinking water for Panama’s residents. The Panama Canal Authority states that more than 50% of Panama’s population depends on this lake system for water supply.
Every severe drought therefore forces the government to confront a fundamental resource-allocation question: what is the best use of one cubic meter of freshwater? Should it be used to let a ship carrying tens of millions of dollars’ worth of cargo pass through the canal, or should it be stored for residents to drink?
This is one of the most fundamental differences between the Panama Canal and the Suez Canal. In Panama, the marginal water resource that supports transportation capacity is drawn from the same natural resource pool that supplies water for local residents.
As the population of Panama City grows, along with industrial and household water demand, the issue is no longer simply about whether rainfall is high or low. World Weather Attribution specifically notes that population growth, urban expansion, and aging water infrastructure with significant leakage are all adding pressure to the country’s water resources.
So, more precisely, the Panama Canal is not facing simply a drought problem. It is also facing a water balance problem.
Panama’s Solution Is a $1.6 Billion Reservoir
If water is the binding constraint, the most intuitive solution is to increase the amount of water that can be stored.
That is the idea behind Panama’s Río Indio reservoir project. In 2024, the Panama Canal Authority estimated that the core project would cost about $1.2 billion, with another roughly $400 million allocated to surrounding communities, bringing the total investment to about $1.6 billion. The Authority hopes the new reservoir will improve water-supply reliability and give the canal greater confidence in maintaining around 36 transits per day. In 2025, the Panama Canal Board formally designated the Río Indio Lake Project as one of the country’s top priorities for national water security. Its objective is not only to support canal operations, but also to secure water supply for more than half of Panama’s population.
But this raises another economically important point: there is no free resilience. A new reservoir means flooded land, community displacement, and changes to the local ecosystem. In 2025, affected communities filed a lawsuit with Panama’s Supreme Court challenging the project’s constitutionality. Reuters, citing Panama Canal Authority data, reported that around 2,500 people could be affected by the project.
So "solving the Panama Canal’s water shortage" is not simply a matter of spending $1.6 billion on an infrastructure project. The "resilience" demanded by global supply chains may ultimately require a farmer living in a Panamanian river valley to give up his land. That is a very real externality, but one that is often hidden from view when we talk about globalization.
Disclaimer: The content is for informational purposes only. You should not construe any such information or other material as legal, tax, investment, financial, or other advice. Nothing contained in this article constitutes a solicitation, recommendation, endorsement, or offer by the author(s) or any third party service provider to buy or sell any securities or other financial instruments in your or in any other jurisdiction in which such solicitation or offer would be unlawful under the securities laws of such jurisdiction. The author(s) report(s) no conflict of interest.
Three weeks ago, I wrote about Kalshi's newly filed airport flight-cancellation contracts. One issue stood out.
Kalshi had designated FlightAware as the primary source for settlement. Yet FlightAware's parent company, RTX, said that FlightAware did not participate in prediction markets and did not authorize its data to be used for that purpose. I ended that article by arguing that Kalshi would need to address the FlightAware issue to avoid a potential legal dispute.
On August 11, news broke that FlightAware had sued Kalshi over its use of FlightAware data and trademarks in flight-cancellation markets. The complaint was filed the previous evening, August 10, at 8:27 p.m. in the U.S. District Court for the Southern District of New York. The 45-page complaint names Kalshi Inc., KalshiEX LLC, Kalshi Klear Inc. and Kalshi Klear LLC as defendants. FlightAware also filed an emergency motion seeking court intervention.
From the complaint, FlightAware says Kalshi had opened a Personal AeroAPI account as early as July 14, 2022. It further alleges that on July 14, 2026, a Kalshi employee involved in market specifications and resolution created another FlightAware account using a Kalshi email address. FlightAware argues that these accounts were governed by its Terms of Use, Terms and Conditions and AeroAPI Personal License Agreement.
The complaint says its terms had already prohibited public or commercial use of FlightAware materials and limited free products, APIs and data to personal use. FlightAware then revised the terms on July 16 to make the point explicit, adding language prohibiting use in connection with betting, wagering, gambling, prediction markets and event contracts.
FlightAware cancelled Kalshi's Personal AeroAPI account on July 15 and sent a cease-and-desist letter. Kalshi responded on July 17 by denying that it had violated FlightAware's license or infringed its trademarks and arguing that references to FlightAware constituted nominative fair use. Kalshi subsequently added a disclaimer saying that its products had not been endorsed by FlightAware and that references to FlightAware were descriptive only.
FlightAware nevertheless proceeded to court. Its complaint contains six causes of action, including breach of contract, federal trademark infringement, injury to business reputation, federal unfair competition, unjust enrichment and New York common-law unfair competition.
It is seeking temporary, preliminary and permanent injunctive relief, damages, disgorgement of profits allegedly attributable to unauthorized use of its marks, restitution and other relief. It has also demanded a jury trial.
At this stage, none of those allegations has been proven. Kalshi will have the opportunity to answer them, and its correspondence already indicates some of the defenses it may raise.
On Tuesday, Kalshi revised how it references FlightAware, and FlightAware subsequently voluntarily dismissed the lawsuit. The dismissal could suggest that the two sides are discussing a potential resolution, although FlightAware retains the ability to bring the case again.
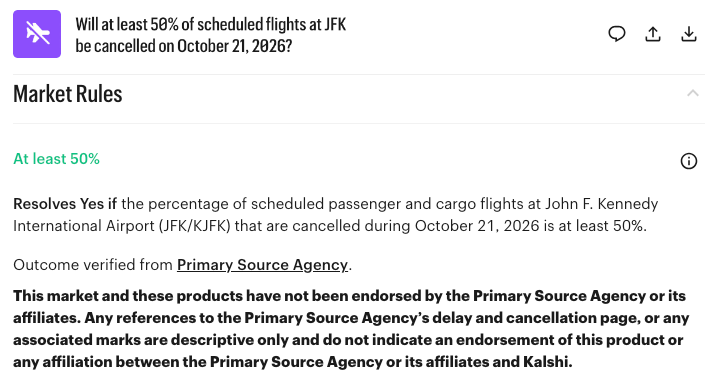
FlightAware is no longer explicitly identified in Kalshi’s flight-cancellation market rules, but the “Primary Source Agency” link still directs users to FlightAware.
This problem had already been looked at
This is not entirely new to the CFTC. In May, Cboe submitted a comment to the Commission containing an entire section titled "Source Agency Integrity and Settlement Conditions." Cboe noted that event contracts use a much wider variety of source agencies than traditional futures and argued that the Commission should provide guidance on what makes a source agency credible and reliable. It also recommended clearly specifying source agencies and what happens when settlement becomes ambiguous.
Then, on July 24, the CFTC's Division of Market Oversight issued Advisory Letter 26-22. In discussing settlement sources, the staff said DCMs should consider not only manipulation and reliability, but also the commercial acceptability, public availability and timeliness of the series used for cash settlement. "Commercial acceptability" suddenly looks much more important after FlightAware's complaint.
There is an even more interesting piece of evidence. In its own April 30 comment to the CFTC, Kalshi argued that robust event-contract resolution should include primary sources, secondary sources and fallback procedures that address source-agency failure and revisions. Kalshi further suggested the use of multiple independent Source Agencies so that no single provider becomes a point of failure, and said resolution should be structured around official, audited or widely observed data rather than proprietary or easily manipulated sources.
That principle is difficult to disagree with. FlightAware demonstrates why.
But is BTS really a fallback?
Kalshi's airport cancellation rules state that the contract switches to the U.S. Department of Transportation's Bureau of Transportation Statistics, or BTS, if FlightAware is unavailable or does not publish a usable figure.
The problem is that BTS is not a real-time flight-status service. Its Airline On-Time Performance database is a monthly dataset based on reports submitted by covered U.S. carriers. BTS says summary statistics and raw data are released with the monthly Air Travel Consumer Report, generally around 30 days after the end of the relevant month. More importantly, as of August 12, its public TranStats database contains data only through May 2026.
Kalshi's AIRPORTDELAY rules state that a contract must expire no later than one week after the end of the measurement period, with settlement normally occurring no later than the following day. The timing mismatch between contract settlement and public BTS data release creates doubts about how the contract will be settled.
How is this different from traditional futures?
Reliance on an outside source for settlement is not new to derivatives markets. Traditional commodity futures have done this for decades. A number of cash-settled contracts settle against price assessments produced by S&P Global Platts rather than against a price generated by the exchange itself. CME's FOB Santos Soybeans Financially Settled (Platts) Futures provides an example. The contract's final settlement is calculated using Platts price assessments, and the rulebook expressly states that the "Platts" trademarks have been licensed for use by CBOT.
This is an important distinction. Platts is a private, commercial data provider, just like FlightAware. Its assessments are not necessarily freely available to every market participant. But Platts is also explicitly in the business of producing benchmarks that financial and physical contracts can reference. S&P Global says Platts benchmarks underpin nearly 1,300 exchange-traded, cash-settled commodity futures contracts, and it maintains a dedicated function for licensing and exchange relationships.
The benchmark itself is also surrounded by an institutional framework designed for this purpose. Platts publishes detailed methodologies explaining how assessments are constructed, maintains procedures for identifying anomalous data and handling methodology changes, and reviews its methodologies at least annually.
In the case of event contracts, the organization in the middle may never have designed its product to serve as a financial benchmark. Its primary business may have little to do with derivatives markets, and it may never have agreed to assume the responsibilities that come with determining the payout of a financial contract. As event contracts become larger and more economically significant, merely identifying who reports the answer may no longer be enough. Exchanges may increasingly need to ask whether that organization has actually agreed to become part of the machinery that determines who gets paid.
Disclaimer: The content is for informational purposes only. You should not construe any such information or other material as legal, tax, investment, financial, or other advice. Nothing contained in this article constitutes a solicitation, recommendation, endorsement, or offer by the author(s) or any third party service provider to buy or sell any securities or other financial instruments in your or in any other jurisdiction in which such solicitation or offer would be unlawful under the securities laws of such jurisdiction. The author(s) report(s) no conflict of interest.
Liverpool's owners have confirmed a consortium featuring Amazon founder Jeff Bezos has concluded an agreement to buy a minority stake in the club.
It is understood Fenway Sports Group has sold around one third of the Reds in a deal first revealed by Sky News City editor Mark Kleinman, which values the club at more than $7bn (£5.2bn).
October Brent settled at $87.93 on July 31 and fell to $79.36 a barrel by August 4—a 9.7% decline—after Washington called off planned strikes and signaled that a deal with Tehran was close. By August 12, it had recovered to $88.98, slightly above where the comparable October contract started, after gaining 5% on August 10 alone as those diplomatic prospects faded again.
Kpler counted eight ships making the crossing through the Strait on August 11. The pre-war average was 130 to 140 a day. Whatever pushed Brent through this roughly ten-dollar round trip, it wasn’t a change in how much oil is actually leaving the Gulf, and according to EIA and IEA, this isn’t about to change once the diplomacy resolves either.
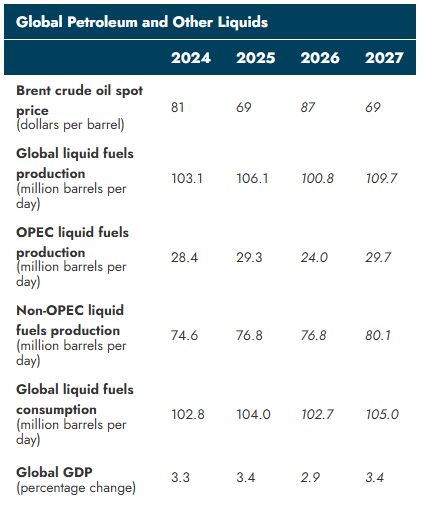
On Tuesday, the EIA put average global output near 100.8 million bpd against demand of about 102.7 million, with 600,000 bpd of Middle Eastern production expected to stay shut through 2027. The IEA followed a day later, cutting its 2026 forecast to 102 million bpd, a 4.3 million-bpd decline and sharper than the 3.7 million-bpd drop it saw a month ago.
Reopen the Strait, runs the logic, and the barrels come back quickly. Still, reopening Hormuz doesn’t equal restoring every shut-in field, terminal, and refinery.
The volatility suggests traders are repeatedly repricing between two paths: a rapid diplomatic reopening and a prolonged physical disruption.
Next Hormuz ceasefire headline hits. What does Brent do?
Drops hard and stays downResult
17.44%
Drops, then claws most of it back; like Aug 4-10Result
11.74%
Barely moves, it’s already priced inResult
39.86%
Rises; sell the newsResult
30.96%
281 Polls
EndedTBD
Reopening is not recovery
EIA’s own numbers, supply and demand from the same report, put the 2026 deficit at 1.9 million bpd. This gap already assumes Hormuz traffic begins recovering in September. A faster reopening would narrow it, but not erase it overnight: EIA still expects shut-in fields and damaged export infrastructure to return in stages into 2027.
EIA August 2026 STEO: A 1.9 million-bpd deficit in 2026 gives way to an implied 4.7 million-bpd surplus in 2027. Data are annual averages for total liquid fuels.
In July, on the strength of the June 18 memorandum of understanding between Washington and Tehran, the EIA assumed most shut-in crude would return to near pre-conflict levels by year-end, with the bulk of the rest clearing by the first quarter of 2027.
The July STEO, released on July 7 and based on the June 18 memorandum, was overtaken almost immediately as hostilities resumed. By August, the EIA expected about 600,000 bpd to remain disrupted through the end of 2027, even after most regional production and trade recovered earlier that year.
Hostilities resumed in early July, the Strait effectively closed again, and the August STEO pushed a chunk of that production offline through the end of 2027 regardless.
The IEA’s own forecast moved on the same timeline, milder in July and cut hard again this week, as the numbers above show.
The physical market is already tight
Brent’s prompt spread flipped back into backwardation in July, per the IEA’s own report, after North Sea Dated jumped $25.67 on the month to close near $97 and trade around $92 as of this writing.
Global observed inventories plunged 69 million barrels in July alone. Total stocks are down 410 million barrels, or 2.7 million bpd on average, since the war started in February. The Strategic Petroleum Reserve, at 298.7 million barrels, is sitting at a four-decade low.
This unwinds when barrels physically show up, but Gulf infrastructure hit since February doesn’t repair itself on a diplomatic timeline.
The bear case isn’t wrong, just early
Both agencies’ own 2027 numbers point to a glut, not a deficit, once the region does recover.
The IEA expects global supply to rebound by 8.3 million bpd to 110.3 million bpd in 2027, while demand grows by 2.4 million bpd. That produces a projected surplus of approximately 4.6 million bpd—conditional on de-escalation and the restoration of Gulf production. The EIA’s 2027 Brent forecast of roughly $69 reflects its expectation that supply will recover and inventories will rebuild.
Put simply, the deficit belongs to the near term. The real risk isn’t that Brent falls when Hormuz reopens. It’s that it falls too fast, before the barrels that take until 2027 to come back have actually come back.
Here’s what to watch next
The thesis holds if September’s STEO still shows at least 4 million bpd shut in during the fourth quarter, Gulf exports remain below 18 million bpd, observed stocks stay under 7.9 billion barrels and prompt Brent keeps at least a $1 premium over the next month.
It breaks if Gulf exports top 20 million bpd for four straight weeks, the EIA cuts fourth-quarter shut-ins below 2 million and inventories build by at least 30 million barrels. Five sessions of prompt Brent trading at a 25-cent discount would settle it.
One counter-signal arrived on August 12: U.S. commercial crude inventories rose 17.4 million barrels, driven largely by unusual import and export flows. One U.S. reporting week does not reverse the IEA’s global stock draw, but it complicates a purely one-directional tightness narrative.
As we argued in June, reopening Hormuz is a sequence rather than a switch. The August forecasts now put numbers on that delay.
The freshly dropped Consumer Price Index print delivered a collective sigh of relief across trading desks, with an inflation reading that was both fairly benign and free of a nasty surprise.
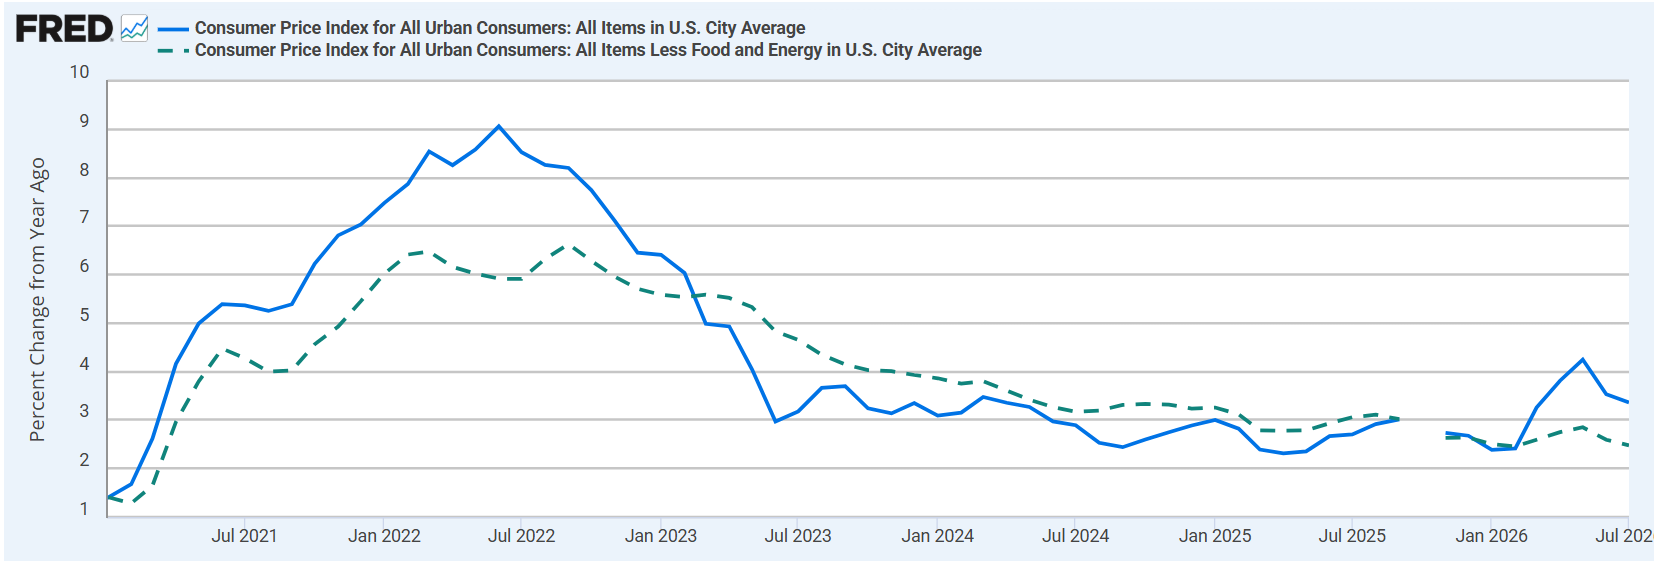
Headline CPI rose 0.1% in July, after falling 0.4% in June. Core CPI, which strips out food and energy, rose 0.2%, after sitting flat the month before. Both numbers landed exactly on the consensus forecast, the kind of nothing-happened print traders haven't gotten much of this year.
Year over year, headline inflation eased from 3.5% to 3.4%. Core slowed from 2.6% to 2.5%.
This makes it a mildly dovish report. For anyone trading a few weeks out, the data made it more difficult to justify an immediate September rate increase.
Where do you think September lands?
No change, the CPI print settles itResult
38.85%
25bp hike, three hawkish dissents still matterResult
29.86%
25bp cut, the labor data is the real signalResult
11.51%
Too close to call before more data landsResult
19.78%
278 Polls
EndedTBD
The details were soft, but not uniformly so
Shelter made the largest positive contribution to the monthly increase, even though the shelter index rose only 0.1%. And accounted for roughly two-thirds of the increase in the overall index. Within shelter, rent and owners’ equivalent rent each rose 0.3%, while lodging away from home fell sharply.
Energy prices declined 1.5%, led by a 2.9% fall in gasoline. Food rose a modest 0.1%, with grocery prices falling slightly even as food away from home continued to rise.
The report was not uniformly soft. Medical care rose 0.4%, airline fares jumped 2.2%, and used-car prices increased 0.4%. Core goods also showed some renewed upward pressure. Still, these pockets were not broad or powerful enough to flip the overall report hawkish.
The most important message from the Bureau of Labor Statistics release is that underlying inflation continued to cool on a year-over-year basis, although monthly core inflation increased from zero in June to 0.2% in July. And energy prices remained 14.7% higher than a year earlier.
Does a soft jobs report cancel out three hawkish votes?
Not entirely. This is the short answer, and it's why September is no longer a foregone conclusion although a hold remains the more likely outcome.
The Federal Reserve’s target range is currently 3.50%-3.75%. At its July meeting, the FOMC voted 9-3 to hold rates steady, and all three dissents wanted a hike.
This is a genuine hawkish bloc, not merely tough rhetoric, and it explains why a September hike still carries meaningful probability even after a friendly CPI report.
But the economic evidence since that meeting has weakened the case for tightening. Payrolls fell by an estimated 23,000 in July, and the two months before that turned out weaker than first reported, by a combined 103,000. Wages are still climbing at a 3.2% annual pace, and fewer people are participating in the labor force than were in January.
None of this proves the three dissenters were wrong in July, but it does mean that raising rates again in September would mean tightening into a labor market that's visibly losing altitude, a much harder case to make than it was a month ago.
Put together, inflation still runs hot enough to keep three voting FOMC members uncomfortable, and the labor market's soft enough to make expanding a three-member dissent into a majority for a hike a much tougher sell. Both things are true at once.
Fed funds futures implied roughly a 38%–40% probability of a September hike after the CPI release. My own working distribution is similar: about 65% for no change, 35% for a 25-basis-point hike, and only a negligible probability of a cut.
Where the 65/35 split might be leaning on the wrong question
Does a hold in September mean the meeting would be dovish? Not necessarily.
September comes with fresh economic projections. The Fed could leave rates unchanged while delivering a hawkish message through the statement, the dot plot and the press conference. Financial conditions could therefore tighten even if the target range does not change.
This creates a useful distinction between the settlement outcome and the macro outcome. A hold can win the bet and lose the trade.
Second, the benign July headline depended partly on falling gasoline prices. Energy is still up sharply over the past year, and renewed geopolitical pressure on oil could reverse this contribution in August. The Fed is more likely to look through a temporary energy shock than a broad demand-driven acceleration, but it will care if energy begins feeding into transportation, goods, services or inflation expectations.
The largest repricing may therefore come after one of the intermediate releases produces an outsized change in September expectations, rather than from the immediate CPI reaction.
The bottom line
July CPI was helpful to the doves but it was not an all-clear. The Fed’s preferred PCE index remained well above its 2% objective in June, three voting FOMC members supported a July hike, and another employment and inflation cycle will arrive before the September decision.
For the next few weeks, the better posture is to treat September as a live two-way market and update probabilities as the evidence arrives.
Incoming evidence
Likely September repricing
Core PCE at or below 0.2%,
weak payrolls, and August core CPI at or below 0.2%
The probability of a hold
could rise toward 75%-85%.
Mixed data, with core
inflation around 0.2%-0.3%
A hold likely remains
favored in roughly the 55%-70% range.
Core PCE or CPI at or
above 0.3%, stronger employment, or a renewed energy shock
A 25-basis-point hike
could become the favorite.
Very weak employment
combined with soft inflation
A hold remains the base
case; a cut becomes a non-zero tail risk, but probably not the central
outcome.
The principal dates are July PCE on August 26, the August employment report on September 4, August PPI on September 10, August CPI on September 11, and the FOMC decision on September 16.
Which release is most likely to move this before September 16?