Premier info portal for prediction markets. The start point of information market.
AI Speedrun - Meta's Zuckerberg says AI agent tech progressing slower than expected
Quick Take
HyperscalersLLMsAI InfrastructureMag 7AI Speed RunIndustry Pulse Semi News

AI Speedrun - Meta's Zuckerberg says AI agent tech progressing slower than expected

Zuckerberg’s AI Agent Reality Check: The Payoff Is Taking Longer

Economics & FinanceTech

Reuters (July 2)- Meta CEO Mark Zuckerberg told employees at an internal town hall that the company’s AI agent technology has not progressed as quickly as he expected. AI agents are automated systems designed to execute tasks on behalf of users. And they are central to the broader market belief that generative AI will eventually translate into real productivity gains.

Zuckerberg also said Meta’s recent reorganization was not as “clean” as it could have been and that executives miscalculated the timing of the changes. Earlier this year, Meta laid off about 10% of its global workforce and reassigned roughly 7,000 employees to AI focused teams which triggered employee pushback and morale concerns.

Do you think Ai Capex has Peaked?

Yes, it's time to take profits
66.67%
No, Big Tech has enormous potential
33.33%
Let me finish my reading first...
0.00%
3 Polls

Despite the slower progress, Zuckerberg did not signal a give up from AI. Reuters reported that he expects Meta to begin seeing more significant benefits from its AI investments within the next three to six months. Meta is projected to spend as much as $145 billion on AI infrastructure this year.

This is not a story about Meta abandoning AI. It is a story about timing.

The AI market has spent the past two years pricing in a rapid transition from infrastructure investment to application level productivity. Zuckerberg’s comments challenge that timeline. If AI agents are progressing more slowly than expected, the market ought to ask whether AI's payoff is being pushed further into the future.

That matters because Meta is not only spending on models. It is restructuring the company around AI, moving employees into AI workflows, and investing heavily in infrastructure. Reuters reported that Zuckerberg realized the shortcomings in Meta’s AI restructuring, while still emphasizing that the company was not fundamentally changing course on its AI push.

For investors, the tension is simple: AI infrastructure spending is immediate but AI agent revenue and productivity gains are still uncertain. If the benefits arrive within three to six months, as Zuckerberg expects, the current investment cycle may look justified. If progress remains slow, investors may become more skeptical of whether AI agents can deliver enough near-term value to support AI’s rising Capex.

Will Meta’s AI agents show meaningful business impact within the next 3–6 months?

Yes
0.00%
No
0.00%
Only limited impact
100.00%
Too early to judge
0.00%
1 Polls

This is also why the Reuters report should be read together with the Bloomberg report on Meta’s potential cloud business. If AI agents are slower to mature while Meta is also exploring ways to sell excess compute, the market debate will become sharper: is Meta simply creating more revenue channels for AI infrastructure or is it looking for a backup monetization path because internal AI use cases are not scaling fast enough?

Meta’s AI Cloud Pivot: Monetization Strategy or Overbuild Signal?
Bloomberg (July 1) - Meta is reportedly developing a cloud infrastructure business that would sell access to AI computing power and models to outside customers. The plan could put Meta into a new competitive lane against cloud leaders such as Amazon Web Services, Microsoft Azure, and Google Cloud. The business would

Source:

  1. Meta's Zuckerberg says AI agent tech progressing slower than expected, July 2, 2026 https://www.reuters.com/business/zuckerberg-says-ai-agent-development-going-slower-than-expected-2026-07-02/
  2. Bloomberg: Meta Is Planning a Cloud Business to Sell AI Computing Power, July 1, 2026 https://www.bloomberg.com/news/articles/2026-07-01/meta-is-building-a-cloud-business-to-sell-excess-ai-compute
Macro & Micro Compass - June Jobs Miss: How Will It Affect the Interest Rate Cycle?
Features
EconomicsLabor MarketMacroeconomicsMacro & Micro Compass

Macro & Micro Compass - June Jobs Miss: How Will It Affect the Interest Rate Cycle?

The June jobs report gave markets a softer labor signal than the headline unemployment rate suggests.

Economics & Finance

U.S. Nonfarm Payrolls rose by just 57,000 in June, far below the 110,000 expected by economists polled by Reuters (July 2). April and May payrolls were also revised down by a combined 74,000, turning the seemingly stable labor market into a softer one. Reuters reported that markets responded by dialing back expectations for a near-term Fed rate hike, with the odds of a September hike falling to about 60% from roughly 75% before the report.

The FRED data will make the miss easier to understand. FRED’s PAYEMS series shows total Nonfarm Payroll employment rising from 158.927 million in May to 158.984 million in June, matching the 57,000 monthly gain reported by Reuters, still positive job growth, but it is far below the kind of payroll strength that would make another rate hike easy to defend.

After June NFP, How Many Times Do You Think US Will Raise Interest Rates in 2026?

Noway, they will cut the rate
25.00%
No change, the range from 3.5% to 3.75% is fine
50.00%
Once is enough
25.00%
Twice or even more
0.00%
4 Polls

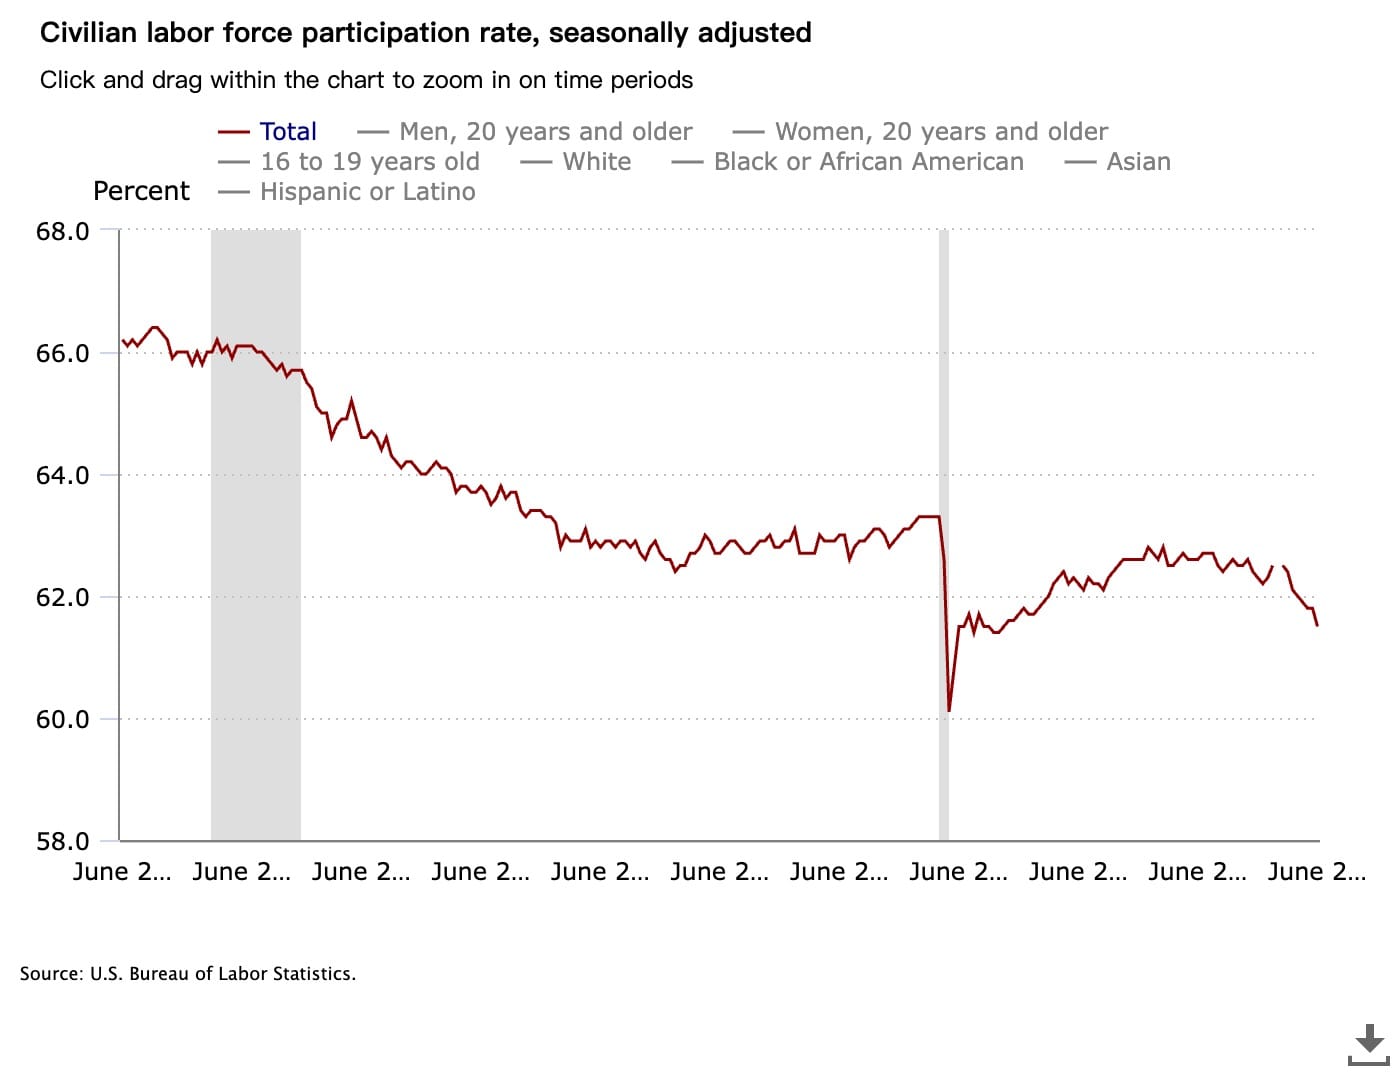
The complication is that unemployment did not rise. FRED’s unemployment rate series shows U-3 falling from 4.3% in May to 4.2% in June. On the surface, that weakens the argument of the labor market has cracked. But the labor force participation rate fell from 61.8% to 61.5%, matching Reuters’ point that the lower unemployment rate partly reflects people leaving the labor force rather than a clean improvement in hiring conditions.

Sourced: https://www.bls.gov/charts/employment-situation/civilian-labor-force-participation-rate.htm

Therefore the interest rate cycle is complicated to read. The June report makes a July hike look harder to justify, but it does not automatically bring rate cuts back into the base case. Inflation is still the Fed’s other problem. FRED’s CPI series shows the all-items CPI index rising from 332.407 in April to 333.979 in May, while the next CPI release is scheduled for July 14. In other words, the next inflation print may matter more for the Fed than the jobs miss alone.

Retailers inventories to sales ratio offers another, more lagged check on demand conditions. FRED’s retailers ratio fell from 1.28 in January to 1.26 in April, meaning retailers were not yet showing a clear inventory overhang relative to sales. That matters because a rising inventory to sales ratio can point to weaker demand and future pressure on production and hiring. But because the latest data only runs through April, it should be treated as a background signal, not direct evidence of the June labor slowdown.

Which data point matters most for the Fed’s next move?

The 57,000 payroll gain
0.00%
The 4.2% unemployment rate
0.00%
The drop in labor force participation
0.00%
The next CPI report
100.00%
1 Polls

This fits the warning in our June NFP preview: a payroll number below 100,000 would make the slowdown story harder to ignore. That is now exactly what traders have to price. The question is no longer whether June was soft. It was: whether one soft jobs report is enough to interrupt the Fed’s projected rate-hike path for the rest of 2026.

June NFP Report: Stability Is Priced In, But Is It Fully Supported by the Data?
Markets are pricing June NFP around 100,000-150,000 jobs, reflecting economist forecasts and recent labor data, as attention turns to how incoming prints align with current expectations.

The cleanest setup now is through a comparison of three elements: payroll momentum, participation adjusted labor weakness, and the next CPI report. If inflation cools, June NFP could become the report that pushed the Fed toward a longer pause. If inflation stays hot, the Fed may still treat this as a soft labor print, not a cycle-changing event.

Source:


1. U.S. job growth slows sharply in June; labor force participation rate at more than 5-year low, July 2,2026 https://www.reuters.com/world/us/us-job-growth-misses-expectations-june-unemployment-rate-falls-42-2026-07-02/

Commodity Desk - Lithium Rally Is No Longer Just About EVs, and the Market Hasn’t Fully Priced in Why
Analysis
EnergyIndustry PulseCommodityCommodity Desk

Commodity Desk - Lithium Rally Is No Longer Just About EVs, and the Market Hasn’t Fully Priced in Why

Lithium's rally already reflects a shift from EV to storage demand, but the market hasn't fully priced in what a widening 2026 supply deficit could mean next.

Economics & Finance

For most of the last decade, "how are EV sales doing" was a decent enough proxy for "how is lithium demand doing."

But lithium carbonate prices have risen 130% since June 2025. Over roughly the same stretch, EV sales weakened sharply in the US, Canada, and China at key moments.

Those two facts look like they should point in opposite directions. They don't, because EV sales stopped being the whole story for lithium demand a while ago, and the market's own forecasters are already saying so.

The clearest evidence sits inside one report. BloombergNEF's June 2026 outlook showed slowing EV growth in major markets while raising its 2025-2035 stationary storage battery demand outlook by 27%.

Traders still pricing lithium off EV sales alone are reading half of this report, so let’s give the EV side of this story its due before explaining why it’s the wrong lens.

Do you think lithium's rally reflects real fundamentals, or is it getting ahead of itself?

Real fundamentals, storage demand justifies it
50.00%
Ahead of itself, still mostly speculative
50.00%
Too early to tell
0.00%
2 Polls

EV demand fell hard in its largest markets

EV demand genuinely fell off a cliff in several key markets, and it fell for a reason that should spook anyone using it as a demand signal: policy got pulled.

The IEA's Global EV Outlook, published May 20, found US EV sales fell 45% in the fourth quarter of 2025 versus a year earlier, timed almost exactly to the federal tax credit's expiration. The IEA links the drop directly to the end of US EV tax credits and broader policy shifts.

It’s not a one-off American policy accident either, because Canada ran the same experiment and got the same result. Its EV rebate program ended, and EV share of new car sales fell from nearly 17% in 2024 to 11% in 2025.

Two governments, two different countries, same experiment, same result, which is a pretty strong hint that marginal EV demand remained highly policy-sensitive, rather than fully organic.

This weakness is concentrated, but large enough to affect global numbers. Global EV sales fell 3% year over year in the first quarter of 2026, with North America down 27% and China, still the largest EV market, down 21% year to date despite a partial recovery in March.

BloombergNEF cut its long-term EV adoption outlook for the second year running, citing the US and China slowdowns directly.

Storage becomes the new trade

BloombergNEF's June 2026 report, the same one that cut the EV forecast, also raised its 2025-2035 stationary storage demand outlook by 27% over its prior estimate. Both changes came from the same team, in the same report.

Reuters, using UBS figures, put 2026 lithium demand growth from energy storage at 55%, following 71% growth in 2025. Guotai Junan estimates storage's share of total lithium demand rose from 23% in 2025 to a projected 31% in 2026.

Put simply, a trader reading lithium demand off EV sales alone is missing close to a third of total demand, and that third is growing faster than the EV share is shrinking.

Is this just one good sector covering for one bad sector?

Averaging a weak sector against a strong one only works if the two move for the same reasons. They don't here. EV sales are consumer decisions, and consumer decisions bend hard around tax credits and interest rates, which is exactly why the end of US tax credits coincided with a 45% year-over-year drop in Q4 2025 US electric car sales.

Grid-scale storage runs on utility buildouts and the power appetite of AI data centers, decisions made on multi-year infrastructure timelines that don't care what happens to a tax credit in Washington.

This gap is how storage becomes the blind spot.

Chinese lithium carbonate spot prices bottomed at roughly 58,400 yuan per tonne in June 2025 and rose to about 134,500 yuan per tonne by December, a 130% increase. Most happened before Reuters published its June 2026 report on producers shifting toward storage, so the price moved ahead of the mainstream coverage, which means the trade was not built entirely on new information becoming public.

Morgan Stanley projects an 80,000-tonne lithium carbonate deficit for 2026. UBS projects a smaller 22,000-tonne deficit. Both are a reversal from the roughly 61,000-tonne surplus estimated for 2025.

Albemarle, the world's largest lithium producer, reported its energy storage segment growing 117% year to date. This is a current-year number, not a forecast.

But even the forecasts are still catching up. Fastmarkets raised its own 2026 average lithium carbonate price forecast to $23.80 per kilogram in a report published this June, up from $17.40 per kilogram just months earlier, roughly a 37% upward revision to its own number.

When the agency that prices industry contracts is revising its 2026 call upward mid-year, it’s a direct sign the deficit wasn't fully reflected in prices even a few months ago, and the catch-up may not be finished.

Does this change who captures the upside?

This does not automatically change who captures the upside. Processing is still dominated by low-cost Chinese producers, so G7 leaders agreed last month to coordinate on Western lithium and nickel supply. Rising demand does not automatically help a Western producer if the margin still sits downstream, in processing capacity mostly outside the West.

Producers with less exposure to this bottleneck are in a different position. Australian hard-rock miners like Pilbara may benefit more directly from higher spodumene demand, but they still depend on downstream processing economics.

The question industry executives keep putting to Western governments is the uncomfortable one: what are they actually willing to pay for supply security, because so far, nobody's paid the bill.

Here’s what to watch next

Watch whether 2026 storage demand growth actually lands near UBS's 55% estimate, since the whole re-rating case rests on that number showing up in reality, not just in a forecast.

Next trigger is whether the Morgan Stanley and UBS deficit calls survive restarting supply, since higher prices are already coaxing idled Australian and Chinese capacity back online. If this capacity returns quickly, the Morgan Stanley and UBS deficit figures could narrow before they show up in price, taking pressure off the rally.

It’s interesting to see if G7 coordination on Western processing turns into anything concrete. A joint statement without follow-through would leave them exposed to Chinese processing costs regardless of what happens to demand, with even the price forecasters still adjusting upward to catch up to it.

The bottom line

At first glance, lithium still looks like an EV story running out of road, but this only holds if you think demand is still one number.

It isn't. It's two curves that stopped moving together, one shrinking for policy reasons, one accelerating for infrastructure reasons, sitting in the same forecast from the same analysts.

Traders still pricing lithium off the EV number alone are reading half the spreadsheet, and the other half has already started moving.

Which of these would most change your view on lithium from here?

2026 storage demand growth actually hitting the 55% estimate
0.00%
Idled Australian/Chinese supply coming back online faster than expected
100.00%
G7 coordination on Western processing turning into real investment
0.00%
Nothing, I think this is already priced in
0.00%
1 Polls

Sources:

  1. IEA: Global EV Outlook 2026
  2. BloombergNEF: Electric Vehicle Outlook 2026
  3. Reuters: Lithium producers bet on battery storage as demand shifts beyond EVs
  4. Reuters: Energy storage boom strengthens demand outlook for beaten-down lithium
  5. Electrek: Global EV sales data, Q1 2026
  6. Seeking Alpha: Albemarle energy storage segment growth data
  7. Panorama Minero: Fastmarkets interview on price forecast revisions

 

Rules & Mandates - Avoids Trump's July 4 Tariff Deadline: Why "De-Escalation" Is the Wrong Read
Analysis
EconomicsCommodityGeopoliticsRules & Mandates

Rules & Mandates - Avoids Trump's July 4 Tariff Deadline: Why "De-Escalation" Is the Wrong Read

A look at what the EU-US tariff deal actually locks in, why markets are reading it as de-escalation, and why the underlying trade risk hasn't gone away for the companies caught in the middle.

Economics & FinancePolitics

The EU beat the clock. On June 25, the Council of the EU formally adopted the regulations implementing its tariff commitments under the EU-US trade agreement, and as of July 1, the bloc has eliminated remaining duties on US industrial goods and opened preferential access for a range of US agricultural and seafood products.

The headline read is relief: deadline avoided, tariffs down, transatlantic trade stabilized.

But now the question is whether "de-escalation" is the right word for a deal that only exists because of a threat, is still full of trapdoors, and leaves the sector most likely to derail it, steel and aluminum, still bleeding.

Do you think the EU-US tariff deal is genuine de-escalation or a fragile truce?

Genuine de-escalation, the risk is largely resolved
20.00%
A fragile truce; the risk just moved, not disappeared
20.00%
Too early to tell
60.00%
5 Polls

Why the de-escalation read makes sense

Tariffs on US industrial goods are eliminated outright, and the European Commission estimates the change saves EU importers and consumers around €5 billion a year. Both sides describe it as a multi-year framework running through 2029, with a built-in review before it expires.

But the whole point of the July 4 deadline was to pressure the EU into implementing what had already been negotiated the previous August.

When Trump warned tariffs would jump to much higher levels if the EU did not act, the EU acted. This is not pure de-escalation; it is coercive leverage working as Washington intended.

Here's where the risk case gets stronger

The de-escalation read leans on treating "deal signed" as "risk resolved." But the deal's own text argues otherwise.

The agreement keeps a 15% all-inclusive tariff cap, but it also gives the European Commission explicit power to suspend tariff preferences if US tariffs on steel and aluminum derivative products stay above that cap past set checkpoints, with a Commission report due to Parliament and Council by December 1, 2026. Layered on top of that is a separate safeguard mechanism letting Brussels investigate and counter import surges that threaten serious harm to EU industry or agriculture.

Neither of those provisions is decorative, and neither is hypothetical. EU steel is still paying the full 50% US tariff, deal or no deal, because steel and aluminum were carved out of the 15% cap from the start.

Eurofer, the EU steel industry association, has published the damage: EU steel exports to the US fell 34% in the three quarters after the tariff hike to 50%, from 2.93 million tonnes to 1.94 million tonnes, and the industry has said plainly that the trade agreement is worth nothing for steel producers until this is actually fixed. It is a cost being paid today, while the "de-escalation" headline runs.

Brussels is not just waiting on Washington here, either. The EU brought in its own new steel safeguard on July 1, a tariff-free quota capped at 18.3 million tonnes a year with a 50% duty above it, applied to all trading partners.

This follows the EU's October 2025 move toward a replacement steel safeguard, aimed at preventing diverted steel from flooding Europe as US tariffs redirected trade flows. In other words, it's one side's tariffs generating spillover that the other side has had to build new defenses against.

Why this matters more for companies than for headlines

The first reason is that preferential access is not the same as permanent access, and the suspension clause doesn't stop at the disputed products. Duty-free treatment on US industrial goods and preferential terms on farm and seafood products are conditioned on a mechanism the EU can suspend, and this mechanism reaches across the broader preference package, not just steel and aluminum.

Companies budgeting multi-year input costs around July 1 pricing, or firms in the "safe" industrial lane who assume this doesn't touch them, are underwriting a policy that can change over a dispute in a completely different sector.

The second is timing. Capex decisions with multi-year payback windows now depend on two separate clocks: whether Washington resolves the metals dispute before the end-2026 checkpoint, how the Comission frames the issue in its December 1, 2026 report, and whether an EU industry group successfully invokes the safeguard clause before then. Either one moving can change the cost basis a multi-year investment was built on.

What to watch next: Three triggers to keep an eye on

The steel and aluminum clock. Watch whether US tariffs on the affected steel and aluminum derivatives come down to 15% or below before the deal's end-of-2026 checkpoint. Right now they're still at 50%, which is expected under the deal as written, but if that hasn't changed by the deadline, the EU gains a suspension option it doesn't currently have.

Next, watch whether the safeguard mechanism is actually invoked over an agricultural import surge. The mechanism existing does not prove fragility on its own, but the first attempt to use it will.

Finally, watch whether industry pushback spreads beyond steel. Eurofer has already gone on record saying the deal is worth nothing for steel producers until the tariff issue is fixed, so the real signal is whether farm groups or other sectors start making the same complaint.

The better way to read this deal

At first glance, this looks like a story about a deadline getting cleared. This is only the surface-level read.

What is actually being priced is whether “signed” means “settled.” The agreement's own design with conditional caps, suspension triggers, and an unresolved metals dispute parked on a calendar is itself evidence that both governments expect to renegotiate risk, not that risk is gone.

The de-escalation read says the truce holds. The better read says the truce has a built-in test at the end of 2026, and right now nothing suggests steel and aluminum are on track to pass it.

Which of these would most change your read on this deal?

US steel/aluminum tariffs actually coming down before the end-of-2026 checkpoint
100.00%
The EU invoking its safeguard clause over an ag import surge
0.00%
Industry pushback spreading beyond steel to other sectors
0.00%
Nothing, I think this settles either way
0.00%
1 Polls

Sources:

  1. APNews: EU issues new steel and e-commerce regulations to reduce trade imbalance with China
  2. CNBC: Tariffs: Trump threatens EU if no trade deal is signed by new deadline
  3. European Commission: The EU-US trade deal: Restoring stability and predictability
  4. Iowa Farm Bureau: U.S. farm exports gain ground in new EU trade deal
  5. Lexology: EU: Update on the EU-US Tariff Agreement
  6. NBC News: E.U. hits the brakes on U.S. trade deal after Trump threatens 15% global tariffs
  7. Sullivan & Cromwell: EU Implements Tariff Commitments Under the EU-U.S. Trade Deal
  8. The Express Tribune: European Parliament approves long-delayed EU-US trade agreement
Volts to Intelligence - Next AI Energy Trade: More Power VS More Value per Watt
Analysis
Capital MarketsEnergyAI PowerAI InfrastructureIndustry PulseVolts to Intelligence

Volts to Intelligence - Next AI Energy Trade: More Power VS More Value per Watt

Brief summary of "Why the world's biggest battery maker isn't worried about AI's energy demand" and extended analysis

Economics & FinanceTech

June 24 (World Economic Forum) argued that AI data centers should not be treated just as a electricity drains, but also a flexible energy system asset. It may reshape power price, grid investment, battery demand and even AI infrastructure evaluation.

Data centre electricity use surged in 2025, even with tightening bottlenecks driving a scramble for solutions
Summary: A report from IEA shows that data center electricity use surged in 2025, turning power access into one of the most important constraints on the AI boom. The AI trade has usually been framed around chips, models and capital. But the International Energy Agency’s latest report points to

The market debate around AI energy demand is moving from “Can the grid supply enough electricity?” to “Who pays for the grid, storage and flexibility needed to make AI growth possible?” This matters to utilities, battery makers, natural gas producer, clean energy developer and any investor pricing the next phase of AI capital expenditures.

By 2030, what will matter more for AI companies? (select all that apply)

Securing more elecricity
46.15%
Lower chips cost
15.39%
Build better models
30.77%
Get more value from each unit of computer
7.69%
8 Polls

Robin Zeng, Founder, Chairman and CEO of Contemporary Amperex Technology (CATL) claimed that data center energy demand is not large enough to overwhelm a mature grid, at least in China. In his view, the harder question is not absolute power supply, but how that power is sourced, stored and managed. Also a broader idea has been highlighted: data centers may eventually become flexible grid assets. Buying power when prices are low, using storage to smooth demand and may returning power or flexibility back to the system.

Therefore the AI energy debate is shifting from whether data centers can get enough electricity to whether companies can turn that electricity into measurable productivity, lower operating costs and durable economic value.

Before, the basic logic underlying the demand of AI energy is: more models then more data centers equal more electricity. But the phase next will be around yield. Because if every new megawatt of AI power only produces more experiments, duplicated workflows and higher cloud bills, investors or even the whole marker will query weather the AI CapEx cycle is being mispriced.

Regulation in China dictates that all new data centres must employ 80% renewable energy, a situation that is accelerating research into grid stability and battery technology, with energy storage a key issue.

Thus, AI’s energy cost is no longer just a utility bill. It is becoming part of operating strategy. Robin Zeng said CATL is already using AI systems to buy electricity that generating electricity-bill savings of about 30%. 

According to Asia’s Human-led AI Opportunity(June 2026) – 77% of organizations in Asia have adopted advanced AI, but fewer than one-third report achieving widespread and sustained value. Only 20% have reconfigured end-to-end processes around AI, and just 8% have adjusted job roles or decision responsibilities accordingly.

That means Asia is not lacking AI enthusiasm. It is lacking conversion. Many organizations are buying AI capability before they have redesigned workflows, accountability structures and decision rights. In other words, AI adoption is moving faster than the business systems needed to make AI productive.

This is a strong market signal, as it makes the energy debate more financial than it first appears. If AI infrastructure keeps expanding but companies fail to redesign their workflowsIf AI infrastructure keeps expanding but companies fail to redesign their workflows, electricity demand will rise faster than AI returns. That would make data center power a cost center not a productivity engine.

In the past several years, market is pricing the physical AI stack: semiconductor, data center, cooling, storage, grid connection etc. But the next evaluation gap may come from operational stack, which company can redesign work quickly enough to run AI infrastructure into AI operational leverage.

WEF’s separate analysis of AI investment points in the same direction. It argues that many large organizations have not yet seen the returns as they expected from AI spending, not because the technology failed, but because investments often went to the wrong layer. When AI used as a simple productivity assistant may increase efficiency of individual workers but hard to compress the entire workflow. The real value is in redesigning multi-step processes across operations, risk, supply chains and regulated decision-making.

That distinction is crucial for markets. If AI remains a tool layered on top of old processes, companies may face rising energy, software and cloud bills without corresponding productivity gains. If AI is embedded into core workflows, the same electricity cost can support lower cycle times, fewer errors, faster risk review and higher operating margins.

Asia is a particularly important test case because it combines industrial scale, dense digital adoption, large labour markets and very different national AI strategies. WEF notes that China is pushing AI into industrial transformation; Japan is emphasizing reliability and institutional assurance; Singapore is pairing AI investment with governance innovation; India is building momentum through digital public infrastructure and sector-level applications.

Which country will be the first to turn AI adoption into measurable productivity gains successfully?

The United States
75.00%
China
25.00%
Singapore
0.00%
Europe
0.00%
Japan
0.00%
Others
0.00%
4 Polls

That diversity creates a useful market map. China may test whether AI, batteries and industrial systems can be integrated at scale. Japan may test whether trust and reliability become competitive advantages in high-stakes AI deployment. Singapore may test whether governance can accelerate rather than slow adoption. India may test whether public digital infrastructure can help AI scale across services, finance, healthcare and government delivery.

The energy aspect runs through it all. And the victory condition may not depend on who uses the most electricity for AI but who turns AI electricity into the most useful output.

This means battery, flexible demand and storage are part of the AI productivity stack. If AI can forecast power prices, shift workloads, optimize storage and reduce electricity costs, then energy management becomes a source of margin improvement. If not, data-center expansion risks becoming a race to build expensive infrastructure before the business case is fully proven.

Therefore the AI trade should be judged not only by CapEx growth but also by operating conversion. Are companies reducing workflow bottlenecks? Are they changing decision rights? Are they using AI to improve energy procurement? Are they redesigning processes around AI, or merely adding AI tools to unchanged organizations?

Will AI energy management become a major source of enterprises margin improvement?

Yes, especially for data centers and manufacturers
0.00%
Yes, but only for very large companies
50.00%
No, power costs will mostly be passed to external
0.00%
Not sure
50.00%
2 Polls

The next phase of the AI market may be less about “how much power does AI need?” and more about “who can produce the most value per watt?”

That is a harder question to price. But it may be the one that separates the real AI winners from the companies simply paying higher electricity bills.

source:

  1. Why the world's biggest battery maker isn't worried about AI's energy demand, June 24,2026 https://www.weforum.org/stories/2026/06/how-and-why-we-should-be-rethinking-ai-s-energy-usage/
  2. Asia’s Human-led AI Opportunity: A Framework for Transformation, June 22, 2026 https://reports.weforum.org/docs/WEF_Human_Centric_AI_Transformation_in_Asia_2026.pdf
  3. Why human roles matter for Asia's AI transformation, June 24,2026 https://www.weforum.org/stories/2026/06/why-human-roles-matter-asia-ai-transformation/
Market Rumor - OpenAI proposes handing Trump administration 5% stake
News
Capital MarketsAI Infrastructure

Market Rumor - OpenAI proposes handing Trump administration 5% stake

According to FT, Sam Altman’s start-up in early talks for a public ownership deal as political pressure rises.

Economics & FinanceTechPolitics

Will OpenAI Actually Handing Stake to Trump Administration / the Gov?

Yes
25.00%
No
75.00%
4 Polls

Will Anthropic Follows Suit (after OpenAI) to Hand Stake to the Gov?

Yes
100.00%
No
0.00%
2 Polls

According to FT, OpenAI has held discussions regarding the possibility of granting a 5 percent equity stake to the US government. The $852 billion artificial intelligence startup is attempting to clear political hurdles by obtaining financial investment from the Trump administration.

Based on the soruce, two individuals acquainted with the matter, Sam Altman, the chief executive of the ChatGPT creator, has contended that providing the public with a financial interest in the company represents the optimal method for sharing the benefits of AI. He has proposed a stake of this magnitude during preliminary talks with the administration.

The envisioned structure would require other American AI firms to surrender an equivalent percentage, though it remains uncertain whether competing labs would agree to the terms.

Providing the government with an equity position could assist in establishing favorable relations with the administration. This move represents an effort to mitigate political backlash by distributing the wealth created by AI to the general population.

AI developers have encountered a progressively difficult climate in Washington as both American politicians and the public voice growing anxieties regarding extensive data center development, cyber security risks, and the technology's impact on employment.

Both OpenAI and its primary competitor, Anthropic, have recently experienced delays in launching their latest cutting-edge models due to US scrutiny. Furthermore, certain Republicans and advisers to President Donald Trump are advocating for significantly stricter regulations across the industry.

Both rivals are concurrently getting ready for public listings, which would broaden their shareholder bases and produce substantial returns for existing investors, though OpenAI's initial public offering might not occur until next year.

Altman and other OpenAI leadership have proposed that each of the top AI developers in the United States allocate 5 percent of their equity toward an entity modeled after the Alaska Permanent Fund—a sovereign fund that reinvests the state's oil revenues into equities and distributes dividends to residents and the state government.

The targeted firms could encompass Anthropic, alongside Google, Meta, and others, though it is uncertain if any of these entities would consent to OpenAI's plan.

Following public criticism of Intel's chief, Trump shifted his stance to support the US chipmaker after the federal government acquired a 10 percent stake.

The sources noted that these "conceptual" discussions between OpenAI and the government are in their infancy, and implementing any such agreement would likely necessitate an act of Congress. Nonetheless, the negotiations highlight a potential framework for dispersing the financial profits generated by the technology.

Altman has maintained active dialogues concerning public ownership with administration figures, including Trump, Treasury Secretary Scott Bessent, and Commerce Secretary Howard Lutnick, according to several people familiar with the situation.

Additionally, the OpenAI chief executive has conversed with Democratic Senator Bernie Sanders in recent weeks. Sanders has advocated for public ownership closer to 50 percent of each American AI corporation through a sovereign wealth fund.

In past economic policy recommendations, both OpenAI and Anthropic have implied that structures like sovereign or public wealth funds might eventually be necessary to allocate shares to citizens.

In April, OpenAI put forward a proposal for a "public wealth fund" designed to offer every citizen, including individuals who do not participate in financial markets, an equity stake in AI-fueled economic expansion.

In May, the company's non-profit division, the OpenAI Foundation, stated that an AI-driven future would likely require fresh strategies to provide individuals with lasting ownership in the value-generating systems, explicitly highlighting public or sovereign wealth funds.

The foundation noted in a blog post that the objective extends beyond merely supporting citizens through economic transitions after choices are finalized; it aims to provide them with a stake and a voice in directing how that evolution takes place.

OpenAI chose not to comment on the matter, and the White House did not instantly reply to a request for comment.

Source: 1. The Financial Times; OpenAI proposes handing Trump administration 5% stake; July 2, 2026: https://www.ft.com/content/7c803eab-8e80-4431-9a87-e943bf00e00b?syn-25a6b1a6=1

In Japan, A New Type of Prediction Market is Taking Advantages of the Loophole in Gambling Regulations
News
LegalPrediction MarketRegulatory

In Japan, A New Type of Prediction Market is Taking Advantages of the Loophole in Gambling Regulations

PoliticsEconomics & Finance

From the rapidly developing point based prediction applications in Japan, we can see the demand for event forecasting is spreading into Asia. The business model is rely on the loyalty points, regulatory arbitrage and advertising, which differs from the trading fee as commonly known.

Will Japan formally regulate prediction markets before 2028?

Yes
66.67%
No
33.33%
6 Polls

Prediction markets are usually discussed as a financial innovation: traders price future events; markets aggregate information; platforms earn from liquidity, spreads or transaction activity. Japan is testing a different version that is suitable for local people, but the core idea remains the same.

Jun 29 (Bloomberg), In Japan, local APPs such as Miraima allow users to predict real world outcomes, including sports results, political events, stock moves, and entertainment outcomes without staking cash or crypto. Instead they can redeem virtual points for gift cards or third-party reward points such as Amazon or Paypal after successful prediction. Miraima launched only months ago, has reportedly approached one million monthly users, helped by sports events and political interest.

The core demand is clearly there: people want to express views on public events, compete with others and be rewarded when they are right. 

Differ from Polymarket or Kalshi, Miraima's business model is more like a combination of prediction market, mobile game, and loyalty points platform. Users are not necessarily trading against a live order book. They are engaging with an app, watching ads, completing tasks, and returning for repeated prediction games. Miraima’s founder says the company is already profitable through fees generated when users watch advertising videos or download apps. But compared with overseas prediction platforms who can monetize transaction and settlement fees, the margin profit of Miraima is till thin.

This distinction matters. Because if the U.S. version of prediction markets is trying to become a regulated financial exchange worldwide, the Japanese version is first becoming an attention business. Due to Japan already has a large loyalty-points economy that can absorb prediction style products and won't looks like a cash gambling immediately. April 2026 (Nomura Research Institute) Private-sector point and mileage issuance by major companies across 12 domestic industries reached ¥1.3695 trillion in FY2024, up about 6% from the previous year, and forecast issuance would grow to ¥1.7257 trillion by FY2029. Cashless payments were the largest catalyst accounting for about 53% of private-sector issuance. This helps explain why a point based prediction app can feel native to Japanese consumer behavior rather than like an imported gambling product.

The regulatory system in Japan is the main reason why using points. The Penal Code broadly prohibits gambling for both ordinary and habitual gambling.This makes real-money prediction markets difficult to operate. Bloomberg also cites Japan Exchange Group CEO Hiromi Yamaji saying that cash based prediction markets would face not only gambling law issues but also difficult questions around insider trading and market manipulation.

Therefore using points, gift cards and shopping rewards instead of cash or crypto, is the best way to stay outside. But the structure is not risk free: Japan’s National Police Agency warns that online gambling can still be illegal even when accessed through overseas or “free bonus point” formats. This shows the regulators will be more cautious when a product looks like wagering.

Point-based prediction APPs are more like financial information markets or gambling products?

Mostly financial information just with rewards
50.00%
Mostly gambling as users enjoy the feeling of betting
0.00%
Depends on whether rewards are cash-equivalent
0.00%
A separate loyalty-gaming category
50.00%
2 Polls

The unresolved question is whether Japan will treat these APPs like harmless loyalty games, a new form of gambling, or something closer to financial information markets. Bloomberg reports that lawyers see possible scrutiny under lottery related rules, especially because some Japanese point based services currently do not impose age limits while Polymarket and Kalshi restrict users to 18 and older.

For investors or founders who want to get involved in prediction markets especially in Asia market, have to notice there is no single regulatory path. India and Indonesia has already blocked Polymarket as online gambling platform; while South Korea has officially launched an investigation into whether Polymarket involves online gambling.

The U.S. path looks different, CFTC records list Kalshi as a designated contract market and also show several newer prediction market or event contract related exchange registrations and pending applications, which means American market is moving through financial market infrastructure rather than consumer gaming infrastructure.

The market signal is bullish: nearly one million monthly users for a young prediction APP suggests that event forecasting can become a mass market behavior outside the U.S.

The business-model signal is more mixed: if monetization depends mainly on ads and APP download incentives, these platforms may scale engagement faster than revenue.

The regulatory signal is the most important: once prediction markets become visible enough, Japan will have to decide whether to regulate them, ban them or formally separate “forecasting as information” from “betting as gambling.”

For now, Japan’s point based prediction market is not the Asian version of Polymarket. It is something more local and maybe more revealing: a prediction market disguised as a loyalty points APP. Growing rapidly because users want to bet on the future even when the law does not yet know what to call it.

Prefer a prediction market only contains macro information for trading OR with gamified content?

Be professional and full of trading context
50.00%
Have to be gamified otherwise it is too boring
0.00%
Better find a balance because I am a newer who needs interests first
50.00%
2 Polls

Source:


1. ポイ活型の予測市場が日本で台頭-賭博規制の隙間突く新サービス、月間100万人突破も ("Point-based" prediction markets are on the rise in Japan—new services exploiting loopholes in gambling regulations are even surpassing one million monthly users), June 29, 2026 https://www.bloomberg.com/jp/news/features/2026-06-29/THDEWIKIUPS700#gsc.tab=0

  1. 野村総合研究所、2029年度のポイント・マイレージ年間発行額は約1.7兆円に拡大すると予測 (Nomura Research Institute forecasts that the annual issuance value of loyalty points and mileage will expand to approximately 1.7 trillion yen in fiscal year 2029), April 21, 2026 https://www.nri.com/jp/news/newsrelease/20260421_1.html
  2. オンラインカジノを利用した賭博は犯罪です!(Gambling using online casinos is a crime!) https://www.npa.go.jp/bureau/safetylife/hoan/onlinecasino/onlinecasino.html
Breaking News - CMA CGM nears $1.4 billion deal for FedEx logistics unit, sources said
Exclusive News
MaritimeTransportSupply ChainBreaking NewsM&A

Breaking News - CMA CGM nears $1.4 billion deal for FedEx logistics unit, sources said

French container shipping ​group CMA CGM is nearing a deal ‌to buy FedEx's third-party logistics business for $1.4 billion in cash.

Economics & Finance

French container shipping ​group CMA CGM is nearing a deal ‌to buy FedEx's third-party logistics business for $1.4 billion in cash.

(Update: On July 1 local time, the M&A Was Officially Announced) Will CMA CGM acquire FedEx Logistics Unit?

Yes
50.00%
No
50.00%
4 Polls

Talks between the companies are at ​an advanced stage and a deal could come ⁠together as soon as Wednesday, according to The Financial Times.

This would be the latest move by CMA CGM to ​diversify into logistics and air freight. Meanwhile, for ​FedEx, the sale of its third-party logistics business, known as FedEx ‌Supply ⁠Chain, will let it focus on its core air-ground delivery network.FedEx Supply Chain specializes in order fulfillment and product returns for major retailers.The news of the ​potential deal ​comes a ⁠month after FedEx completed the spin-off of its trucking segment, FedEx Freight, to focus ​on its delivery business.Global tariffs imposed by ​U.S. ⁠President Donald Trump have weakened demand for delivery services. Evolving U.S. trade policies, including the end of U.S. ⁠duty-free "de ​minimis" low-value e-commerce shipments from China-linked ​discount retailers, such as Shein and Temu, have weighed on volumes.

Source:

  1. Reuters: CMA CGM nears $1.4 billion deal for FedEx logistics unit, FT reports; July 1, 2026: https://www.reuters.com/business/cma-cgm-nears-14-billion-deal-fedex-logistics-unit-ft-reports-2026-07-01/
Macro & Micro Compass - June NFP Report: Stability Is Priced In, But Is It Fully Supported by the Data?
News
EconomicsLabor MarketMacro & Micro CompassMacroeconomics

Macro & Micro Compass - June NFP Report: Stability Is Priced In, But Is It Fully Supported by the Data?

Markets are pricing June NFP around 100,000-150,000 jobs, reflecting economist forecasts and recent labor data, as attention turns to how incoming prints align with current expectations.

Economics & FinancePolitics

This week’s Nonfarm Payrolls report lands on Thursday, July 2, at 8:30 a.m. ET, according to the US Bureau of Labor Statistics (BLS), one day earlier than usual because US markets are closed Friday for Independence Day.

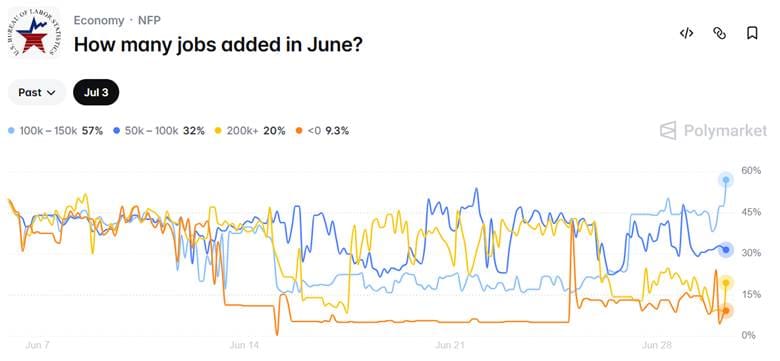
Polymarket is currently pricing the July 2 U.S. Nonfarm Payrolls release with a huge tilt toward 100k-150k jobs added, just below 60%, but the upside tail is not negligible.

This is consistent with economists' forecasts. According to a Reuters poll, economists are clustered around 110,000 jobs added in June, down from May’s 172,000 gain. Unemployment is expected to hold near 4.3%, while wage growth is expected to stay around 0.3% month over month.

But what if the market is overconfident in the stability of the 100k-150k range because it is anchoring on lagged, revised, and smoothing labor indicators?

What do you think the market is underestimating the most?

Downside risk from weakening hiring momentum
25.00%
Strength in labor market resilience (hot upside surprise risk)
25.00%
No major mispricing, consensus is fair
25.00%
Mixed signals dominate
25.00%
4 Polls

May made the bar harder to clear

The reason this week’s report is more interesting than the consensus number suggests is May.

Economists expected only 85,000 jobs last month. The actual number came in at 172,000. March and April were also revised higher by a combined 93,000 jobs. A few weeks ago, the concern was that hiring had become too soft. After May, the cleaner question is whether the slowdown thesis got too much credit too early.

Still, the devil is in the details because May was not a perfectly broad-based boom. Leisure and hospitality added 70,000 jobs, local government added 55,000, and health care added 35,000. Financial activities lost 22,000 jobs. This shows an uneven labor market holding headline strength.

Another report above 150,000 would make May look less like a one-off. A number below 100,000 would bring back the idea that the labor market’s surface strength is hiding weaker hiring underneath.

But is headline NFP a clean signal?

Everything in the pricing depends on this: headline payrolls accurately reflect underlying labor momentum.

But NFP is not a direct measure, it’s a modelled survey estimate that makes it vulnerable. The current consensus stability relies heavily on data that has already been revised multiple times this year.

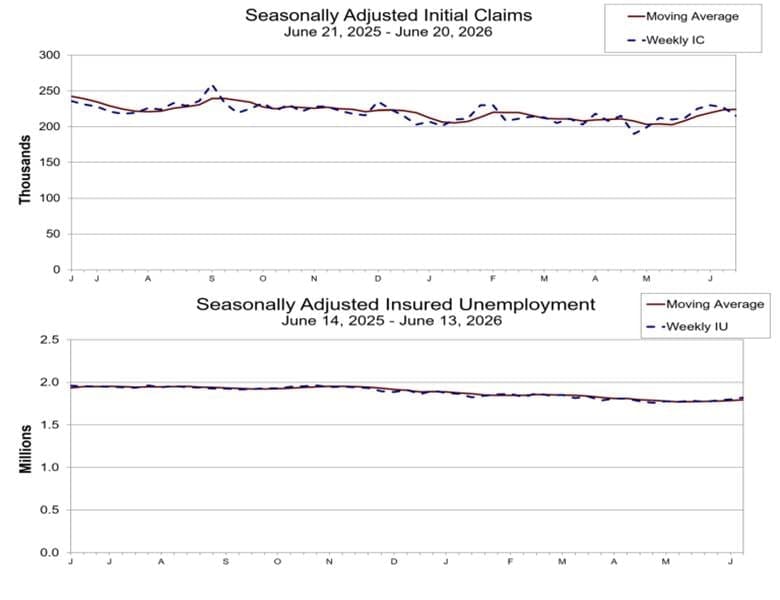
Initial claims fell to 215,000 for the week ending June 20, below the 225,000 economists expected. This alone tells you companies are not suddenly rushing to cut workers.

The softer signal is in continuing claims, which rose to 1.821 million. Low initial claims say layoffs are contained, but higher continuing claims say people who lose jobs may be taking longer to find the next one.

The latest JOLTS data shows that job openings rose to 7.6 million in April, but hires fell to 5.1 million and total separations dropped to 5.0 million. Quits were little changed at 3.0 million, while layoffs and discharges were also little changed at 1.7 million.

Taken together, it’s not a classic “everyone is getting fired” labor market, but it does look more like a frozen one. A low-churn environment where hiring momentum is softening even as headline stability is preserved.

Wages may matter more than the jobs number

The payroll number gets the headline, but wages may decide the market reaction.

In May, average hourly earnings rose 0.3% on the month and 3.4% from a year earlier. Another 0.3% wage print in June would not look shocking on its own. Paired with a strong jobs number, though, it becomes harder for the market to treat labor strength as harmless.

A softer payroll number with cooler wages would do the opposite. It would support the argument that demand is fading and that policy is already restrictive enough. The unemployment rate would then become the tie-breaker. A move up from 4.3% would carry more weight than a small miss on payrolls alone.

What traders should watch on Thursday

The key risk this week is that markets overweight the stability implied by recent revisions. March was revised up 29,000 and April up 64,000, reinforcing the perception that initial prints understate true strength.

A market pricing the initial June print needs the actual release to land soft, not just the eventual, revised reality, and on a year where every revision has added jobs back rather than taken them away, betting heavily against the consensus bracket has a real headwind.

The first number to watch is the headline payroll range. A 100,000 to 150,000 print broadly confirms the market’s base case. A sub-100,000 print makes the slowdown story harder to ignore. A 150,000-plus print puts the “too hot” debate back on the table.

A 4.3% unemployment rate keeps the soft-landing read in place, but that reading depends on the rate staying pinned inside a narrow 4.3%-4.5% band where small shifts change how much slack the market thinks exists. At 4.4%, this stability starts to look less certain, and a drop toward 4.2% would make it harder to argue that hiring is cooling fast enough.

The third number is wages. Payrolls can miss or beat for noisy reasons, especially in summer. Wage growth is harder to shrug off because it feeds directly into the Fed debate.

Revisions also deserve a close read. May looked strong partly because previous months were revised higher. A June miss would sting less with upward revisions. A June beat would look more convincing with another positive revision behind it.

The print won't move the July 28-29 FOMC decision directly, but it's the last full labor read before it, and a soft surprise would revive easing hopes, while a strong payroll-and-wage combination would strengthen the case for higher-rate risk.

Sources:

1.     Barron’s: Additional 93,000 Jobs Added to March and April Totals

2.     BLS: Employment Situation Summary (March)

3.     BLS: Employment Situation Summary (May)

4.     BLS: Job Openings and Labor Turnover Summary

5.     DOL: Unemployment Insurance Weekly Claim

6.     Reuters: Wall St Week Ahead Jobs data, rate bets in focus as US stocks close solid first half

Which data point will matter most for June NFP release?

Payrolls headline number
0.00%
Wage growth
0.00%
Unemployment rate
100.00%
Revisions to prior months
0.00%
1 Polls
Teach-in Series 7 - OEM/Brands
Teach In
Semiconductor Semi Teach In

Teach-in Series 7 - OEM/Brands

Where chips become products — and the demand that pulls the whole chain

Economics & FinanceTech

Where chips become products — and the demand that pulls the whole chain

Will Hyperscalers raise their capex target again in upcoming quarterly results (Jul-Aug 2026)?

Yes
0.00%
No
0.00%
0 Polls

Executive summary

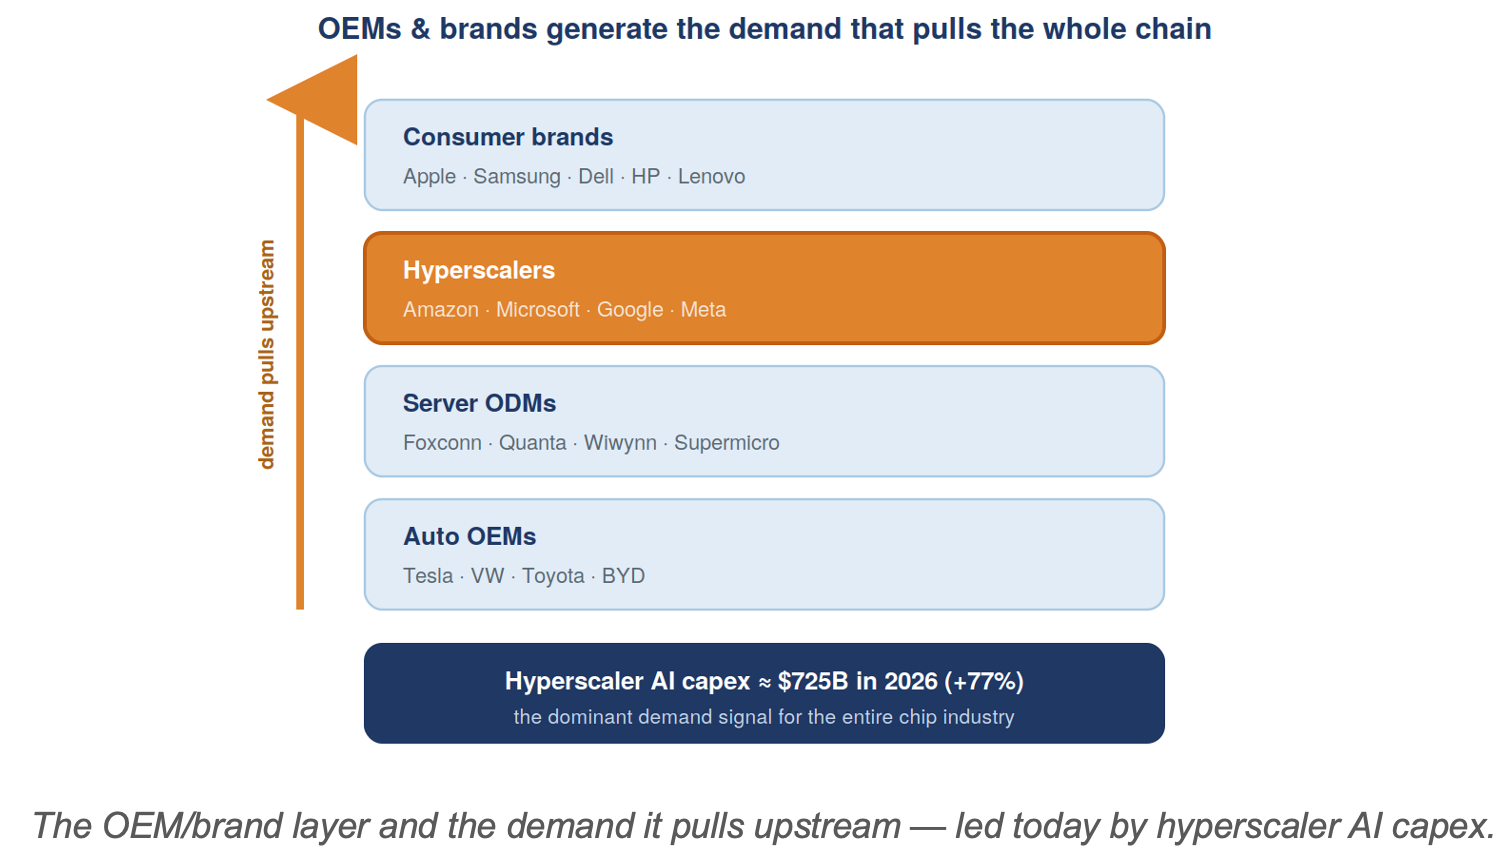
OEMs and brands are where chips become products — the device makers, server builders, and system companies that integrate semiconductors into things people and businesses buy. They are the origin of demand that pulls silicon through the entire value chain. The category spans consumer-device brands (Apple, Samsung, Dell, HP, Lenovo), data-center server ODMs (Foxconn, Quanta, Wiwynn, Supermicro), automakers, and — most importantly today — the hyperscalers whose AI-infrastructure spending now drives the cycle.

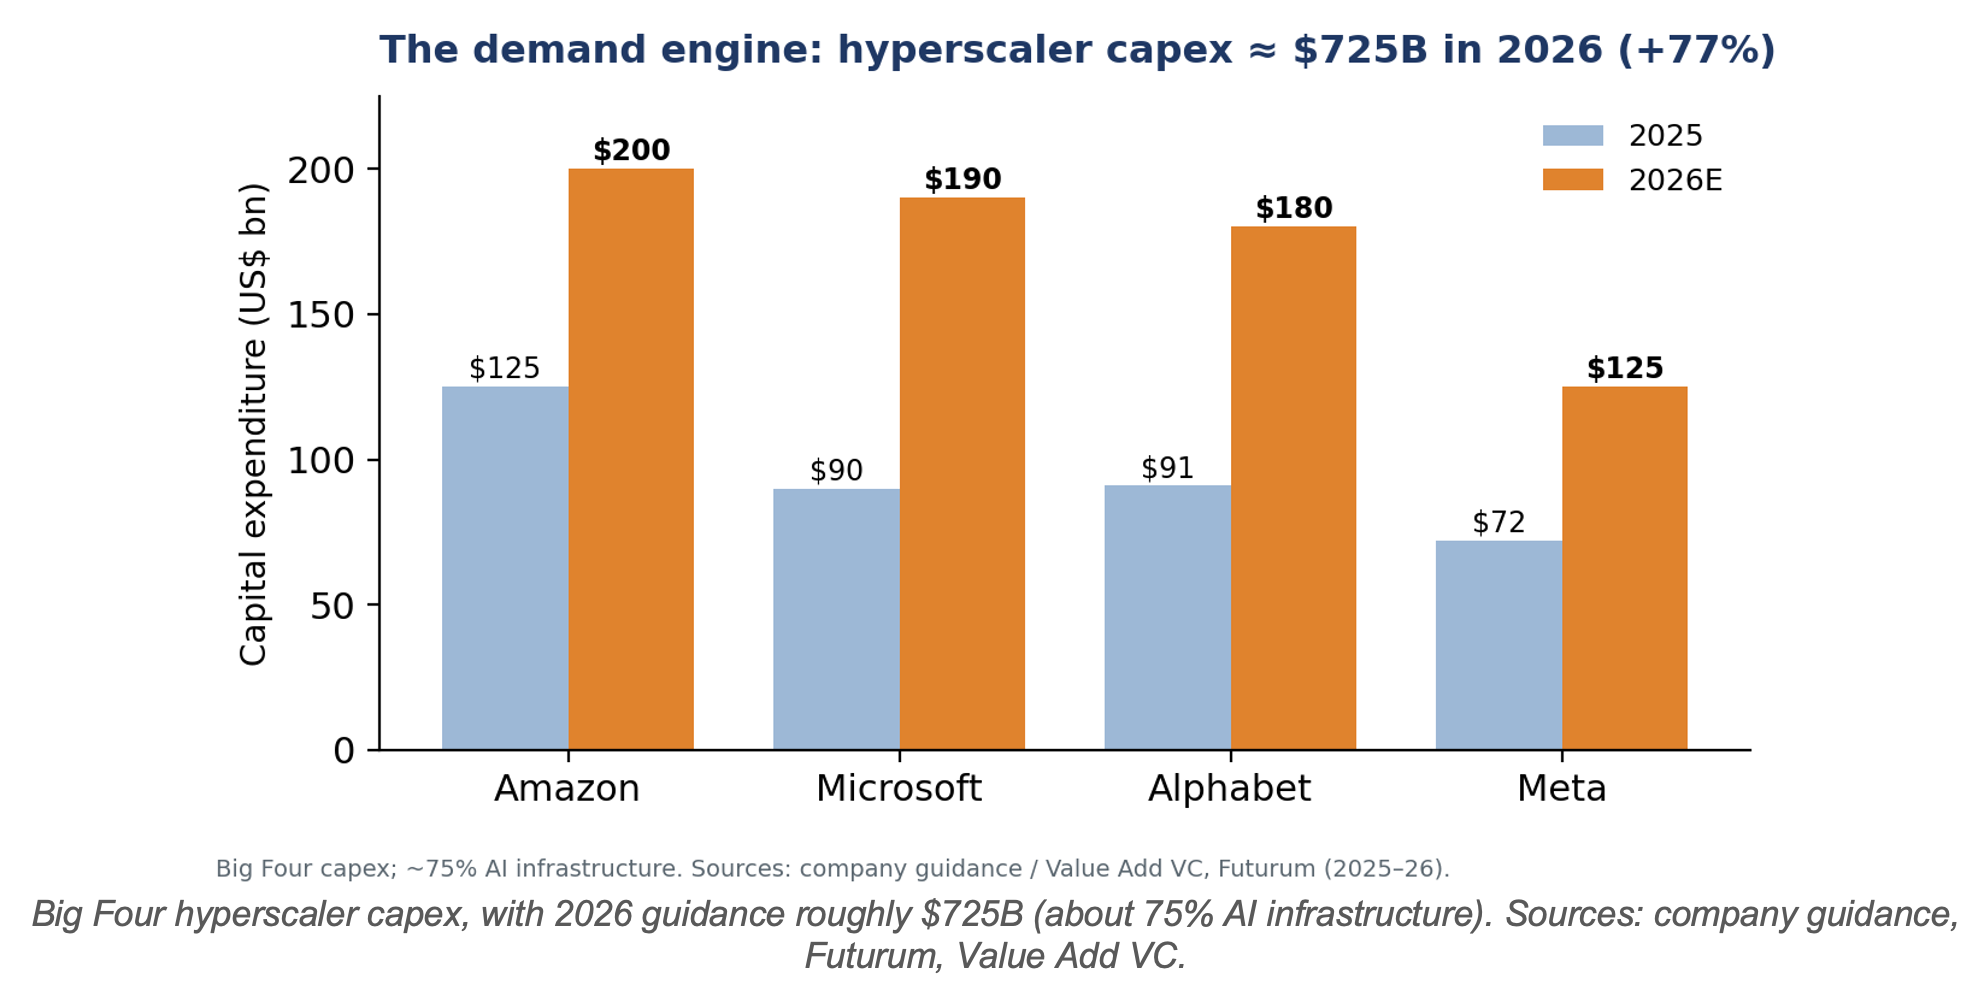
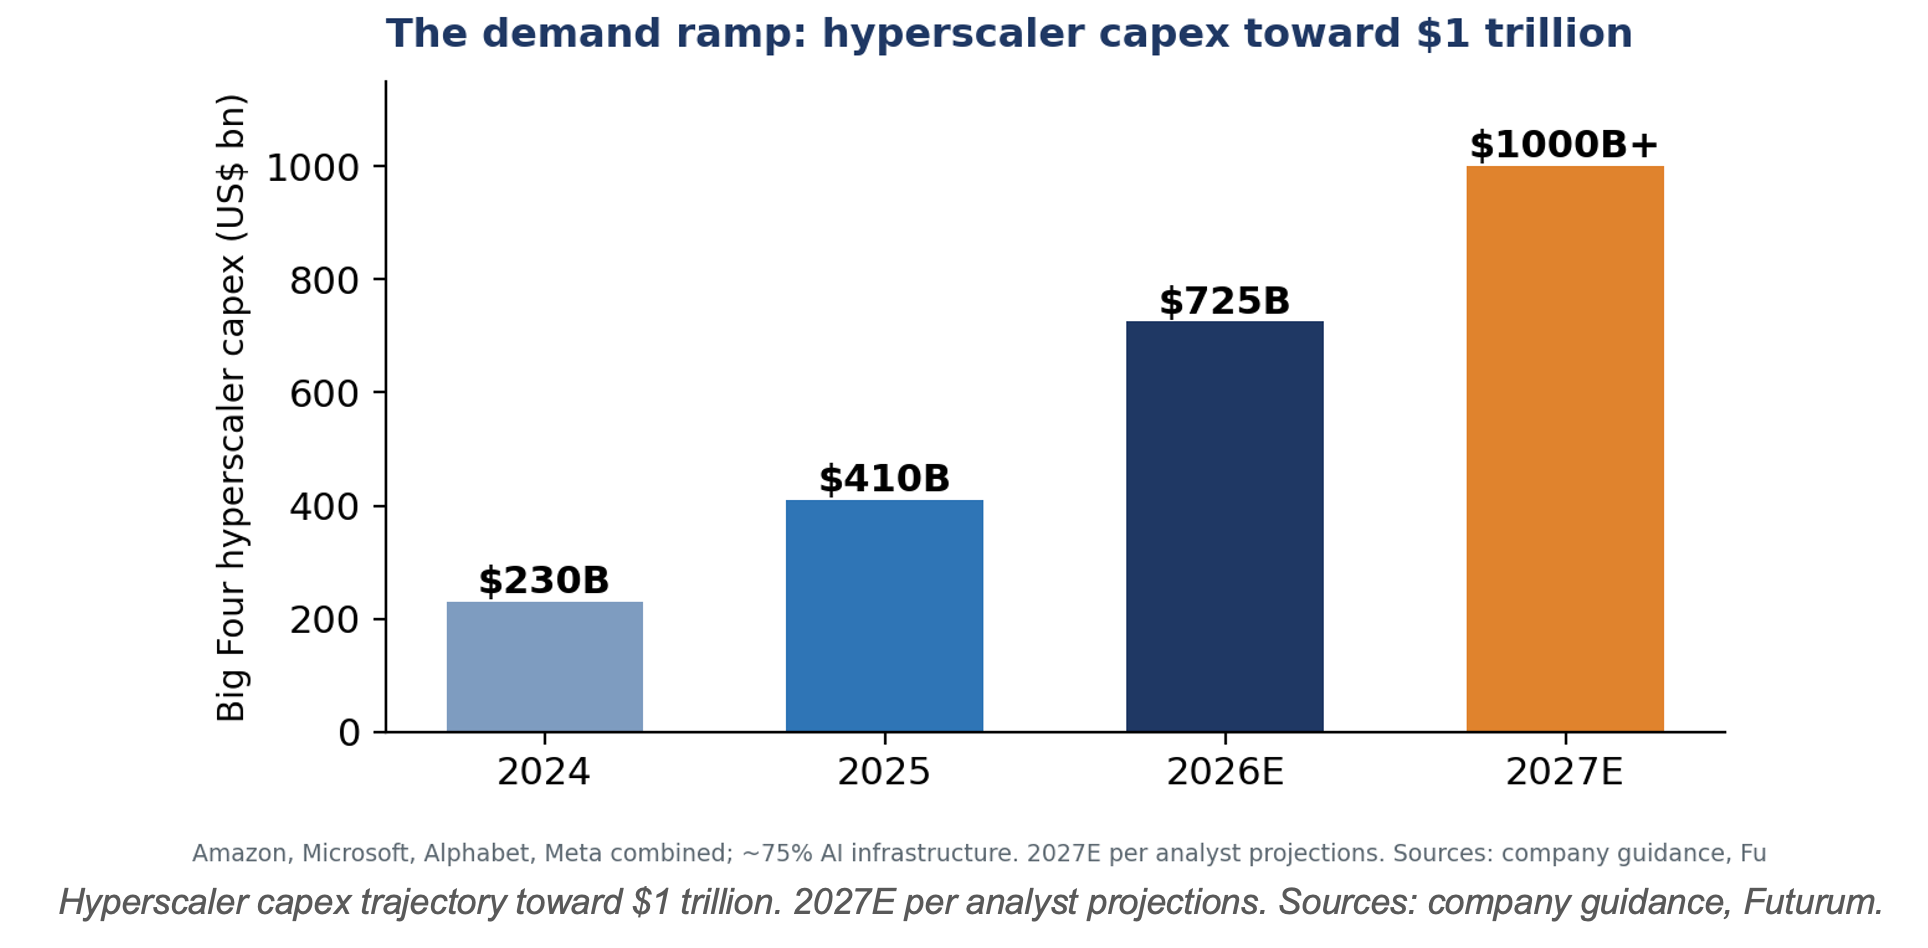
That demand signal is staggering: the four largest US hyperscalers are guiding to roughly $725 billion of capital expenditure in 2026, up about 77% from ~$410 billion in 2025, the overwhelming majority of it AI infrastructure, with analysts projecting big-tech capex above $1 trillion by 2027. This is the engine behind the foundry, fabless, memory, and packaging booms described in the companion primers.

1. Definition and strategic importance

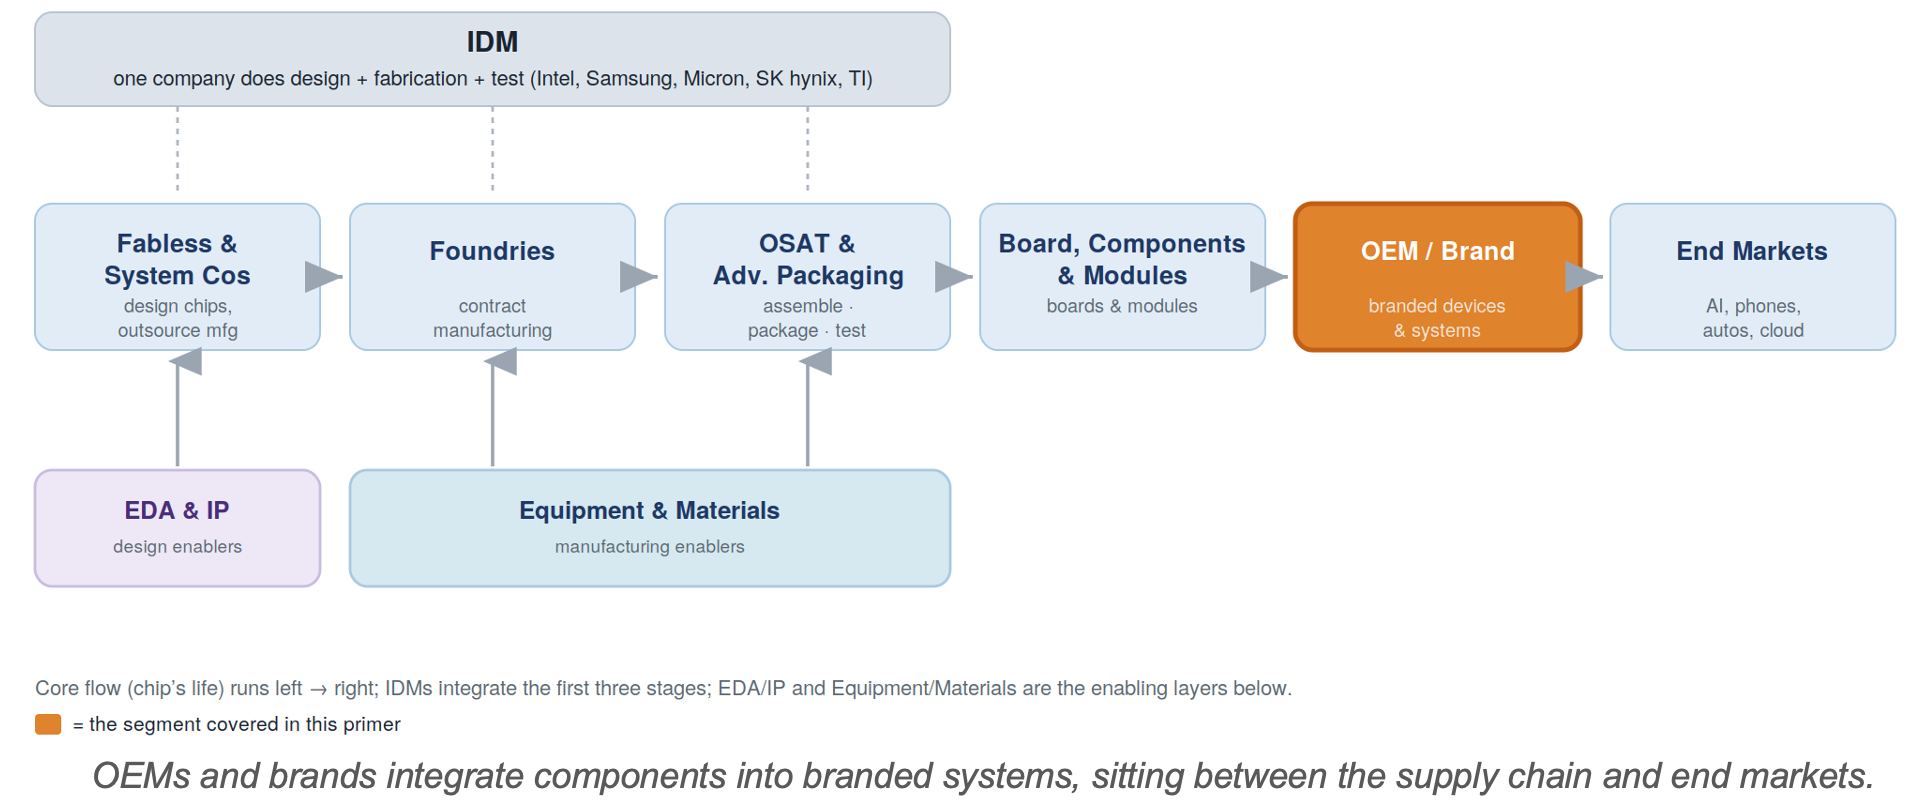
OEMs (original equipment manufacturers) and brands sit at the downstream end of the chain, buying chips, boards, modules, and components and assembling them into finished systems sold under a brand to end markets. They matter because demand starts here — every wafer TSMC makes and every tool ASML sells exists ultimately to satisfy an order that originates with an OEM or a hyperscaler.

2. Position in the value chain

A key nuance: the line between “brand” and “chip designer” is blurring. Apple and the hyperscalers now design their own silicon (covered in the Fabless primer), making them simultaneously the demand origin and an upstream design participant — a vertical integration reshaping the industry’s balance of power.

3. Structure: brands, ODMs, and hyperscalers

Consumer-device brands. Apple, Samsung, Dell, HP, Lenovo, Xiaomi and others design and sell branded phones, PCs, and electronics, capturing brand margin and owning the customer — often outsourcing physical assembly to contract manufacturers (e.g., Foxconn for Apple).

Server and data-center ODMs. The AI build-out is physically assembled by original design manufacturers — Foxconn (Hon Hai), Quanta, Wiwynn, Wistron, and Supermicro — which build the servers and racks that house GPUs and accelerators. These are high-volume, thin-margin businesses booming on AI orders.

Hyperscalers. Amazon, Microsoft, Google, and Meta are both the largest buyers of AI hardware and increasingly the designers of their own chips. Their capital spending is the dominant demand variable for the entire semiconductor industry today.

4. The demand engine: hyperscaler capital spending

The trajectory matters as much as the level: spending has roughly doubled each year and is projected to approach $1 trillion in 2027, with the five largest US hyperscalers reportedly planning to add around $2 trillion of AI-related assets by 2030.

5. Competitive structure and key players

The layer divides by role rather than by a single revenue ranking; margins differ sharply between brand owners and contract builders.

Category

Examples

Role in the chain

Device brands

Apple, Samsung, Dell, HP, Lenovo

Design/sell branded devices; own the end customer; rich margins

Hyperscalers

Amazon, Microsoft, Google, Meta

Largest AI-hardware buyers; also design custom silicon

Server ODMs

Foxconn, Quanta, Wiwynn, Supermicro

Build AI servers and racks (thin-margin, high-volume)

Auto OEMs

Tesla, VW, Toyota, BYD

Rising semiconductor content per vehicle

6. Business model and economics

Economics vary enormously by role. Brand owners like Apple capture high margins by owning design, software, and the customer relationship, while contract ODMs (Foxconn, Quanta) run on razor-thin margins despite enormous revenue. Hyperscalers are not selling hardware at all — their chip and server spending is a cost of delivering cloud and AI services, which is why the return on that capex is so closely scrutinized.

7. Demand drivers

•     AI infrastructure build-out. Hyperscaler capex (~$725B in 2026) is the single largest pull on advanced logic, memory, and packaging.

•     Device refresh cycles. AI PCs and AI smartphones, plus normal replacement of the ~1.2 billion phones and ~250 million PCs shipped each year, provide a large volume base.

•     Automotive content. Electrification and ADAS keep raising the dollar value of chips per vehicle.

8. Geopolitics and strategic dimension

OEMs sit atop globally distributed supply chains exposed to tariffs, export controls, and reshoring pressure. Device assembly is shifting (e.g., toward India and Vietnam); AI-server supply chains concentrate in Taiwan-linked ODMs; and the hyperscalers’ build-out is increasingly constrained not by chips but by power and data-center construction — the emerging physical bottleneck of the AI era.

9. A framework for financial analysis

•     Follow the capex guidance. Hyperscaler capital-spending guidance is the leading indicator for the whole semiconductor cycle — watch it above almost anything else.

•     Separate brand from contract economics. Apple’s margins and a server ODM’s are not comparable despite both being “OEMs.”

•     Watch the ROI question. Whether AI revenue justifies the capex is the debate that could move the entire chain.

•     Track the physical constraints. Power availability and data-center construction timelines increasingly gate demand.

10. Key debates

•     Is the AI capex sustainable? Whether ~$725B+ of annual investment generates adequate returns — the industry’s biggest open question; a pullback would ripple through every upstream segment.

•     Vertical integration. How far OEMs and hyperscalers take in-house silicon, eroding the merchant-chip market.

•     Demand concentration. Whether reliance on a handful of hyperscalers makes the cycle more fragile.

11. Risk summary

•     AI-capex sustainability — the dominant risk; valuations across the chain embed continued spending.

•     Demand concentration — a few hyperscalers drive much of leading-edge demand.

•     Margin asymmetry — contract ODMs are structurally low-margin and exposed.

•     Physical constraints — power and construction bottlenecks; supply-chain and tariff exposure.

Teach-in Series 6 - OSAT & Advanced Packaging
Teach In
Semiconductor Semi Teach In

Teach-in Series 6 - OSAT & Advanced Packaging

Economics & FinanceTech

Assembly, test, and the packaging revolution reshaping the back end

Executive summary

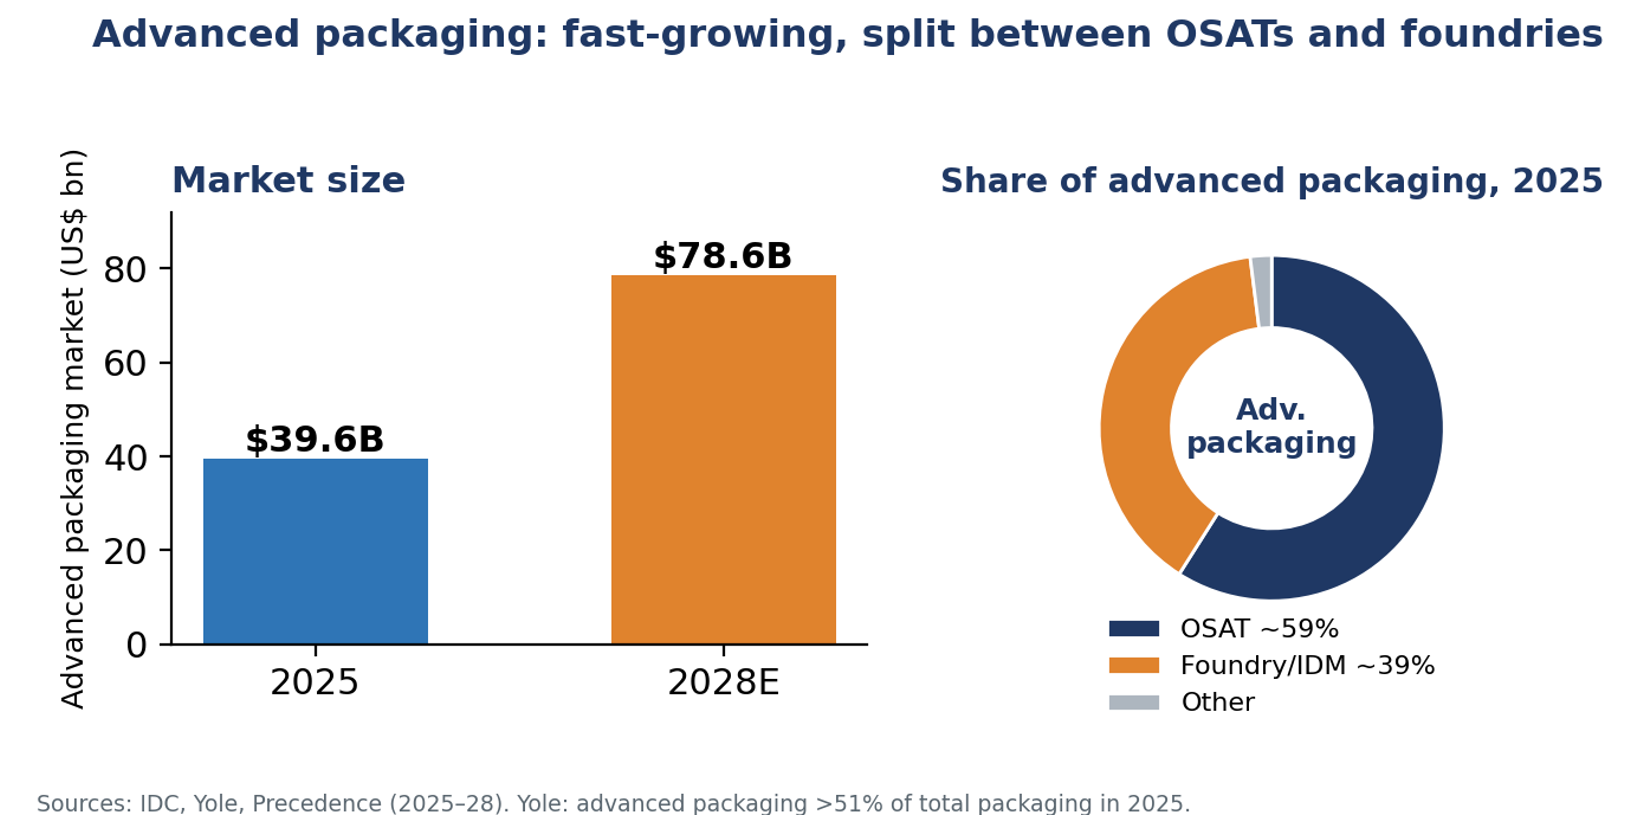
OSAT — outsourced semiconductor assembly and test — firms take finished wafers and turn them into packaged, tested chips. Historically the lowest-margin link in the chain, the back end has been transformed by advanced packaging: chiplets, 2.5D/3D stacking, hybrid bonding, and platforms like TSMC’s CoWoS that are essential to AI chips. The advanced-packaging market is growing from roughly $40 billion in 2025 toward ~$79 billion by 2028.

The competitive twist is that this lucrative new work is contested by three groups: the OSATs (ASE, Amkor, JCET), the foundries (TSMC), and the IDMs (Intel, Samsung). OSATs hold roughly 59% of advanced packaging and the foundry/IDM group about 39% — and the foundries are pushing in hard, because advanced packaging increasingly uses wafer-level, fab-style processes that blur the old front-end/back-end line.

1. Defining the sector and its strategic importance

After a wafer leaves the fab, it must be diced into individual dies, connected and protected within a package, and tested. OSATs provide these back-end services under contract, just as foundries provide front-end manufacturing. Once an afterthought, packaging is now a primary determinant of chip performance — which has turned the back end into a strategic battleground.

2. Position in the value chain

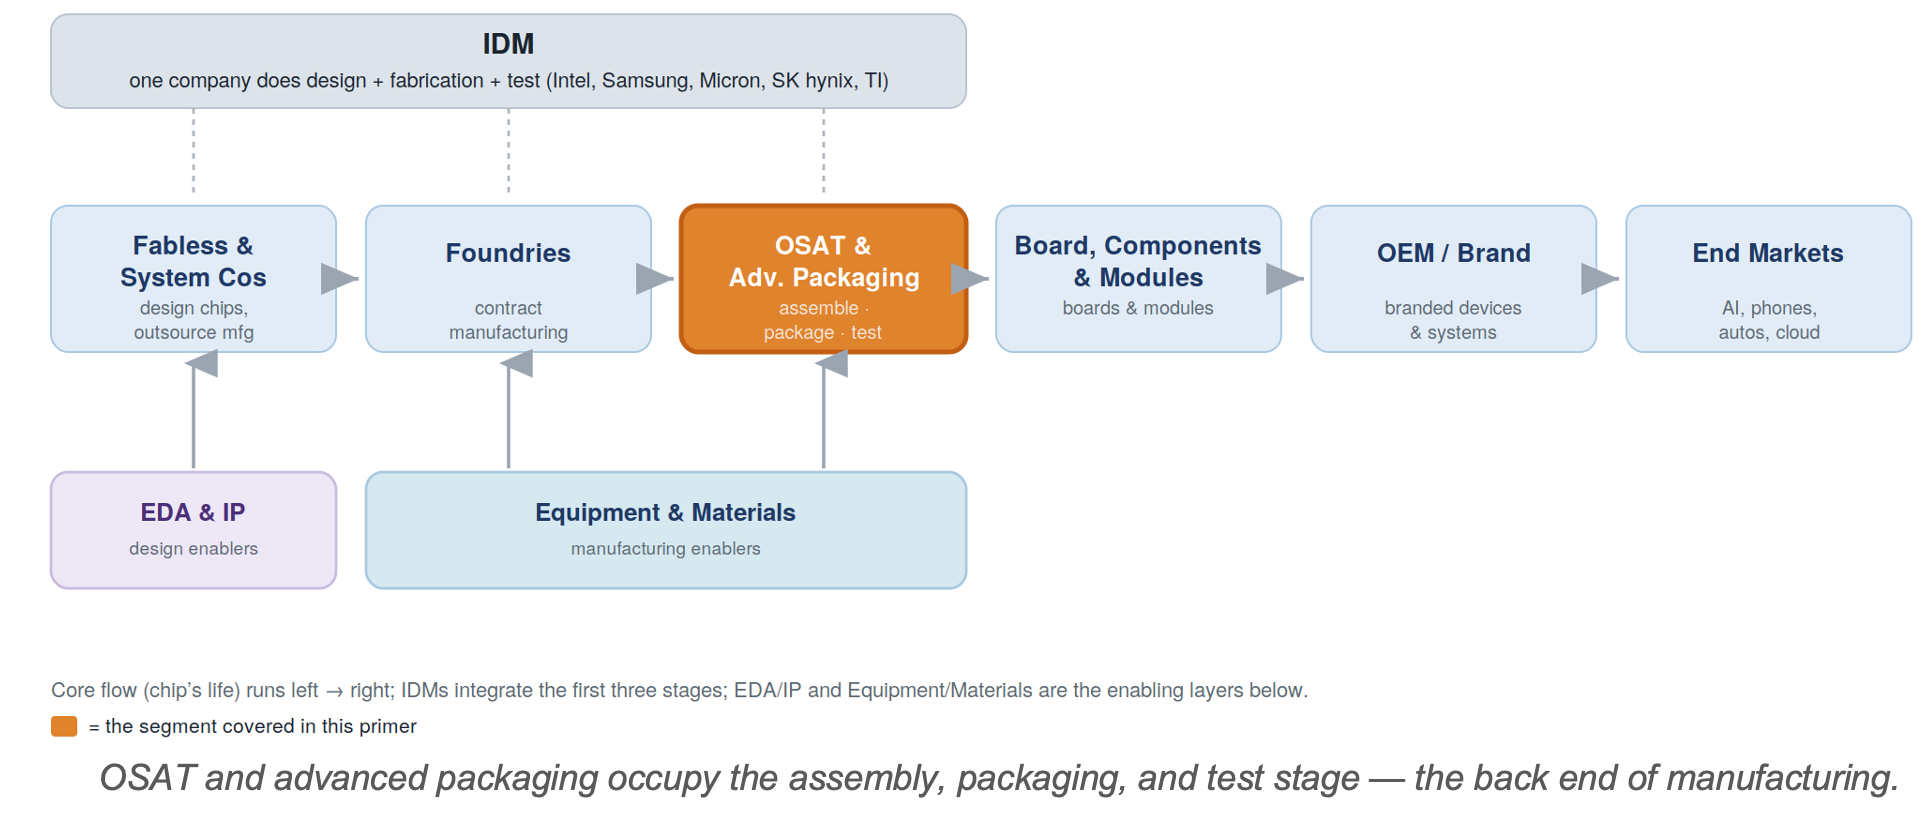
As noted in the Equipment primer, the OSAT service sits here in the chain, while the equipment used to perform it is upstream. Advanced packaging is now drawing front-end tools into the back end — the central structural shift in this segment.

3. Structure: from traditional assembly to advanced packaging

Traditional OSAT. High-volume wire-bond and flip-chip assembly and test for the bulk of the world’s chips — a thin-margin, scale-and-cost business (Amkor’s gross margin runs around 15%, a world away from foundry economics).

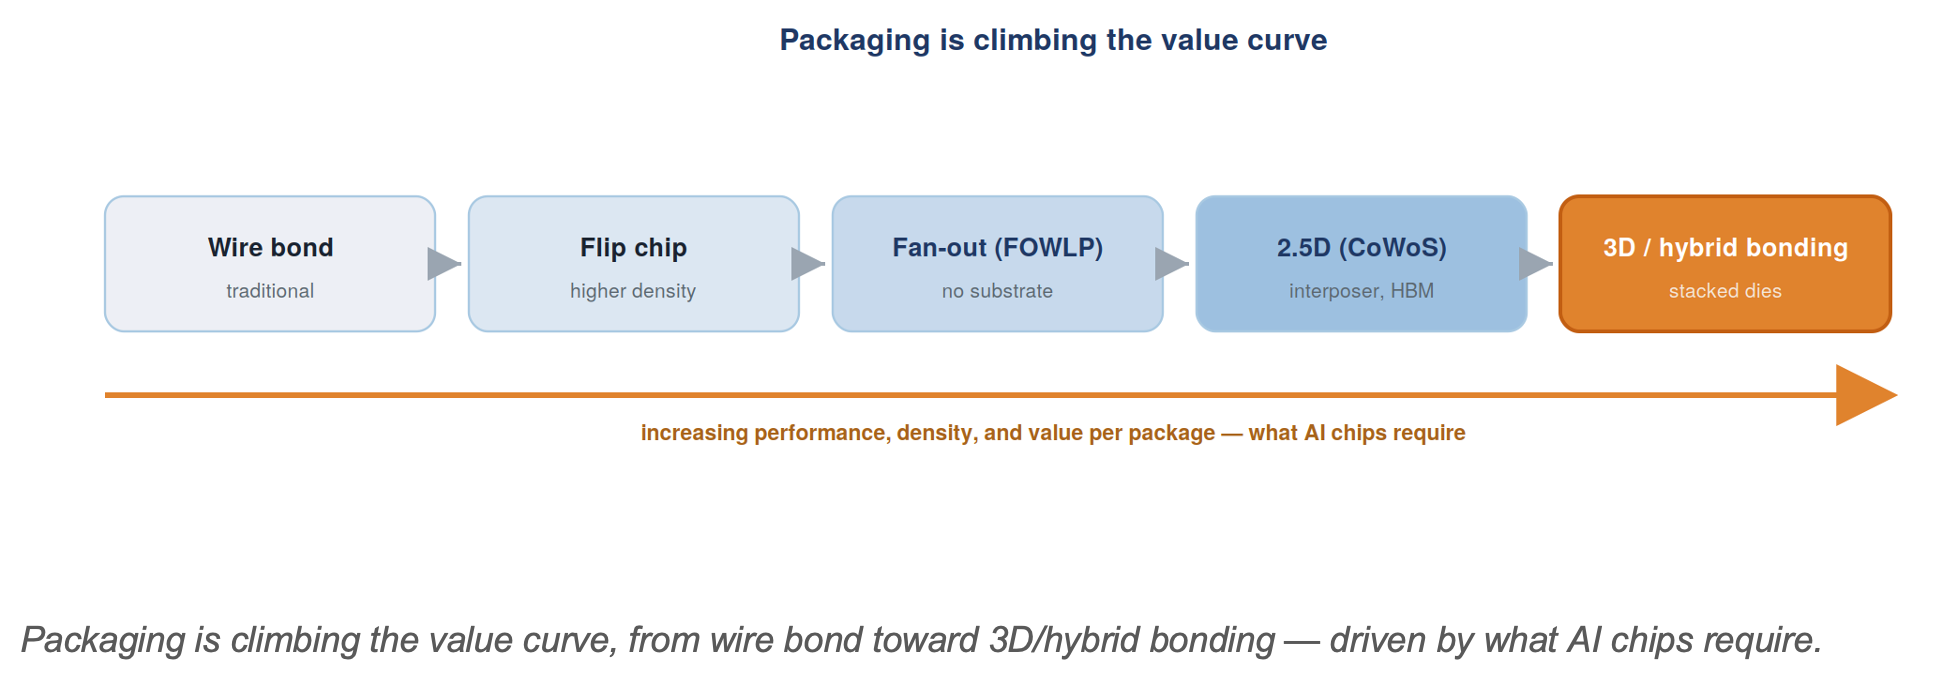
Advanced packaging. The high-value frontier: 2.5D/3D integration, chiplets, fan-out, and hybrid bonding that connect multiple dies and stacked HBM into one high-performance package. This is what AI accelerators require, and by some estimates it surpassed traditional packaging as a majority of total packaging value in 2025.

The players. ASE is the world’s largest OSAT (with a large electronics-manufacturing arm alongside assembly/test); Amkor is second and JCET is China’s leader, followed by Powertech, TFME, and test specialists such as KYEC. But TSMC (CoWoS, SoIC), Samsung (I-Cube, X-Cube), and Intel (Foveros, EMIB) now perform much of the cutting-edge packaging themselves.

4. Market size and segmentation

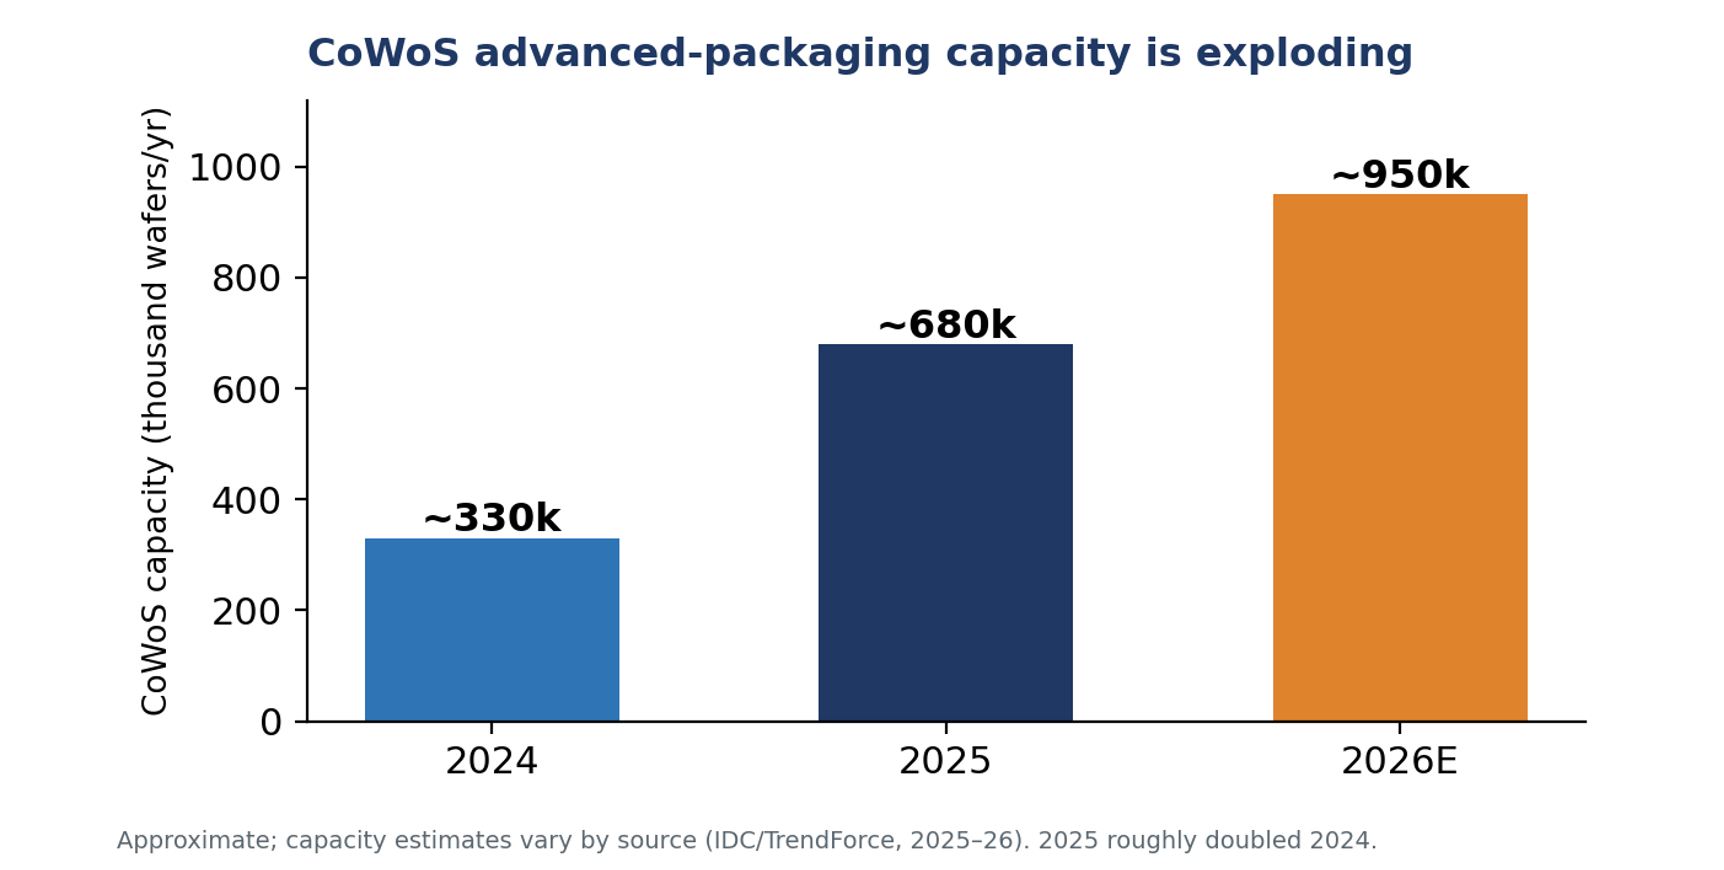
The growth is concentrated in AI-related advanced packaging, and the single most-watched capacity metric is TSMC’s CoWoS, which has roughly doubled year-on-year.

5. Competitive structure and company financials

OSATs are scaled but thin-margin; the foundry/IDM camp is capturing the most advanced (and most profitable) packaging.

Company

Position

Scale

Note

ASE Technology

#1 OSAT

~$20B group revenue

Advanced-packaging sales ~$1B in 2025; includes SPIL and an EMS arm

Amkor

#2 OSAT

~$6.3B (2024)

~15% gross margin; Arizona plant; 10-year TSMC capacity agreement

JCET

China #1 OSAT

~$5–6B

Largest mainland-China assembler

TSMC (adv. pkg)

Foundry-integrated

CoWoS leader

~680k CoWoS wafers in 2025; allocates to Nvidia, Google, others

6. Business model and economics

Traditional OSAT is a high-volume, low-margin business: gross margins in the mid-teens, competing on cost, scale, and geographic footprint. Advanced packaging offers a path to better economics, but it requires heavy investment in wafer-level, fab-style equipment — which is precisely why the better-capitalized foundries can compete for it. The result is margin pressure from both ends: commodity assembly below, foundry encroachment above.

7. Demand drivers

•     AI and HBM. Stacking logic with high-bandwidth memory and integrating chiplets is the core of advanced-packaging demand.

•     The end of easy scaling. As transistor shrinks get harder, more performance comes from packaging — structurally favouring this segment.

•     CoWoS allocation. TSMC’s packaging capacity gates AI-GPU supply, with 2026 allocations reportedly reserved for Google’s TPU, Meta, OpenAI, and others.

8. Geopolitics and strategic dimension

Packaging has become a reshoring priority: the US CHIPS Act funds back-end capacity (Amkor’s ~$2 billion Arizona plant, with a 10-year TSMC agreement), and Europe is supporting its own. The US-China contest is also reshaping OSAT customer allocation, with Western firms diversifying away from China-based assemblers toward Vietnam, Taiwan, and the US. JCET and other Chinese OSATs, meanwhile, anchor a parallel domestic supply chain.

9. A framework for financial analysis

•     Distinguish traditional from advanced. Advanced-packaging mix and growth are the value drivers; traditional assembly is a thin-margin base.

•     Watch capex and utilization. A back-end capacity race raises overbuild risk; utilization is the cyclical signal.

•     Track foundry encroachment. How much advanced packaging TSMC and Samsung keep in-house caps the OSAT opportunity.

•     Mind margins. OSAT returns are structurally lower than foundries’ — advanced packaging is the path up, not a guarantee.

10. Key debates

•     Who captures advanced-packaging value? OSATs versus foundries (TSMC) versus IDMs — the segment’s defining contest.

•     Overbuild risk. Whether the simultaneous capacity race produces a glut in 2026–27.

•     Hybrid bonding leadership. Which players master sub-10-micron hybrid bonding at high yield.

11. Risk summary

•     Thin margins — structural, especially in traditional assembly.

•     Foundry encroachment — TSMC capturing the most profitable packaging in-house.

•     Capex / overbuild — a coordinated back-end build-out risks overcapacity.

•     Customer & geographic concentration — AI demand and reshoring politics both concentrate risk.

Teach-in Series 5 - Foundries
Teach In
Semiconductor Semi Teach In

Teach-in Series 5 - Foundries

The contract chip manufacturers — and TSMC’s extraordinary dominance

Economics & FinanceTech

The contract chip manufacturers — and TSMC’s extraordinary dominance.

What will TSMC's 3Q2026 operating margin be (guided 56-58%)?

<56%
0.00%
56-58%
0.00%
>58%
100.00%
1 Polls

Executive summary

Foundries are pure-play contract chip manufacturers: they fabricate chips designed by others and own no end-product IP. Their existence is what makes the fabless model possible. The segment is defined by one company’s dominance — TSMC, with roughly 70% of global foundry revenue and an even larger share at the leading edge — arguably the single most strategically important company in technology. TSMC’s 2025 revenue reached $122.4 billion (+36%) at a 59.9% gross margin, and it guided 2026 capital spending of $52–56 billion.

Behind TSMC, Samsung Foundry (a distant second, hampered by yield issues), China’s SMIC (growing despite export controls), and the mature-node specialists UMC and GlobalFoundries compete in a far less profitable tier. Intel Foundry is a heavily funded but still nascent challenger. The economics at the leading edge are brutal in capital but, for TSMC, exceptional in pricing power — its 2nm wafers reportedly price around $30,000 each.

1. Defining the sector and its strategic importance

A foundry sells manufacturing capacity and process technology, not products. Customers — fabless firms, IDMs, and system companies — send designs to be fabricated at an agreed price per wafer. Because virtually all advanced chips in the world are made by a handful of foundries (and overwhelmingly by TSMC), the segment is the physical chokepoint of the entire digital economy and the focal point of industrial policy.

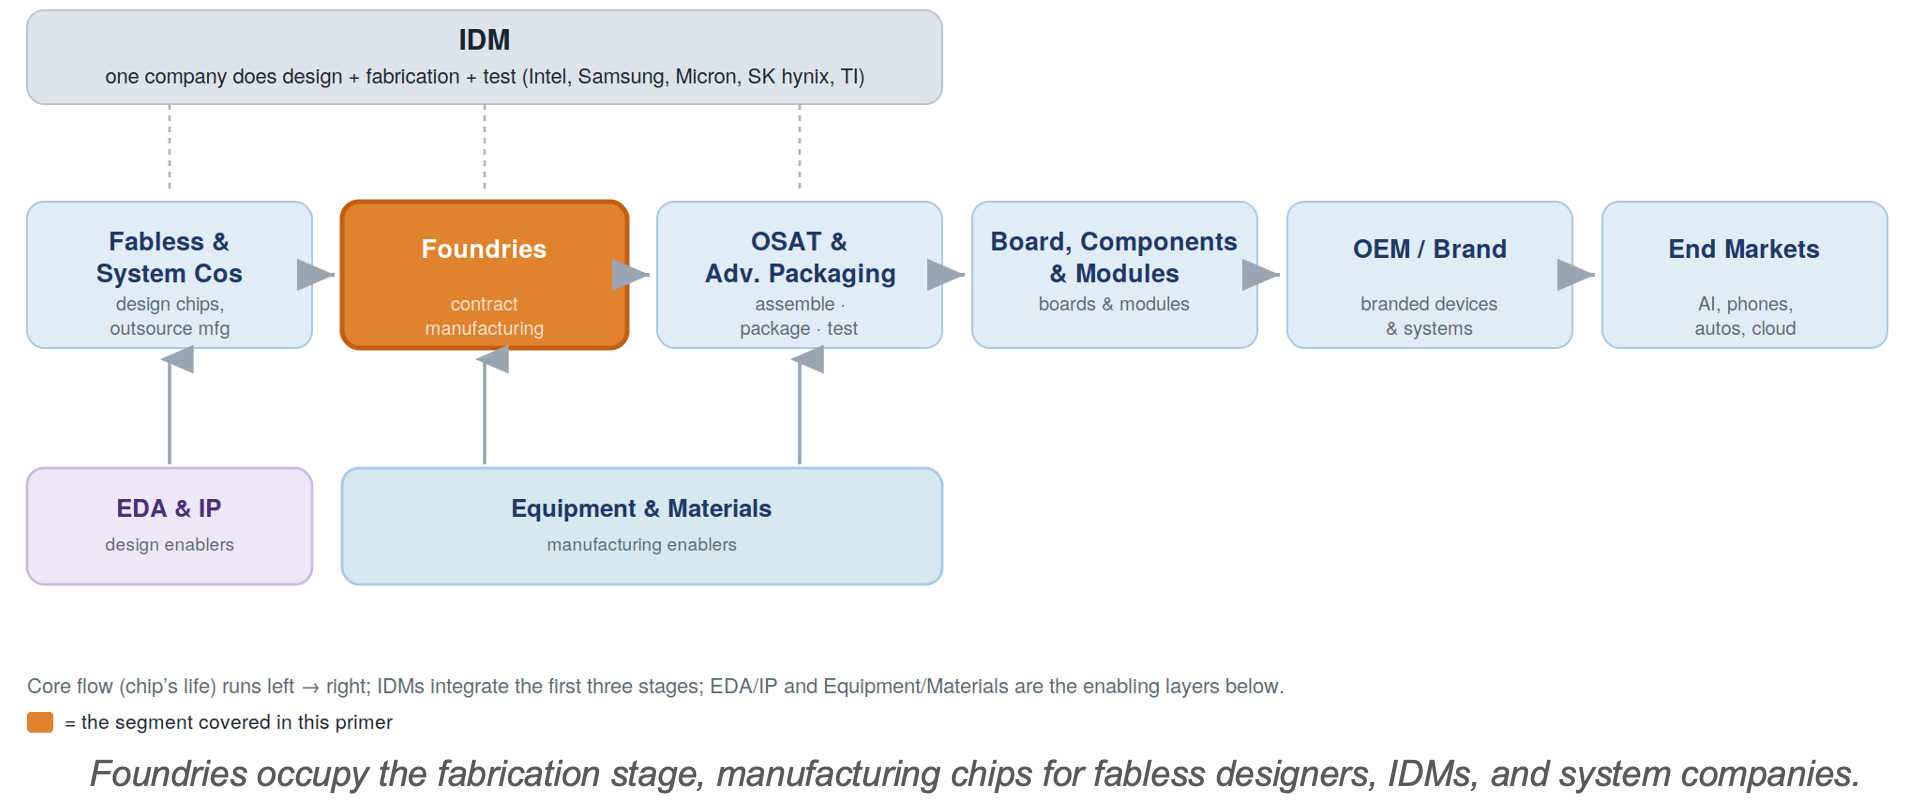
2. Position in the value chain

TSMC’s moat is built from process leadership, manufacturing yield, the breadth of its design ecosystem (IP, EDA support, and advanced packaging), and sheer scale — each reinforcing the others. Leading customers co-develop on its newest node, which funds the next node, which attracts the next generation of customers.