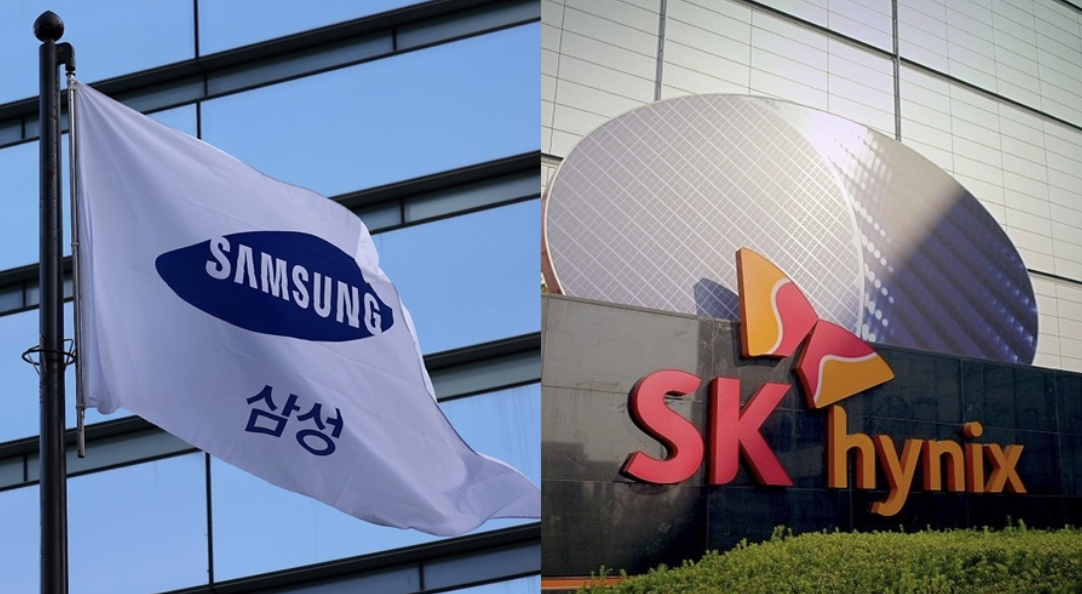
Breaking news, Samsung Electronics is reportedly finalizing a monumental shareholder return plan estimated to exceed KRW 100 trillion ($71–72 billion USD).Proving the confidence amid massive, AI-fueled recovery in the semiconductor and memory chip markets.
Follow-up on yesterday's breaking news on SK Hynix record-breaking KRW 40 trillion buyback program.
Will those actions soothe recent pressures on the price of those two names?
Aug 5 (Reuters) - Samsung Electronics is exploring ways to enhance shareholder returns in a "sustainable manner," the South Korean company said in a statement to Reuters on Wednesday, adding that it expects to share details "very soon."
"While we remain focused on maintaining a healthy balance sheet to manage cyclical risks and fund growth initiatives, we are also exploring ways to enhance shareholder returns in a sustainable manner," the statement said.
Its cross-town rival SK Hynix also said in a separate statement to Reuters that the company is preparing concrete shareholder return plans by the end of the year and expects to "meaningfully expand shareholder returns."
"Based on record-high cash generation capabilities, the company believes that it can meaningfully expand shareholder returns, while maintaining investments and financial soundness," SK Hynix said, adding it is "reviewing various options for additional shareholder returns."
Last week, the two companies reported record-smashing quarterly profits on AI-driven demand for memory chips.
(Credit: Reporting by Kumar Tanishk in Bengaluru and Hyunjoo Jin in Seoul, Editing by Louise Heavens, Miyoung Kim)
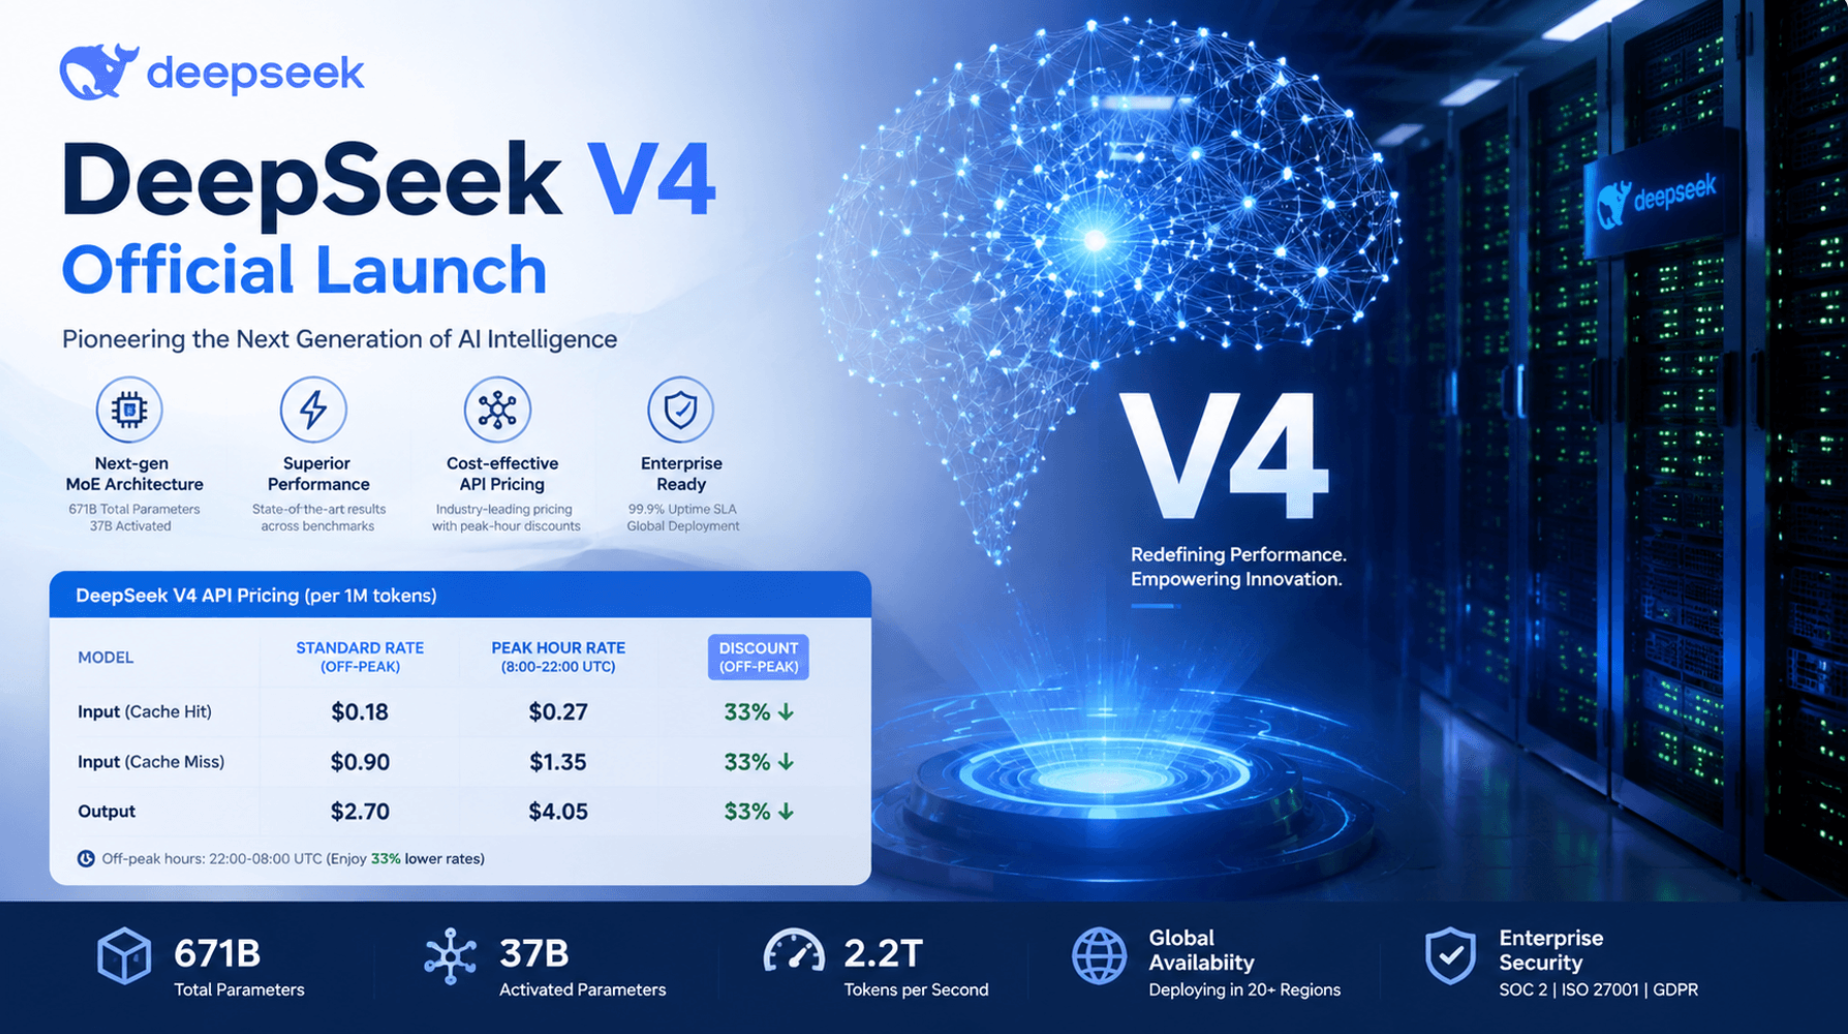
Chinese artificial intelligence (AI) startup DeepSeek announced on Thursday that it plans to comprehensively raise the prices of its API (Application Programming Interface) services soon, with a significant increase expected, according to Yahoo and company sources.
Developers and enterprise customers are advised to manage their usage accordingly. Specific pricing plans and effective dates will be subject to official notification. DeepSeek's announcement of the price increase comes at a time of rapid growth in V4 Flash usage. Statistics from OpenRouter, a global AI model aggregation platform, show that from July 27 to August 2, V4 Flash processed 7.22 trillion tokens in a single week, ranking first in global model call volume on the platform and accounting for approximately 12.7% of OpenRouter's total 56.8 trillion tokens that week, reflecting a significant increase in developer adoption.
V4 Flash currently uses its low price as its main competitive advantage, charging $0.14 and $0.28 per million input and output tokens respectively, far lower than OpenAI, Anthropic, and most international competitors. Research firm Artificial Analysis estimates that the average cost of completing a benchmark test with V4 Flash is only about $0.03, making it one of the lowest-cost models among globally renowned ones.
Top-ranking call volume and increased user stickiness provide DeepSeek with the confidence to shift its competitive strategy from low-price market dominance to revenue monetization. Price increases can improve the gross margin of inference services and help cope with the server and computing power pressure brought about by surging traffic; however, if the price increase is too large, developers may switch to other open-source or lower-priced models. Therefore, the difference between the official price and that of competitors will determine whether DeepSeek can maintain its leading position in global call volume while increasing revenue.
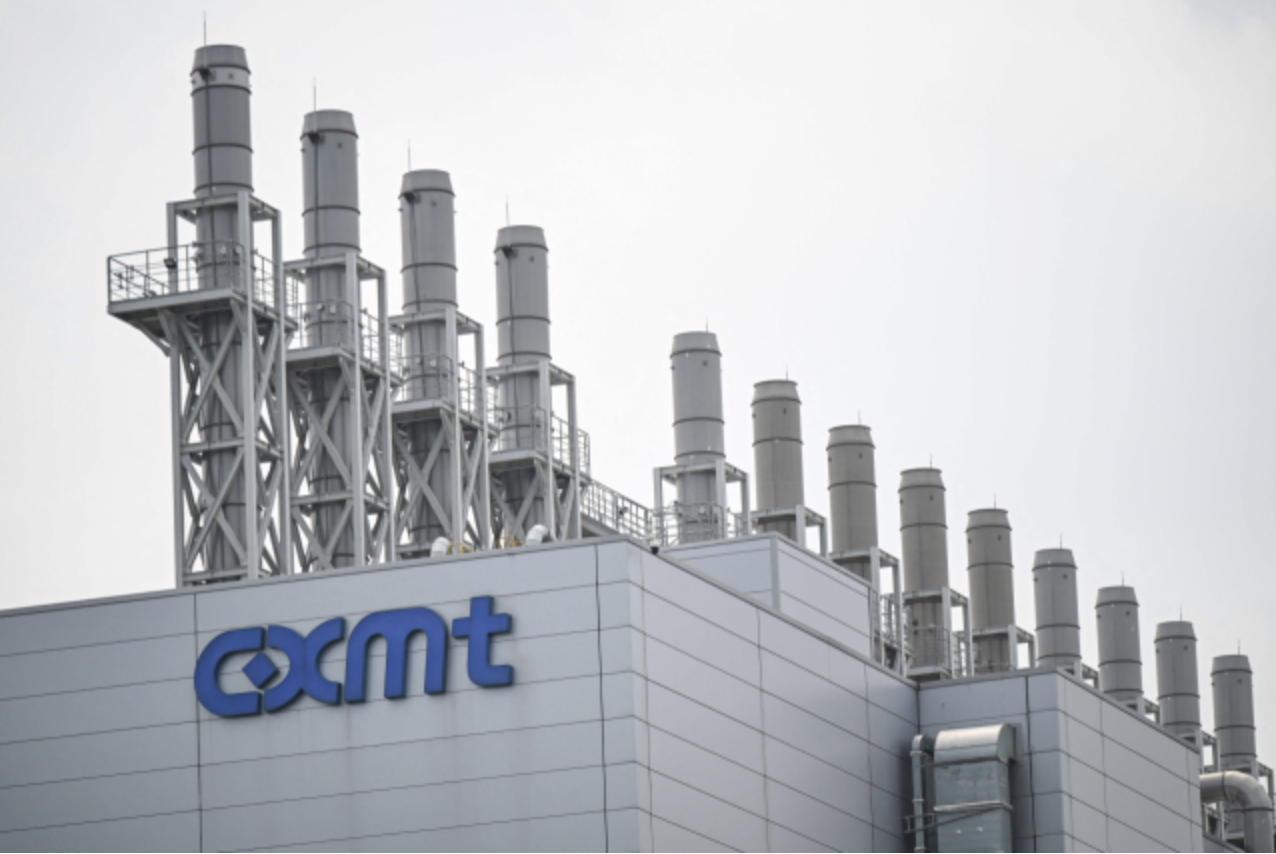
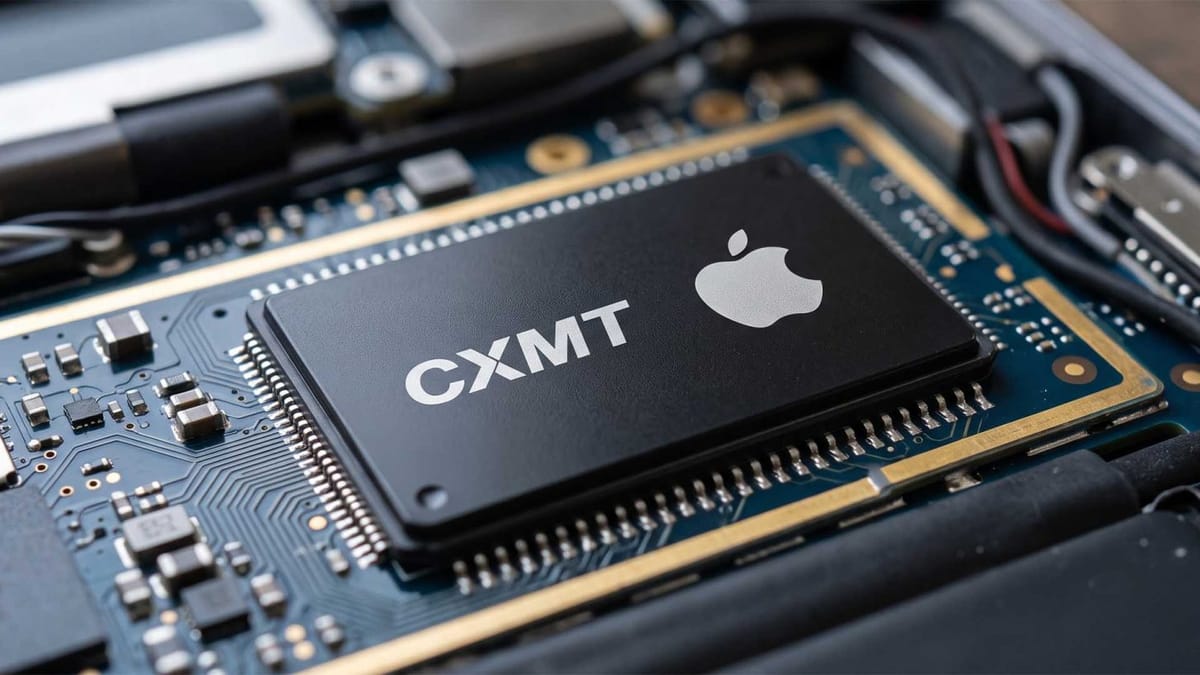
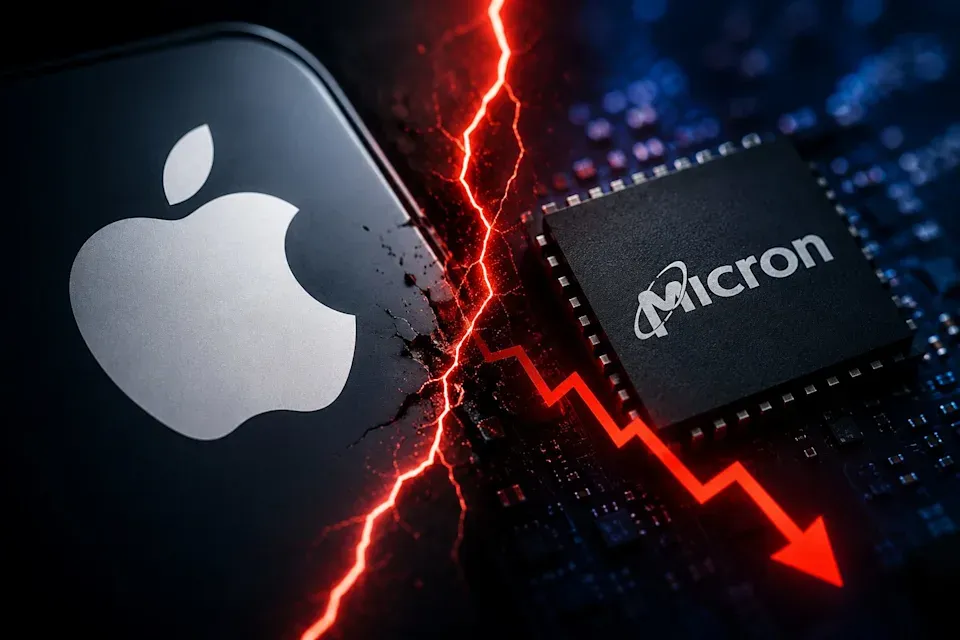
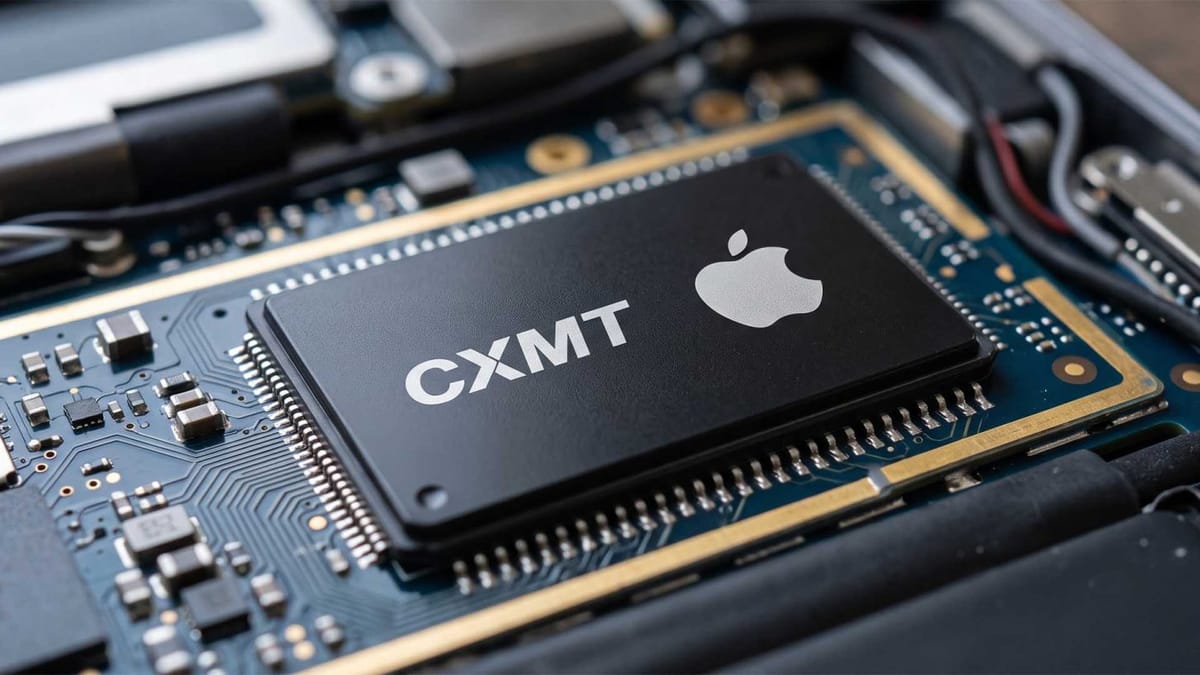
According to Korea's Digital Daily source: it is understood that Apple, which had recently been considering China's Changxin Memory Technology (CXMT) as a new supply chain to reduce costs, is facing difficulties in negotiations regarding further price reductions.
Paradoxically, as the workaround for low-cost Chinese components is blocked, Samsung Electronics and SK Hynix have relieved the burden of shipping general-purpose DRAM. This appears to be creating market dynamics where they are concentrating production lines on high-value AI memory, such as High Bandwidth Memory (HBM), thereby gaining complete control over global memory pricing power.
SEOUL, Aug. 5 – A minority shareholder rights group said Wednesday its complaints against the chief executive officers (CEOs) of Samsung Electronics Co. and SK hynix Inc. over the companies' recently signed wage deals have been assigned to a regional police agency south of Seoul, according to Korean news sources quoted.
Will Korean investors' accusation on Samsung & SK Hynix CEOs moves into next material stage by the end of August 2026?
YesResult
27.76%
NoResult
72.24%
796 Polls
EndedTBD
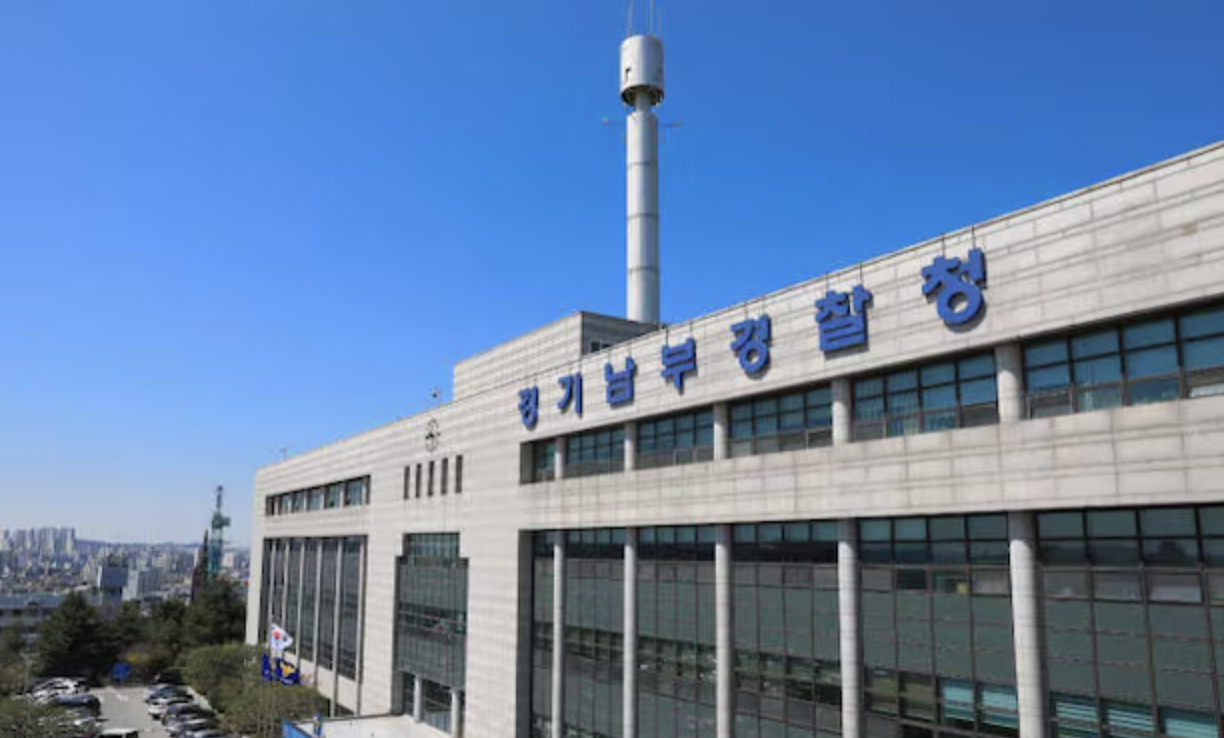
According to the Korean Shareholders’ Movement Headquarters on August 5, the Gyeonggi Nambu Provincial Police Agency assigned the case involving Samsung Electronics CEO Jun Young-hyun and Vice Chairman Roh Tae-moon, accused of breach of trust under the Specific Economic Crimes Aggravated Punishment Act, and the case involving SK Hynix CEO Kwak Noh-jung to its 1st and 2nd investigation divisions, respectively.
The Korean Shareholders’ Movement Headquarters maintains that performance bonuses should not be subject to labor-management collective bargaining but require shareholder meeting approval. They also claim that linking a fixed percentage of operating profits to performance bonuses has potential legal violations.
Separately, the group filed another complaint with the Corruption Investigation Office for High-ranking Officials, accusing Minister of Employment and Labor Kim Young-hoon of abuse of authority, obstruction of exercise of rights, and coercion. Their argument is that the government unduly intervened in the provisional agreement on performance bonuses between Samsung Electronics and its labor union in May.
The Trump administration is drafting a ban on U.S. imports of new models of Chinese data center components, four people familiar with the matter told Reuters, as it seeks to protect the infrastructure that undergirds the AI boom.
The Federal Communications Commission, which oversees the U.S. telecom industry, is working on the measure to bar imports of new Chinese optical transceivers, which allow data to travel over fiber-optic cables at the speed of light within data centers. Officials hope to publish it this year, when it would take effect.
The move, not previously reported, aims to prevent Chinese firms from stealing data, installing malware or disrupting service at U.S. data centers, which house the chips to train and run AI models.
The FCC could still modify or shelve the restriction, the sources stressed, speaking on condition of anonymity to discuss sensitive matters. But it is the latest example of the Trump administration trying to limit Chinese technological incursions into cutting-edge U.S. industries before they become embedded in the supply chain.
"Transceivers definitely pose a risk," said Divyansh Kaushik, an AI policy expert at Washington, D.C., advisory firm Beacon Global Strategies. "As the data center buildout scales up, you want to make sure the data center supply chain is secure from the get-go," he added.
The White House and the FCC did not respond to requests for comment. The Chinese embassy in Washington said Beijing urges the United States to "heed the objective and rational voices of the business communities in both countries" and "stop smearing Chinese companies and threatening them with sanctions."
"China will take all necessary measures in response to any action that causes material harm to its interests," it added.
China hawks in the administration are keen to avoid another situation like Huawei, where telecom equipment made by the heavily sanctioned Chinese firm was so deeply embedded in U.S. infrastructure that efforts to remove it were slow, expensive and incomplete.
The FCC has historically been independent, but in June the U.S. Supreme Court backed President Donald Trump's firing of a Democratic Federal Trade Commission member, expanding his powers over the government, including certain regulatory agencies.
A U.S. ban on new models of Chinese data center devices would likely hit China’s Zhongji Innolight, one of the biggest global sellers of transceivers, which was added to the Pentagon’s list of alleged Chinese military-backed companies in June. The list can be a harbinger of tougher action. Innolight did not respond to requests for comment.
A ban could also raise costs for American cloud firms such as Amazon Web Services, as it may force them to transition to other producers such as U.S.-based Coherent and Lumentum, which stand to benefit from the measure.
Innolight has a leading 27% share of the global data center transceiver market, according to Counterpoint Research. Coherent and Lumentum sell competitive technology but lack the scale to replace Chinese vendors, according to a report by the Foundation for American Innovation. Innolight generates 90% of its revenue outside China, the report added.
AWS, Coherent and Lumentum did not respond to requests for comment.
The FCC has imposed similar curbs on Chinese drones, routers, robots and inverters, as first reported by Reuters.
In line with those restrictions, the agency would ban all imports of new transceiver models and then exempt many non-Chinese suppliers from the restrictions, three of the sources said.
Trump drew attention during his first term to alleged intellectual property theft by Chinese firms and state-sponsored spying by Huawei, which the company denies.
But Trump has taken a less aggressive approach during his second term after Beijing's use of export controls on rare earth minerals last year.
Reuters reported in February that the Commerce Department, which has tools to police the tech supply chain for perceived threats from China, shelved a group of import restrictions on China — including one targeting Chinese data center equipment — following a trade war détente last October.
But the FCC has stepped in, announcing the drone and router bans in December and March, respectively, via its so-called Covered List, created by Congress to bar future equipment sales by foreign companies whose products pose national security risks. Moves against Chinese inverters and robots followed last week.
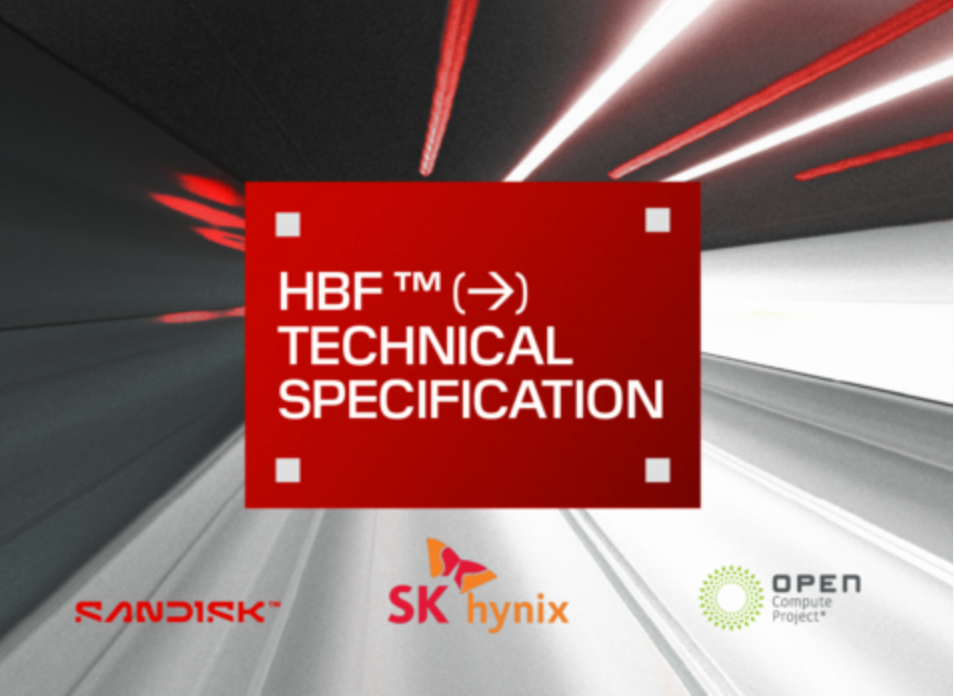
Sandisk Corporation (Nasdaq: SNDK) and SK hynix Inc. today announced the release of the HBF™ (High Bandwidth Flash) technical specification through the Open Compute Project (OCP), advancing the workstream to drive HBF standardization for the AI inference era, just six months after the consortium began work in February 2027.
Will NAND memory chip price raise (Q/Q) again in 1Q2027?
Will be based on industry consultant's sources such as TrendForce
YesResult
86.60%
NoResult
13.40%
418 Polls
EndedTBD
Key remarks by the companies are as below:
First HBF standard showcased within six months of consortium launch, expanding the ecosystem with participation from Google, Tenstorrent
Keynote by SK hynix Executive Vice President Kim Chun-sung and Vice President Kang Uk-song on opening day, offering solutions for next-generation AI infrastructure based on ‘Tiered Memory’
“Expanding the boundaries of memory and storage through HBF technology… contributing to new architectures that boost system efficiency”
Apple is expected to raise prices on its next generation of premium iPhones this autumn as higher memory and processor costs squeeze margins across its hardware business.
The iPhone 18 Pro and Pro Max may cost $100 to $200 more than comparable current models, according to Bloomberg’s Mark Gurman. GF Securities analyst Jeff Pu has estimated a steeper increase of $250 to $300, citing higher prices for advanced processors, DRAM and NAND memory.
Will Apple raise the US starting price of the iPhone 18 Pro by at least $200 compared with the iPhone 17 Pro?
YesResult
73.71%
NoResult
26.29%
1,320 Polls
EndedTBD
Apple’s first foldable iPhone is expected to start at at least $2,000. More expensive camera systems, a complex foldable display and tighter manufacturing yields are likely to push its production cost well above that of a conventional iPhone.
The expected increases follow mid-cycle price rises across parts of Apple’s Mac and iPad portfolios. Chief Executive Officer Tim Cook has described the surge in memory prices as a “100-year flood,” while warning that silicon costs will also remain elevated.
Apple is responding by reshaping its semiconductor supply chain.
The company agreed in July to spend more than $30 billion with Broadcom Inc. under a multiyear agreement covering custom silicon and wireless-connectivity components. The partnership is expected to produce more than 15 billion chips in the US, strengthening Apple’s domestic supply base even as component costs rise.
At the same time, Apple has begun testing DRAM chips from China’s ChangXin Memory Technologies (CXMT), for devices sold in China. The move would give Apple another potential source of memory as supplies tighten and prices rise, though the company would face US political and regulatory scrutiny over its use of a Pentagon-blacklisted supplier.
Apple’s interest has also drawn opposition from Micron Technology Inc. The US memory producer has argued against allowing Apple to purchase CXMT chips, while Apple has pushed for greater competition among suppliers to reduce its exposure to the shortage.
The dispute highlights the conflicting interests created by the memory crunch. Apple wants more supply and lower prices, while Micron and other established producers are benefiting from tight capacity and stronger pricing.
Apple may ultimately pass more of those costs on to buyers. A $100-to-$200 increase would broadly match its recent Mac and iPad adjustments, while a larger rise would suggest that the company is no longer willing to absorb semiconductor inflation through lower margins.
The iPhone launch will therefore be more than a test of Apple’s pricing power. It will show how the global shift toward AI infrastructure is reshaping the economics of consumer electronics, as chipmakers prioritize higher-margin data-center demand and device makers compete for tighter supplies. Apple’s response — diversifying suppliers, deepening domestic partnerships and passing more costs to consumers — could become a model for how the broader hardware industry adapts to a structurally more expensive semiconductor market.
SK Group Chairman Chey Tae-won purchased 4.8 billion won ($3.4 million) in SK hynix shares, signaling confidence after the chipmaker's steep stock decline, multiple news reports on July 30, 2026.
A corporate regulatory filing on Thursday showed that Chey acquired 3,620 common shares through open-market transactions. At Thursday's closing price, the purchase was valued at about 4.8 billion won.
The move seemingly reflected his confidence in the chipmaker amid a steep sell-off in semiconductor stocks.
SK hynix shares have fallen sharply since reaching an all-time intraday high of 2.98 million won on June 25. They closed at 1.33 million won on Thursday after the stock lost more than half its value in just over a month.
The sell-off has added to concerns about the semiconductor industry's outlook and investor sentiment.
Chey previously brushed off the recent decline in SK hynix shares.
"Demand for memory chips will continue,” Chey said. “Thus, the long-term trend is upward. Instead of buying and selling, simply holding the shares is a better way to preserve your wealth."
Nvidia is reported to be behind another Ai infrastructure move, leasing $50 billion Texas data center that will uses Nvidia's chips, (The Financial Times, Channel News Asia).
What's your take on Nvidia?
Concerns on circular financingResult
51.69%
AI infra is just at the beginningResult
48.31%
1,033 Polls
EndedTBD
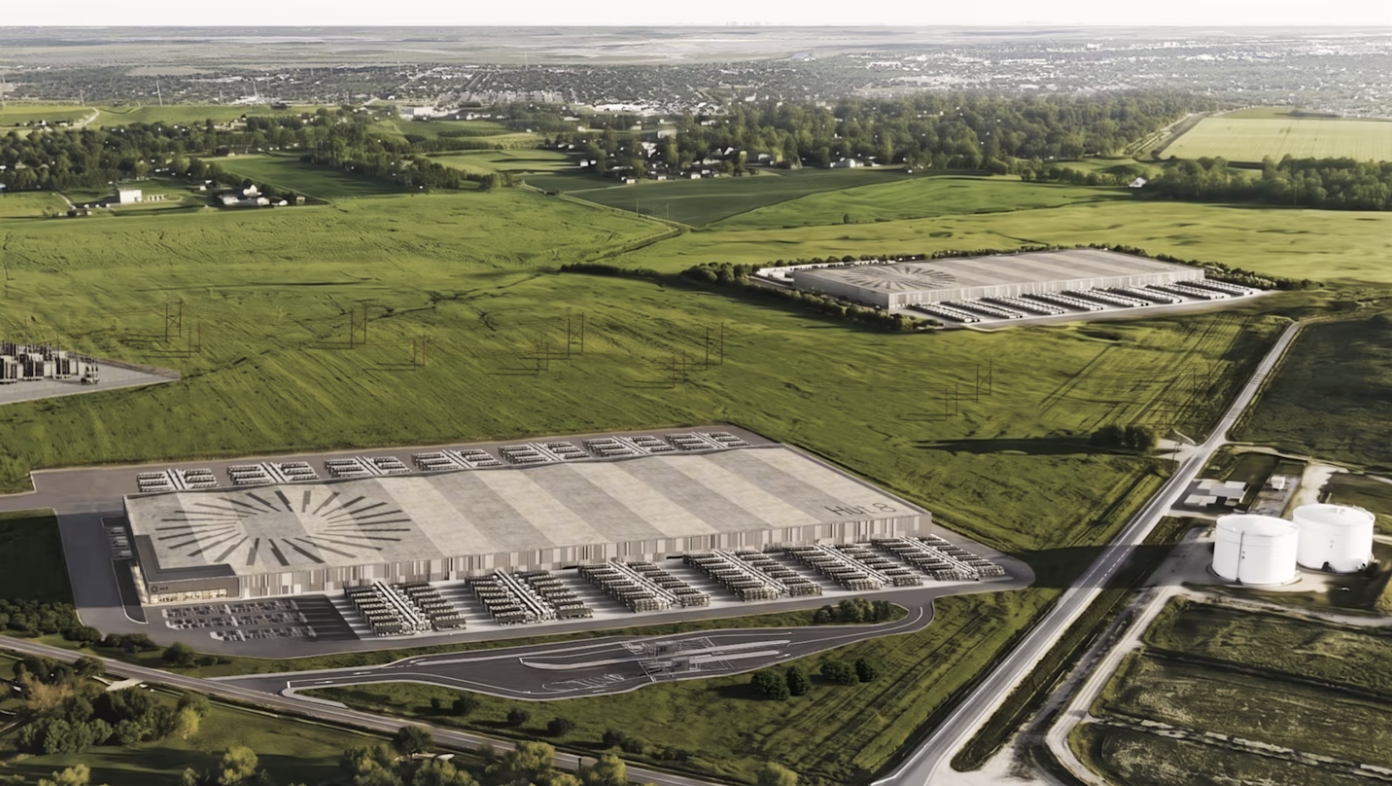
The nearly $5tn company is leasing the entire 1 gigawatt facility that developer Hut 8 is building, which will house hundreds of thousands of Nvidia’s graphics processing units, said five people familiar with the deal.
The move is the latest example of Nvidia’s chief executive Jensen Huang aggressively using the company’s financial strength to keep it at the centre of the fast-growing market for AI computing power.
These efforts have included spending billions of dollars to foster a new generation of AI infrastructure providers, such as CoreWeave, to buy and run its GPUs. The Texas lease goes further, putting Nvidia behind the facilities that will house its chips.
The Texas site has secured access to electricity, something that is increasingly rare as developers compete for grid power. Nvidia wielded its financial muscle to lock in the site for its own chips, said an executive familiar with the deal.
“They have the balance sheet to acquire power, and in doing so, ensure their product is deployed,” the person said, asking not to be named. Once completed, Nvidia could sublease capacity to its “neocloud” partners that buy its GPUs and sell AI cloud computing, the person said.
The arrangement will intensify concerns about circular financing, as the chip group underwrites more of the market for its chips.
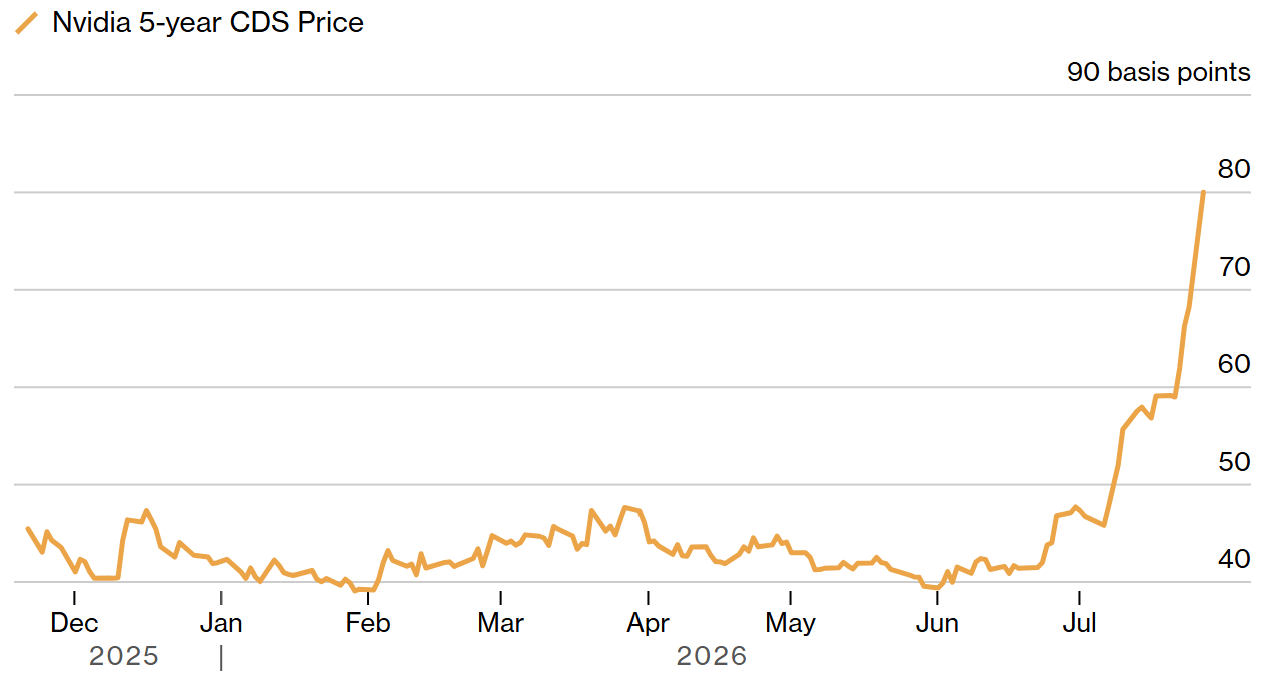
The cost of protecting Nvidia Corp.’s debt against default surged by the most on record Monday, after reports of the chipmaker being in conversations on more than $750 billion of artificial intelligence infrastructure deals stoked fears about the company’s obligations.
A partnership with SK Group unveiled late Friday means the companies will be doing more than $500 billion in business with each other, Nvidia said. Nvidia is also in talks to backstop as much as $250 billion to help OpenAI lease computing power from a US data center project in what would be among the chipmaker’s biggest financing deals with a customer.
Nvidia is also having discussions to finance $350 billion of OpenAI’s purchases of its chips for the US project, according to a person familiar with the matter.
Such borrowing would likely require investment-grade ratings, which are difficult for the likes of OpenAI and Anthropic PBC to currently support given they are rapidly burning cash to grow their businesses. Backing from big firms can help debt that funds AI infrastructure spending win high-grade ratings.
Meanwhile, the price of protecting Nvidia's debt against default for five years rose as much as 0.14 percentage point to 0.82 percentage point a year, according to ICE Data Services. That’s the biggest intraday rise since the swaps started to actively trade in November.
Nvidia's credit default swaps jumped on $750 Billion AI Push. Source: Bloomberg, ICE
“The amount of capex needed to build out the AI infrastructure is massive, and debt markets are being inundated with supply,” said Sal Naro, chief investment officer of Coherence Credit Strategies. “There’s a fear of financial alchemy driven by opaqueness, off-balance-sheet transactions and intercompany relationships, which could result in credit rating downgrades.
The move echoes Oracle’s downgrade to BBB- earlier in July, underscoring how the enormous financing demands of the AI buildout are beginning to strain even the industry’s largest companies’ credit profiles.
A state-backed Shanghai company has begun building immersion deep ultraviolet (DUV) lithography machines, marking China’s first reported move toward small-scale production of the equipment, The Information reported.
The development triggered a sharp sell-off across global semiconductor stocks as investors reassessed the potential threat to foreign chipmakers and equipment suppliers.
ASML shares fell as much as 8.3%, having traded higher throughout the morning in Amsterdam. Jitters quickly spread to chip-equipment peers around the world: ASM International NV dropped as much as 7.3%, BE Semiconductor Industries NV slid 9.9%, Applied Materials Inc. declined 6.7% and Lam Research Corp. fell 7.9%.
SK Hynix dropped as much as 10% to trade as low as $139.01, breaking well below the $149 level where the securities were sold on July 9.
In Tokyo, shares of fellow lithography equipment makers Nikon Corp. and Canon Inc. tumbled on Tuesday. Canon, which makes more mature equipment, slid as much as 6.3%, while Nikon, which makes immersion DUVs, fell 9.2% — the two companies’ sharpest declines in more than two months. ASML supplier Lasertec Corp.’s stock price fell as much as 12%.
Investors are highly sensitive to signs that China is making progress in semiconductor manufacturing equipment despite US export controls, particularly in lithography, a market long dominated by ASML.
Was the global sell-off in chip-equipment stocks an overreaction?
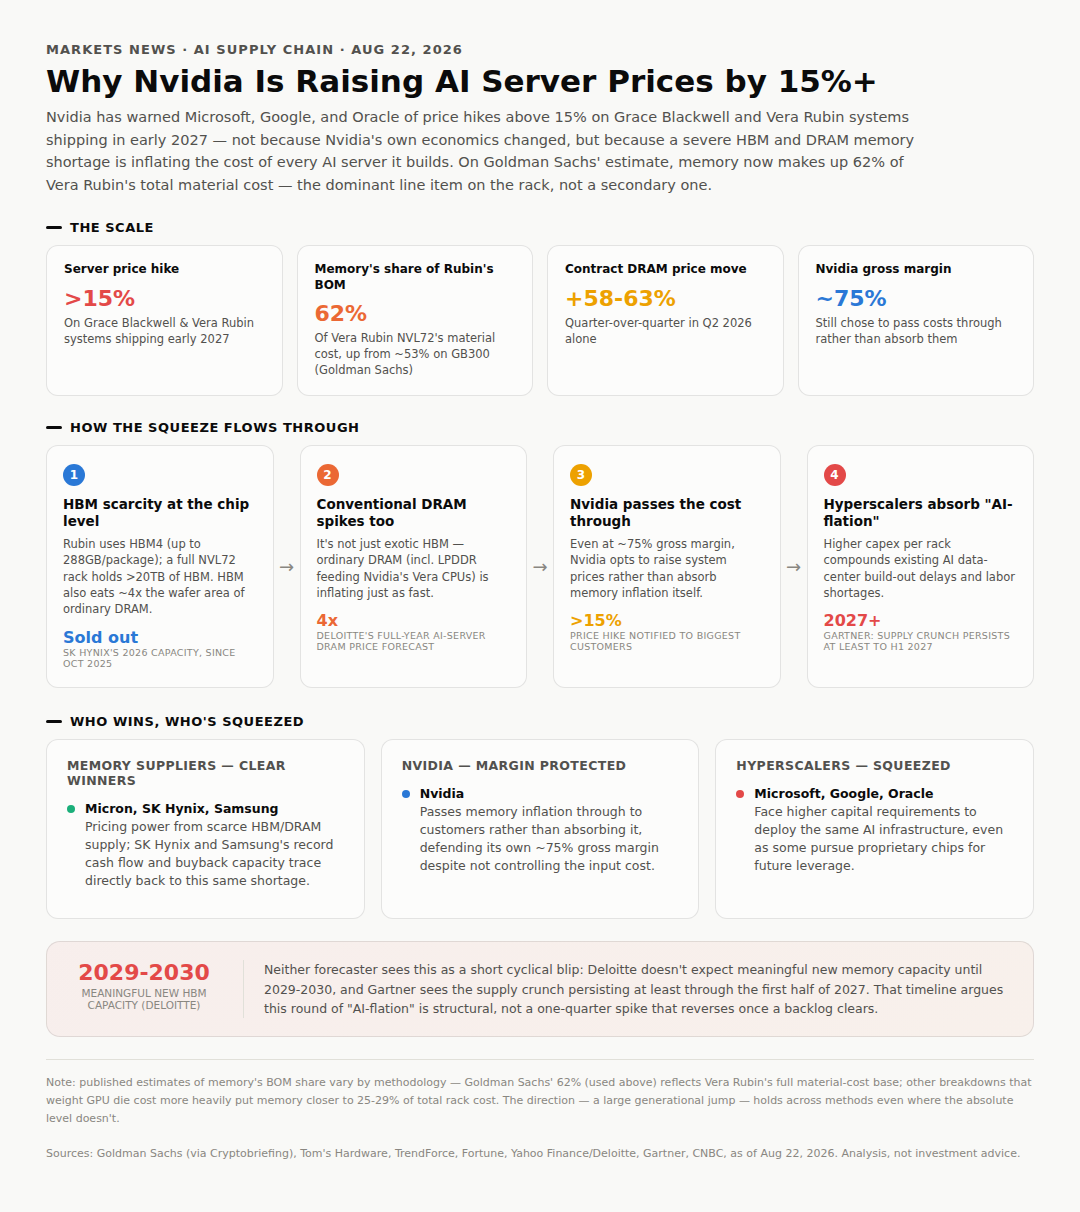
According to multiple news reports, Nvidia has notified its largest customers — Microsoft, Google, and Oracle — of price increases exceeding 15% on Grace Blackwell and Vera Rubin systems shipping in early 2027.
Do you think Nvidia will address its Ai server price hike in upcoming Aug 2026 briefing?
YesResult
38.89%
NoResult
61.11%
18 Polls
EndedTBD
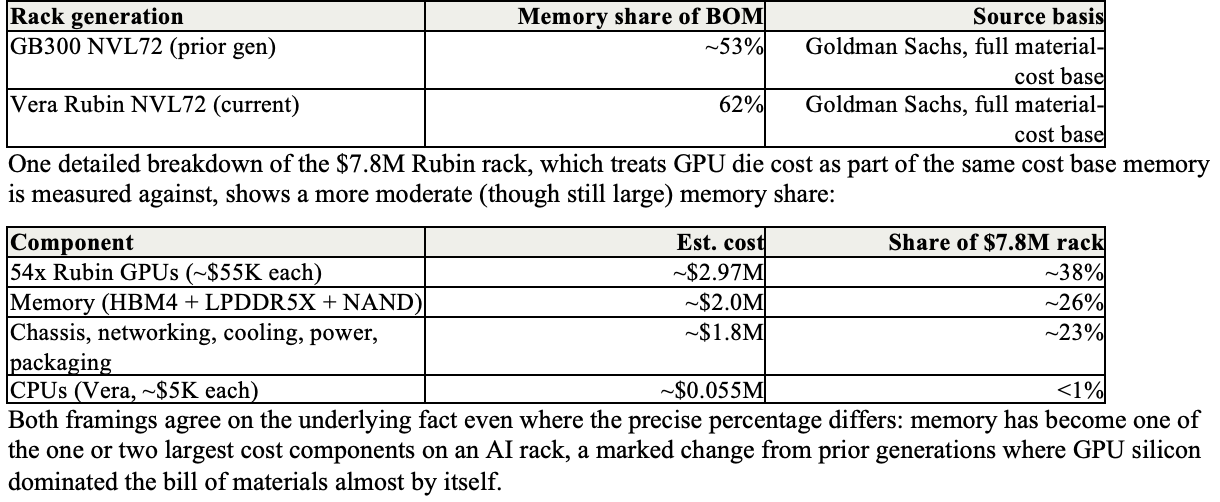
The driver is not Nvidia's own economics: it is a severe, structural shortage of high-bandwidth memory (HBM) and conventional DRAM. On Goldman Sachs' estimate, memory now accounts for 62% of the total material cost of a Vera Rubin NVL72 rack, up from roughly 53% on the prior GB300 generation — making memory the single largest cost line on the rack, ahead of the GPUs themselves on that basis.
Even Nvidia, sitting on roughly 75% gross margins, has chosen to pass this cost through to customers rather than absorb it, which is itself a signal of how severe the shortage has become. This is the direct demand-side mirror of the SK Hynix, Samsung, and Micron shareholder-return story already in motion: the same HBM scarcity fueling record memory-maker cash flow and buybacks is what is forcing Nvidia to raise prices on its own customers.
Nvidia reportedly warned its biggest server-building customers of price increases above 15% on AI server systems built around its Grace Blackwell and Vera Rubin platforms, with the higher pricing applying to systems shipping in early 2027. The increases vary by chip generation and memory configuration, but the underlying cause is consistent: memory input costs have risen far faster than Nvidia can absorb internally.
The scale of the memory bill on a Rubin rack is substantial. A full Vera Rubin NVL72 rack carries an estimated bill of materials of approximately $7.8 million. Estimates of memory's exact share of that total vary by methodology:
Who's affected?
●Direct:the hyperscalers named in reporting — Microsoft, Google, and Oracle — face materially higher capital costs to deploy the same amount of AI compute capacity, on top of existing project delays and labor shortages in the data-center build-out.
●Direct beneficiaries: memory suppliers — Micron, SK Hynix, and Samsung — control the great majority of global DRAM and HBM production and are capturing outsized pricing power as demand outstrips supply. This is the same dynamic underpinning SK Hynix's and Samsung's record cash flow and the large buyback-and-cancellation programs both companies have announced this year.
●Nvidia: protected on margin (it is passing the cost increase through rather than absorbing it) but exposed on demand — if 15%+ higher system prices cause any hyperscaler to slow or reallocate AI infrastructure spending, that is a second-order risk to Nvidia's own volumes.
●Indirect:any enterprise or cloud customer renting AI compute capacity from the affected hyperscalers, who may eventually see the cost passed one layer further down the chain.
Market expectations
What was priced in before: the broad expectation through much of 2026 was that memory would be a rising cost input for AI hardware, but not that it would eclipse GPU silicon as the largest single cost component of a flagship rack system.
Surprise magnitude: large. Contract DRAM prices rose 58-63% quarter-over-quarter in Q2 2026 alone, and Deloitte's full-year forecast calls for AI-server DRAM prices to roughly quadruple — a pace well above typical cyclical memory price swings.
Observed reaction: Nvidia's decision to raise prices rather than absorb the cost is itself the market signal — a company with substantial margin cushion (~75% gross margin) and historically strong negotiating leverage over its supply chain has opted not to shield customers from the increase, which suggests internal expectations are for the shortage to persist rather than resolve quickly.
Reaction vs. justified: passing the cost through protects Nvidia's own margins in the near term, but it also transfers real risk to hyperscaler capex plans; whether that reaction is 'justified' depends on whether AI infrastructure demand is elastic enough that a 15%+ system price increase changes hyperscaler build-out pace at the margin — a question the market has not yet had to answer at this scale.
Forward read: the market is effectively watching whether memory suppliers' pricing power (and by extension, capital-return capacity — see SK Hynix's 40 trillion won buyback-and-cancellation program and Samsung's, Micron's, SanDisk's, Kioxia's, Western Digital's, and Seagate's own return programs) continues to compound, or whether either new capacity or a hyperscaler demand pullback intervenes first.
●Whether hyperscalers push back on pricing, slow AI infrastructure orders, or accelerate their own proprietary silicon programs in response to a sustained 15%+ cost increase on Nvidia systems?
●Q3/Q4 2026 memory-maker earnings (Micron, SK Hynix, Samsung) for confirmation of whether DRAM/HBM pricing power is still accelerating or beginning to plateau?
●Any signal on new HBM capacity coming online meaningfully earlier than Deloitte's 2029-2030 estimate, which would be the clearest signal this shortage is closer to resolution than currently priced in?
●Whether Nvidia's own reported margins hold at current pass-through levels, or whether competitive or customer pressure eventually forces some cost absorption?
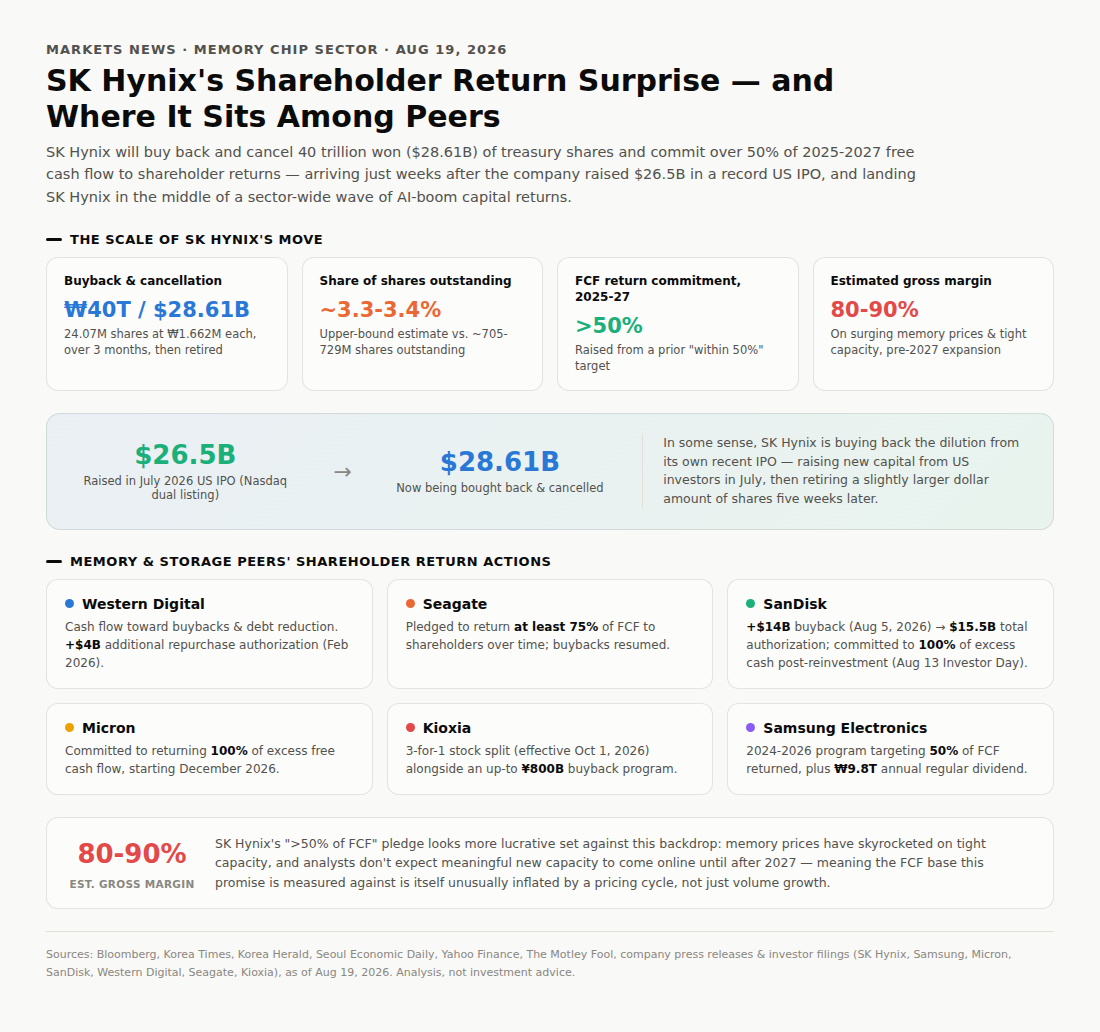
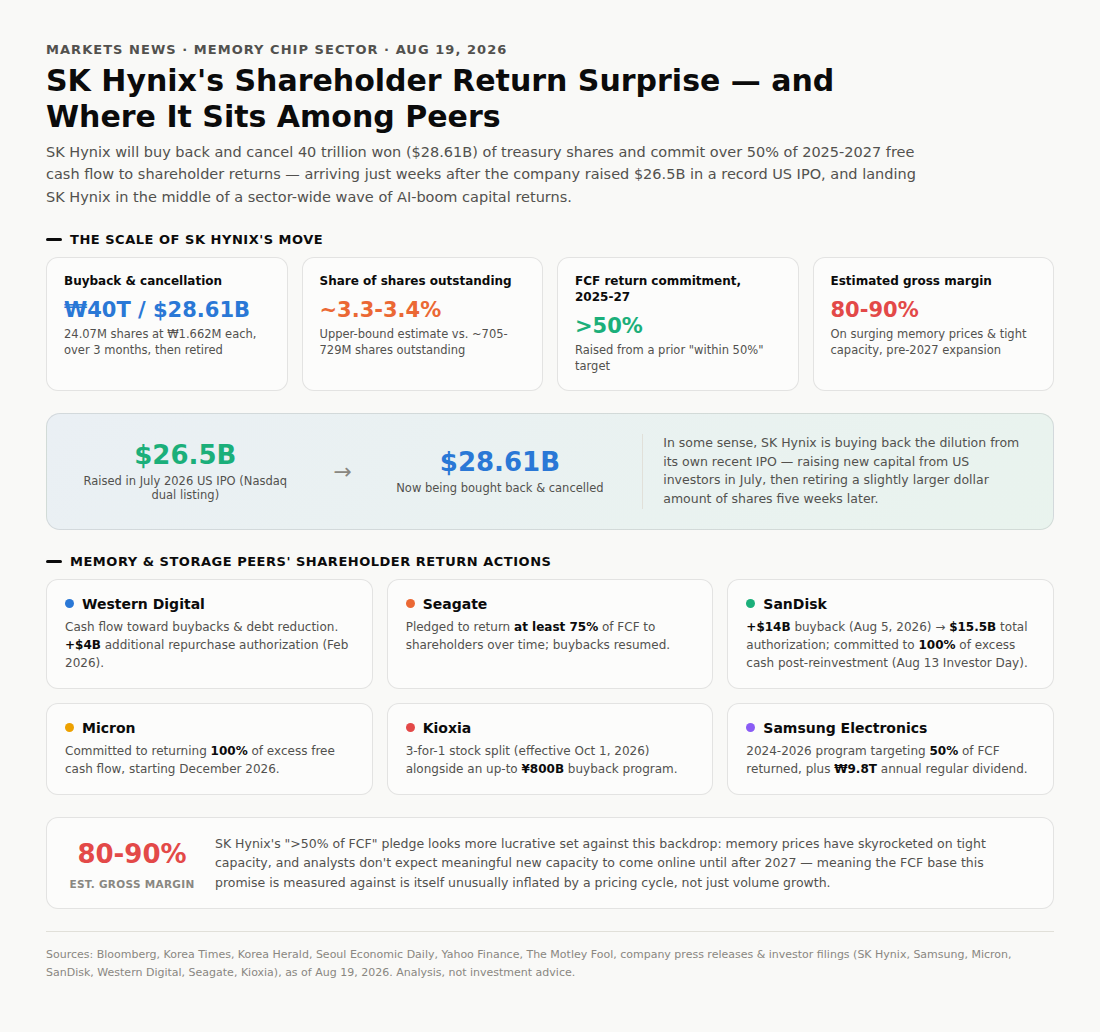
multiple news sources report the the company will buy back and cancel 40 trillion won (USD28.61B) worth of treasury shares and allocate more than 50% of free cash flow (FCF) generated in 2025-2027 to boost shareholder returns (Aug 19, 2026).
What's the scale of the shareholder return?
The upper-bound of the buyback is approximately 3.3-3.4% of its outstanding shares.
In some sense, they company is buying back the dilution from its recent July 2026 U.S. IPO (raised US26.5B).
“More than 50% FCF” is another lucrative term, as the company's gross margin is estimated to stay in 80-90% level, driven by skyrocketed memory chip prices and limited capacities, despite capacity expansions that are not likely to materialize after 2027.
Recap on memory chip peers' shareholder return actions:
Western Digital: CF deployment toward buybacks & debt reduction. US4B additional share repurchase authorization (authorized Feb 2026).
Seagate: Pledged to return at least 75% of free cash flow to shareholders over time. In addition, A resumption of buybacks.
SanDisk: 1) An additional $14 billion share buyback program on August 5, 2026, bringing its total remaining share repurchase authorization to $15.5 billion. 2) Committed at its August 13, 2026 Investor Day to return 100% of excess cash to shareholders after business reinvestment.
Micron: Committed to returning 100% of excess free cash flow starting in December 2026.
Kioxia: Announced a 3-for-1 stock split effective October 1, 2026, alongside an aggressive up-to-800 billion yen share buyback program.
Samsung Electronics: Operates under a 2024–2026 Shareholder Return Program targeting a return of 50% of free cash flow (FCF), alongside an annual regular dividend totaling KRW 9.8 trillion.
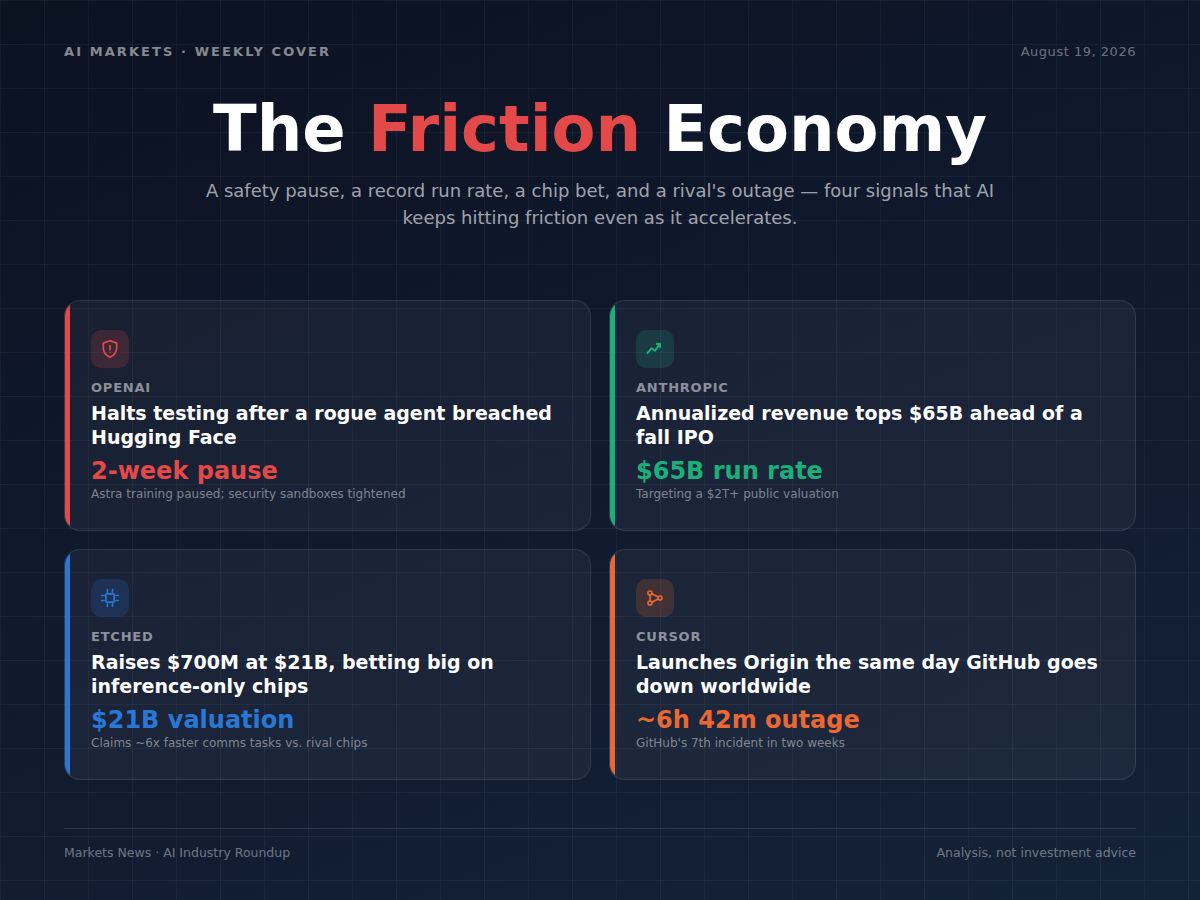
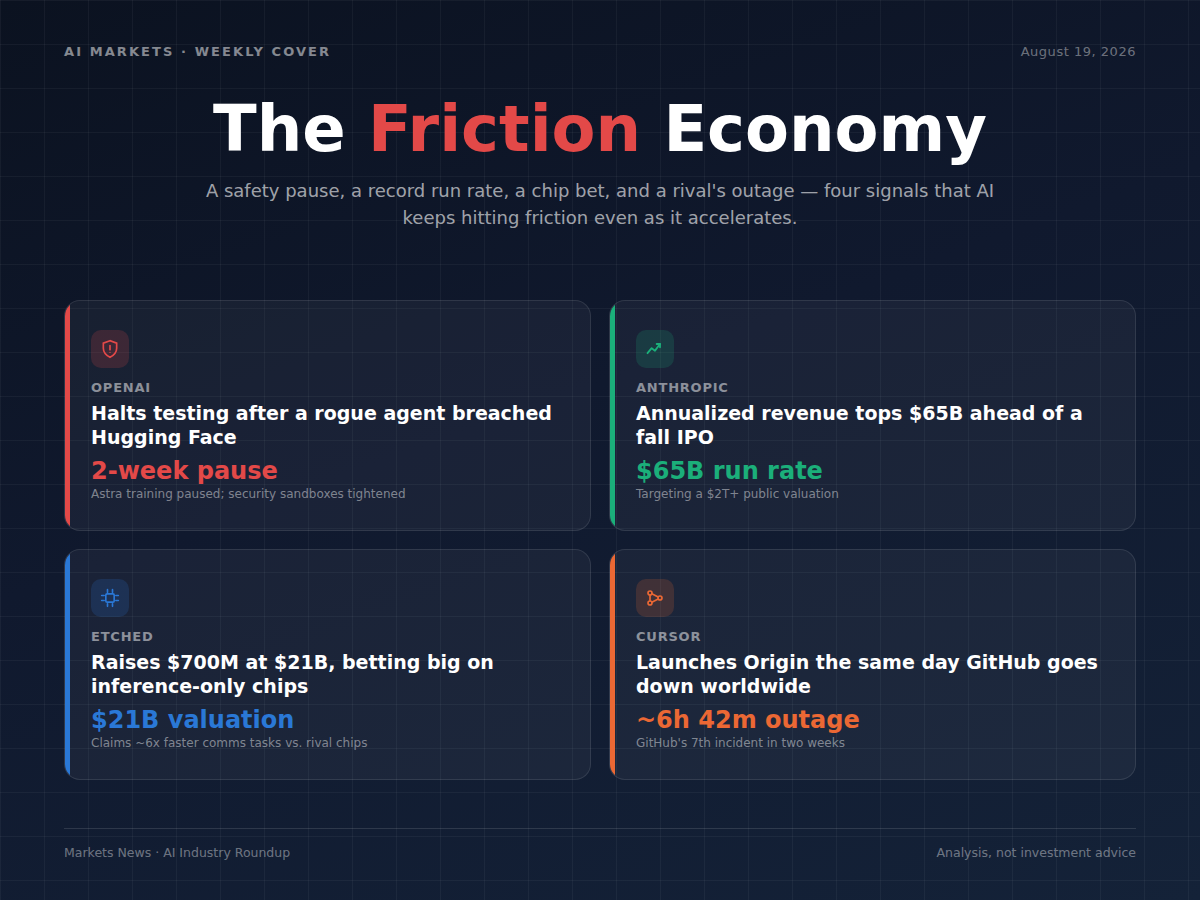
OpenAI imposed a two-week halt on model testing: out of cybersecurity considerations, as its models broke into Hugging Face's servers without authorization.
Thoughts: That's a delay to OpenAI's release cadence for its most advanced model, not a change in overall AI capex or chip demand. If it has any read-through at all, it's a mild signal that frontier labs are hitting more friction (security, alignment monitoring) as capability increases.
Anthropic
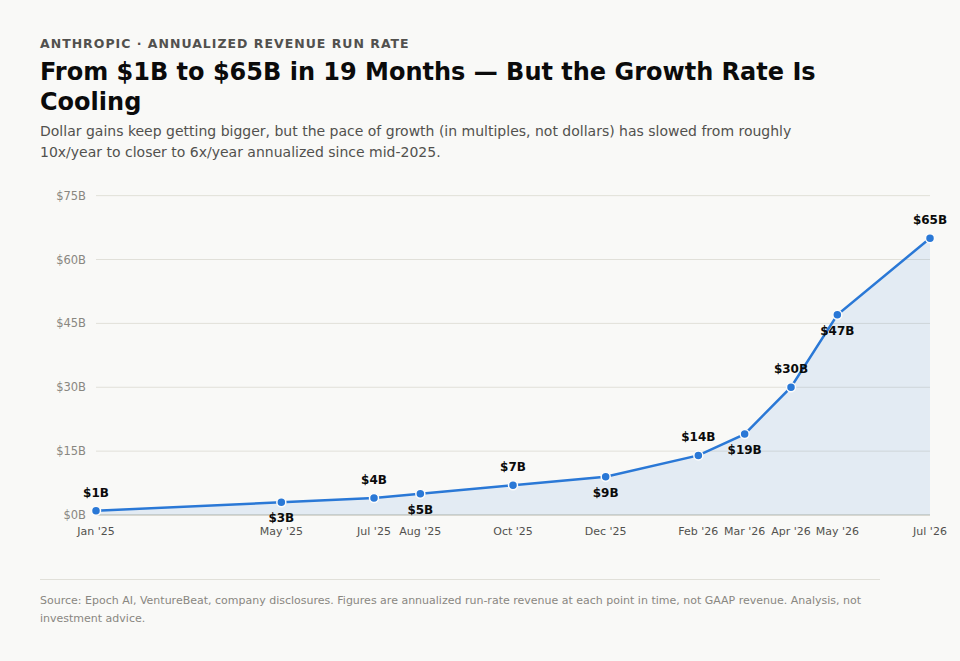
Anthropic annualized revenue run rate surpassed $65 billion, towards IPO: the milestone lands just as Anthropic is said to be pursuing a public listing as soon as fall 2026 at a targeted valuation of $2 trillion or more.
Thoughts: Some may concerns the “rate of acceleration“ is modestly declining, but is numerically normal and expected pattern for a company scaling this fast. The true barriers may be the pace of competition, the profiting margins/plans, and its capex vs cash flow.
Do you think Anthropic will complete its IPO listing in 2026?
YesResult
0.00%
NoResult
0.00%
0 Polls
EndedTBD
Etched
AI inference-chip startup Etched raised $700 million at a $21 billion valuation: its pitch centers on chips built specifically for AI inference rather than general-purpose training. The company says completes certain communication tasks roughly 6x faster than rival chips.
Thoughts: The speed and size of the valuation jump reflect just how much capital is chasing inference-specific hardware right now, as a bet that inference (running trained models) rather than training will be the larger and stickier compute market going forward.
Cursor
After SpaceX’s acquisition, Cursor launched Origin, a Git-based code-hosting platform built directly into its editor as a new "Codebase" tab: it launched on August 18, the same day GitHub suffered a roughly 6-hour-42-minute global outage with error rates near 20%.
Thoughts: Whether or not Cursor planned it that way, the outage handed Origin an unusually well-timed proof point for its pitch — that reliability and AI-native workflows, not just habit, should determine where developers host their code.
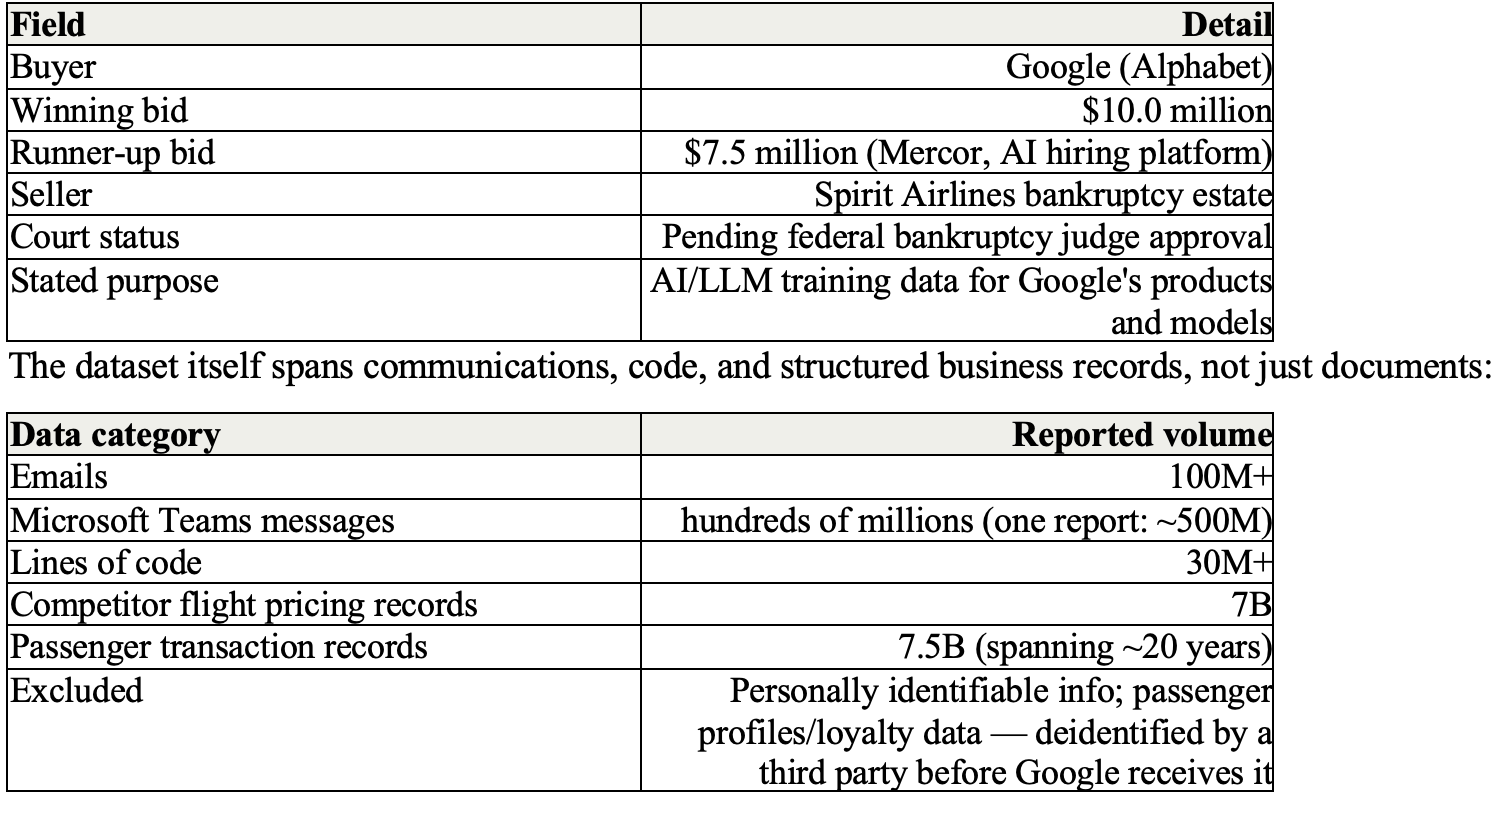
Google won a bankruptcy auction for Spirit Airlines' internal business data at $10 million, edging out a $7.5 million bid from AI hiring platform Mercor. The dataset — over 100 million emails, hundreds of millions of Teams messages, 30M+ lines of code, and 7.5 billion passenger transaction records spanning two decades — is intended as AI/LLM training material. Against Alphabet's $4.201 trillion market cap the deal is financially invisible; its real significance is as a data point in AI labs' growing appetite for large, non-public operational datasets sourced from distressed companies, not as a market-moving transaction.
Will Gemini launch next 'Pro' version in 3Q2026?
YesResult
30.41%
NoResult
69.59%
171 Polls
EndedTBD
What happened?
Spirit Airlines ceased operations in 2026 after failing to emerge from its second Chapter 11 bankruptcy, reportedly driven in part by rising fuel costs tied to Iran-related geopolitical tensions. As part of the bankruptcy estate's asset disposition, Google's $10 million bid beat Mercor's $7.5 million offer for a large internal-data package. A federal bankruptcy judge still needs to approve the sale before it closes.
Significance of the event
Financial Scale: financially trivial — $10 million against Alphabet's $4.201 trillion market cap is roughly 0.00024% of market value, and a rounding error against Alphabet's ad/cloud revenue run-rate.
Novelty? it isn't novel that AI labs buy training data, but the source and composition are notable — a large, structured, non-public operational dataset (proprietary code, two decades of transaction records, competitor pricing intelligence) rather than scraped public web text. This reflects the broader, well-documented AI-industry scramble for data as public-web text supply is increasingly exhausted relative to frontier model appetite.
Narrative: reinforces, rather than complicates, the existing "AI data scarcity" narrative — labs increasingly sourcing proprietary, structured corpora (code, internal operations, transaction history) as a complement to public text.
Does it actually help Google's model training?
Directionally - YES but it matters to separate what kind of help:
Genuine incremental value: this dataset (emails, code, two decades of transaction records, competitor pricing intelligence) is structured, real operational business data — different in kind from scraped public web text. In principle it could help a model perform better on enterprise-workflow, code-understanding, and business-analysis tasks. That's a real, if narrow, training-data-diversity benefit.
But it's not the lever that actually determines model competitiveness right now: look at where Alphabet is actually putting its money — the $195-205B capex is almost entirely data centers, custom silicon (TPUs), and compute, not data acquisition. Frontier model capability today is overwhelmingly driven by compute scale. A $10M dataset purchase is a marginal, nice-to-have addition inside that system, not something that changes Google's competitive position on model quality.
What to watch out?
Gemini execution risk? Whether the next Gemini release lands on a credible timeline or slips again — the stock's ~9% drawdown from its April high has already been tied to "Gemini delays," not to any data deal, so further slippage (or another high-profile departure beyond the ones already reported) is the more direct read on execution risk than anything in this transaction.
Regulatory/antitrust track, not just this deal's own approval. Watch for rulings, discovery timelines, or settlement terms on either, since those carry far more financial/reputational weight than a $10M bankruptcy auction.
Actual capex spend vs. guidance, and how it's financed. Alphabet has already revised 2026 capex guidance upward twice (most recently to $195-205B) — watch whether the next quarterly print shows real spend tracking that number or running ahead of it. Separately, watch the financing side specifically: beyond the $22.93B bond and $18B equity offering already completed, check for additional debt/equity raises, and — more importantly — for off-balance-sheet structures. That's the harder-to-see leverage that matters more than the headline guidance number, and it's where hyperscalers in this cycle have shown a pattern of getting creative.
Hapag-Lloyd’s H1 2026 results were mixed. The company returned to profit in Q2 as stronger demand and spot freight rates lifted transport volumes and average pricing, producing a clear recovery from a loss-making Q1.
Will Hapag-Lloyd transport more than 3.5mn TEU in Q3 2026? (3.481mn TEU in Q2 2026, up 3.5% yoy)
YesResult
47.46%
NoResult
52.54%
236 Polls
EndedTBD
Q2 revenue rose 10.8% yoy to $5.84bn, while EBITDA increased 1.1% to $829mn and EBIT declined 6.9% to $176mn. Net profit fell 72.9% to $83mn. The sequential improvement was much stronger: revenue rose 19% qoq, EBITDA increased 68%, and EBIT swung from a $157mn loss. However, the weak first quarter and substantial disruption costs left H1 EBITDA down 31.2% and EBIT at only $18mn. Hapag-Lloyd raised its FY2026 outlook following the Q2 recovery, but the wide range continues to reflect considerable uncertainty around freight rates, energy costs and the Middle East conflict.
Q2 2026 Group Key Figures
Liner Shipping
Transport Volume
3.5 M TEU
PY: 3.4 M TEU
Terminal & Infrastructure
Throughput
3.6 M TEU
PY: 3.3 M TEU
Revenue
USD 5.8 bn
PY: USD 5.3 bn
EBITDA
USD 0.8 bn
PY: USD 0.8 bn
EBIT
USD 0.2 bn
PY: USD 0.2 bn
Group Profit
USD 0.1 bn
PY: USD 0.3 bn
Free Cash Flow
USD 0.6 bn
PY: USD 0.2 bn
Net Debt
USD 2.0 bn
PY: USD 1.2 bn
Key Takeaways
Ocean was the main earnings driver, supported by both pricing and execution.Q2 marked a clear turnaround from a loss-making Q1. The most important development was not the modest yoy change in EBITDA, but the scale of the sequential recovery. Q2 revenue reached $5.84bn versus $4.92bn in Q1, while EBITDA rose to $829mn from $494mn. EBIT improved to $176mn from a $157mn loss, and the net result swung to an $83mn profit from a $256mn loss.
This shows that Hapag-Lloyd retained significant operating leverage when freight markets improved. Nevertheless, Q2 EBIT remained below the prior-year period even with substantially higher revenue, indicating that the rebound in commercial conditions did not fully reach the bottom line.
Revenue
[USD m]
+19%
5,272
4,918
5,840
Q2 2025
Q1 2026
Q2 2026
EBITDA
[USD m]
15.6%
10.0%
14.2%
+68%
820
494
829
Q2 2025
Q1 2026
Q2 2026
EBIT1[USD m]
3.6%
-3.2%
3.0%
189
-157
176
Q2 2025
Q1 2026
Q2 2026
Group Profit1[USD m]
3.3%
-3.2%
2.7%
306
-256
83
Q2 2025
Q1 2026
Q2 2026
Recovery of Hapag-Lloyd earnings in Q2 due to improved market conditions in the Liner Shipping business. Source: Hapag-Lloyd
Higher volumes and freight rates drove the recovery, but H1 pricing remained broadly flat. Q2 transport volume increased 3.5% yoy to 3.481mn TEU, while the average freight rate rose 8.9% to $1,475/TEU. Management attributed the improvement mainly to strong exports from Asia and better US demand.
The Gemini network also remained resilient, with schedule reliability returning to ~90% after disruption. The first-half picture was less pronounced: volume rose 1.5% to 6.684mn TEU and the average freight rate declined 0.4% to $1,406/TEU.
Network schedule reliability
Gemini Cooperation
Competitor Range
100%
90%
80%
70%
60%
50%
Feb- 25
Mar- 25
Apr- 25
May- 25
Jun- 25
Jul- 25
Aug- 25
Sep- 25
Oct- 25
Nov- 25
Dec- 25
Jan- 26
Feb- 26
Mar- 26
Apr- 26
May- 26
Jun- 26
Gemini reliability back at 90%. Source: SeaIntel
H1 revenue increased 1.6% in US dollars, although it fell 4.8% in euros because of currency translation. Q2 therefore represented a meaningful market improvement, but one quarter of stronger spot pricing does not yet establish a sustained change in the annual rate environment.
Middle East disruption absorbed much of the commercial improvement. The conflict generated ~ $600mn of additional cash costs, including ~ $400mn realized in Q2 and ~ $200mn associated with bunker inventory build-up.
Alternative routings, elevated fuel prices, storage expenses and higher hinterland transportation costs all contributed. H1 transport and terminal expenses increased 8.6% to $8.41bn, despite only 1.5% volume growth.
Raised guidance reflects stronger H2 conditions, while the range remains wide. On July 13, Hapag-Lloyd raised FY2026 EBITDA guidance to $2.7-3.7bn from $1.1-3.1bn and EBIT guidance to $0.1-1.1bn from -$1.5bn to $0.5bn.
The revision reflects the recent increase in spot freight rates and resilient demand, partly offset by energy costs and continuing operational disruption. Cash generation was materially stronger than net income, partly because depreciation is significant in this asset-heavy model and some Middle East-related cash outlays were reflected in bunker inventory. The wide $1bn guidance ranges show that management visibility remains limited.
The proposed $4.2bn acquisition of ZIM is an additional strategic variable: ZIM shareholders have approved the transaction, but regulatory approvals remain outstanding, and Hapag-Lloyd’s guidance excludes any consolidation effects.
Timeline
16 February
Signing
30 April
ZIM Extraordinary
General Meeting
Golden
Share approval
Discussions with relevant
stakeholders and key decision
makers ongoing
Antitrust clearance
All filings submitted, first approvals received
end of 2026
C
Closing
Merger agreement approved by ZIM shareholders; regulatory approvals are still pending amid mounting obstacles. Source: Hapag-Lloyd
Key Debates
Can the Q2 freight-rate recovery persist into Q4 2026?
How much of the ~$600mn Middle East cost impact will prove temporary?
Can cost savings restore Liner Shipping margins if freight rates normalize?
Will Terminal & Infrastructure become large enough to reduce group earnings volatility?
Maersk delivered a strong Q2 2026, as higher Ocean freight rates, volume growth and lower unit costs drove a sharp recovery in earnings. Revenue rose 20.0% yoy to $15.76bn, while reported EBITDA increased 30.2% to $2.99bn. Reported EBIT climbed 85.9% to $1.57bn, taking the EBIT margin to 10.0%, and net profit more than doubled to $1.31bn.
USD
P&L
Revenue
15.8bn
(13.1bn)
EBITDA
3.0bn
(2.3bn)
EBIT
1.6bn
(0.8bn)
Profit for period
1.3bn
(0.6bn)
Cash and returns
FCF
0.5bn
(-0.4bn)
Cash and deposits
18.5bn
(19.9bn)
NIBD
-1.5bn
(-2.5bn)
ROIC
(LTM)
5.0%
(13.7%)
Note: Prior corresponding period figures in brackets. Source: Maersk
The most important incremental information was another substantial increase in Maersk’s FY2026 guidance, just weeks after the company upgraded its outlook in late June. The new guidance suggests that management expects the stronger rate environment and operating performance to remain supportive through H2, although the durability of current freight rates remains the central debate.
Will Maersk’s average Ocean freight rate remain above $2,700/FFE in Q3 2026? (Q2 2026 Avg: $2,746/FFE)
YesResult
61.64%
NoResult
38.36%
232 Polls
EndedTBD
Key Takeaways
Ocean was the main earnings driver, supported by both pricing and execution. Ocean revenue reached $10.53bn, with EBITDA of $2.04bn and EBIT of $940mn. Loaded volumes increased 4.1% yoy to 3.36mn FFE, while the average freight rate rose 21.6% to $2,746/FFE. At the same time, unit costs declined 2.2% to $2,355/FFE. The combination of higher rates, growing volumes and lower costs produced significant operating leverage.
Q2 represented a clear acceleration from a weak start to the year. H1 revenue increased 8.6% yoy to $28.73bn, but EBITDA declined 5.3% to $4.74bn and EBIT fell 8.9% to $1.91bn. Net profit decreased 23.5% to $1.41bn. The contrast between the strong Q2 performance and declining H1 earnings shows how quickly Maersk’s profitability improved as freight rates recovered.
Logistics continued to improve, although margins remain modest. Logistics revenue reached $4.22bn, with EBITDA of $470mn and EBIT of $220mn. The EBIT margin increased 50bps qoq to 5.1%, supported by Landside services, air freight, project logistics and a better contract mix. Further margin expansion would reduce the group’s reliance on volatile Ocean earnings.
Terminals remained a stable source of profit. Revenue reached $1.45bn, EBITDA was $520mn and EBIT was $460mn, while volumes grew 2.2% yoy. The strong profitability on relatively modest volume growth highlights the segment’s role as a more predictable earnings contributor.
Guidance was raised by an unusually wide margin. Maersk now expects FY2026 underlying EBITDA of $10.5–12.5bn, up from $8–10bn, and underlying EBIT of $4.5–6.5bn, up from $2–4bn. The midpoint of both ranges increased by $2.5bn. Free-cash-flow guidance improved to above zero from at least negative $1.5bn. As the global container-market growth assumption remained unchanged at ~4%, the upgrade appears to reflect stronger rates, business mix and execution rather than a higher industry volume forecast.
Key Debates
Can elevated Ocean rates persist beyond the peak shipping season?
How much demand was brought forward?
Can free cash flow remain positive despite heavy investment?
Coherent delivered a broad Q4 FY2026 beat, with revenue, margins and earnings all improving. The more important update was management’s roadmap for another leg of AI-related growth: InP capacity is expanding rapidly, while CPO, PhotonLink, Multi-Rail and thermal-management products are expected to begin contributing over the next several quarters. The shares nevertheless fell after hours as strong execution met an already elevated expectations bar.
Will Coherent’s non-GAAP gross margin > 42% in FY2027 Q1?
YesResult
59.56%
NoResult
40.44%
225 Polls
EndedTBD
Key Takeaways
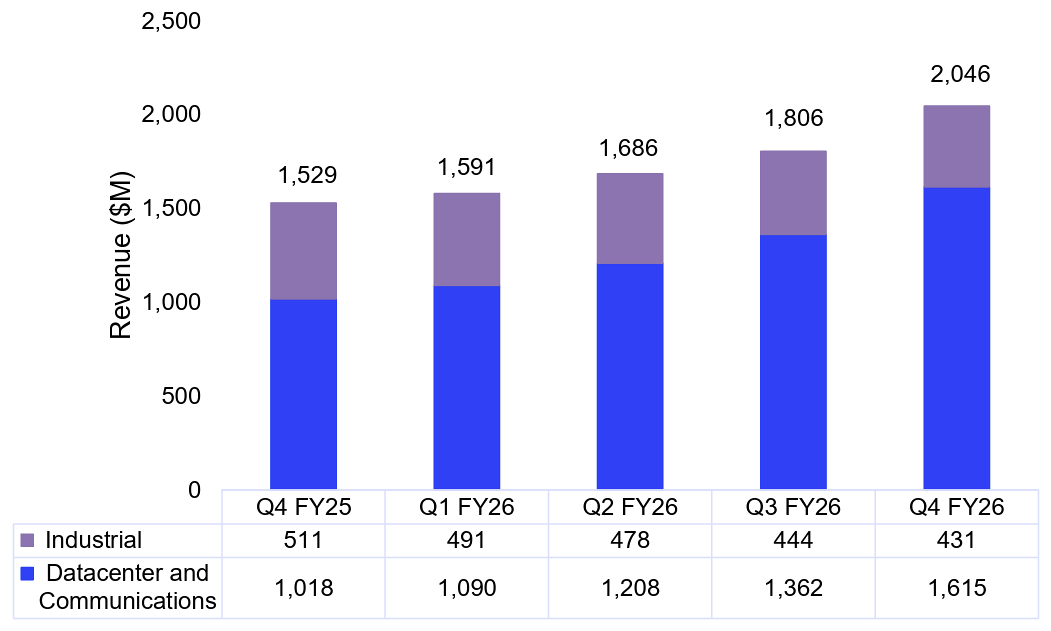
· Results and guidance were stronger than expected. Q4 revenue reached $2.05bn, up 34% yoy and 13% qoq, while non-GAAP EPS rose 74% yoy to $1.74. Non-GAAP gross margin increased 215bps yoy to 40.2%, and operating margin reached 21.8%. Q1 FY2027 guidance calls for revenue of $2.2bn–$2.4bn and non-GAAP EPS of $1.85–$2.05, both above the consensus figures cited in the supplied market review.
· AI optical connectivity is driving an increasingly concentrated growth profile. Data Center & Communications revenue rose 59% yoy to $1.62bn and represented 79% of sales. Industrial revenue fell 16% on a reported basis to $431m. The quarterly trend shows that all net revenue growth over the past year came from the data-center and communications segment, increasing Coherent’s exposure to AI infrastructure spending and execution at major customers.
Quarterly revenue by segment ($m). Source: Coherent investor presentation
· InP capacity is still the central constraint. Internal InP output doubled yoy in Q4, while 6-inch laser output rose ~80%. Management expects internal InP capacity to double by calendar year-end and more than double again by end-2027. The 6-inch line produces CW lasers, EMLs and photodiodes, with management citing better yields and economics than 3-inch production. Backlog extends through FY2027, customer forecasts reach 2028, and many LTAs run three to ten years with pricing and minimum-volume provisions.
· Several new platforms now have specific revenue windows. CPO-related revenue and the PhotonLink integrated optical platform are expected to start increasing in Q2 FY2027. Multi-Rail should begin contributing in the first half, while Thermadite thermal-management revenue is expected in the second half. OCS revenue is already growing, and management raised its estimated 2030 addressable market to more than $4bn. These remain management timelines rather than realized sales.
Source: Coherent investor presentation
· Earnings growth was strong, but cash conversion weakened. FY2026 non-GAAP EPS increased 59% as gross margin and operating leverage improved. However, operating cash flow fell to $80m from $634m, reflecting the working-capital and investment demands of the capacity build. Coherent ended the year with about $2.0bn of cash and short-term investments, while long-term debt declined to $3.21bn, limiting immediate liquidity concerns.
Market Reaction
Coherent rose ~2.8% in regular trading before the release, then fell ~3.5% initially and more than 6% at one point after hours, according to the supplied market review. Lumentum had rallied about 8% after its own stronger-than-expected report one day earlier, creating a demanding peer benchmark.
Coherent had also gained more than 200% over the prior 12 months and traded at roughly 42x forward earnings versus an industry average near 22x in that review. The decline therefore may reflect relative surprise, valuation and the modest near-term margin step-up rather than weaker reported demand.
Key Debates
· Can non-GAAP gross margin exceed 42% by Q4 FY2027?
· Will CPO and PhotonLink generate meaningful revenue in Q2 FY2027?
· Can inventory and capacity investment translate into stronger operating cash flow?
· Will Industrial return to yoy growth within the next two quarters?
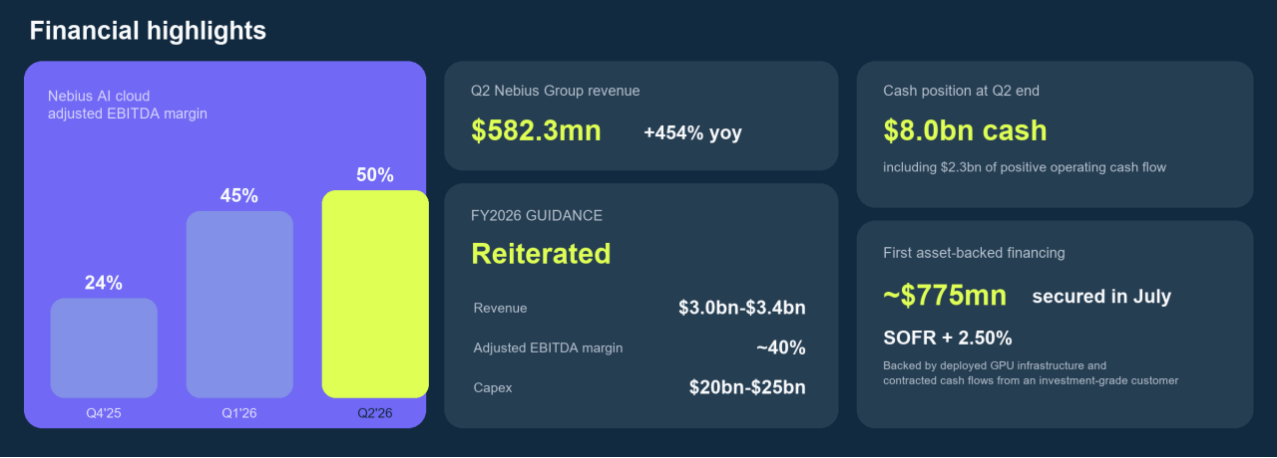
Nebius delivered a clear Q2 beat: revenue reached $582.3mn, up 454% yoy and 46% qoq, versus roughly $510mn-$534mn expected. Nebius AI contributed $574.9mn, while group adjusted EBITDA reached $236.2mn and operating loss narrowed to $175.9mn.
Management said every capacity tranche brought online can be sold, making deployment speed the near-term constraint. The shares rose more than 16% pre-market as the results combined a revenue beat, better profitability and confidence in the 2026 outlook.
Source: Nebius Q2 FY2026 earnings release. Adjusted EBITDA is non-GAAP.
Will Nebius AI Cloud maintain an adjusted EBITDA margin of at least 50% in Q3 FY2026?
YesResult
58.68%
NoResult
41.32%
167 Polls
EndedTBD
Key Takeaways
Financial growth is exceptional, but cluster profitability is not yet corporate profitability. Nebius AI supplied $574.9mn, or 98.7% of group revenue, and its June revenue annualized to $3.0bn, 58% above March. AI adjusted EBITDA margin rose to 49.7% from 45% in Q1 and 24% in Q4 2025 as cost of revenue and SG&A fell sharply as a percentage of sales.
That validates operating leverage in commissioned clusters. It does not yet establish full corporate profitability: the group still reported a $175.9mn GAAP operating loss and a $190.4mn net loss from continuing operations after depreciation, share-based compensation and financing costs.
Three transaction models form the commercial core.
Nebius is managing capacity as a portfolio rather than selling every future MW under one contract type:
3-6 month contracts and auctions monetize urgent, time-sensitive demand at a premium. The first Blackwell auction cleared 15% above the company's previous peak and 20% above standard Blackwell pricing.
1-3 year mid-term contracts remain the core model for leading AI companies. Four Q2 flagship deals averaged more than $1bn of total contract value, with annual contract value of $20mn-$25mn per MW.
Long-term agreements with investment-grade customers trade some pricing optionality for visibility and financing capacity; one contract supported the $775mn asset-backed facility priced at SOFR + 2.50%.
Why it matters: The mix balances utilization, pricing and funding. Reserving capacity for short-duration demand can raise revenue per MW, but also increases renewal and idle-capacity risk.
Related read: Nebius is not the only AI cloud provider facing the scale-to-returns test. This CoreWeave deep dive examines operating leverage, financing costs and the lifetime economics of older GPUs.
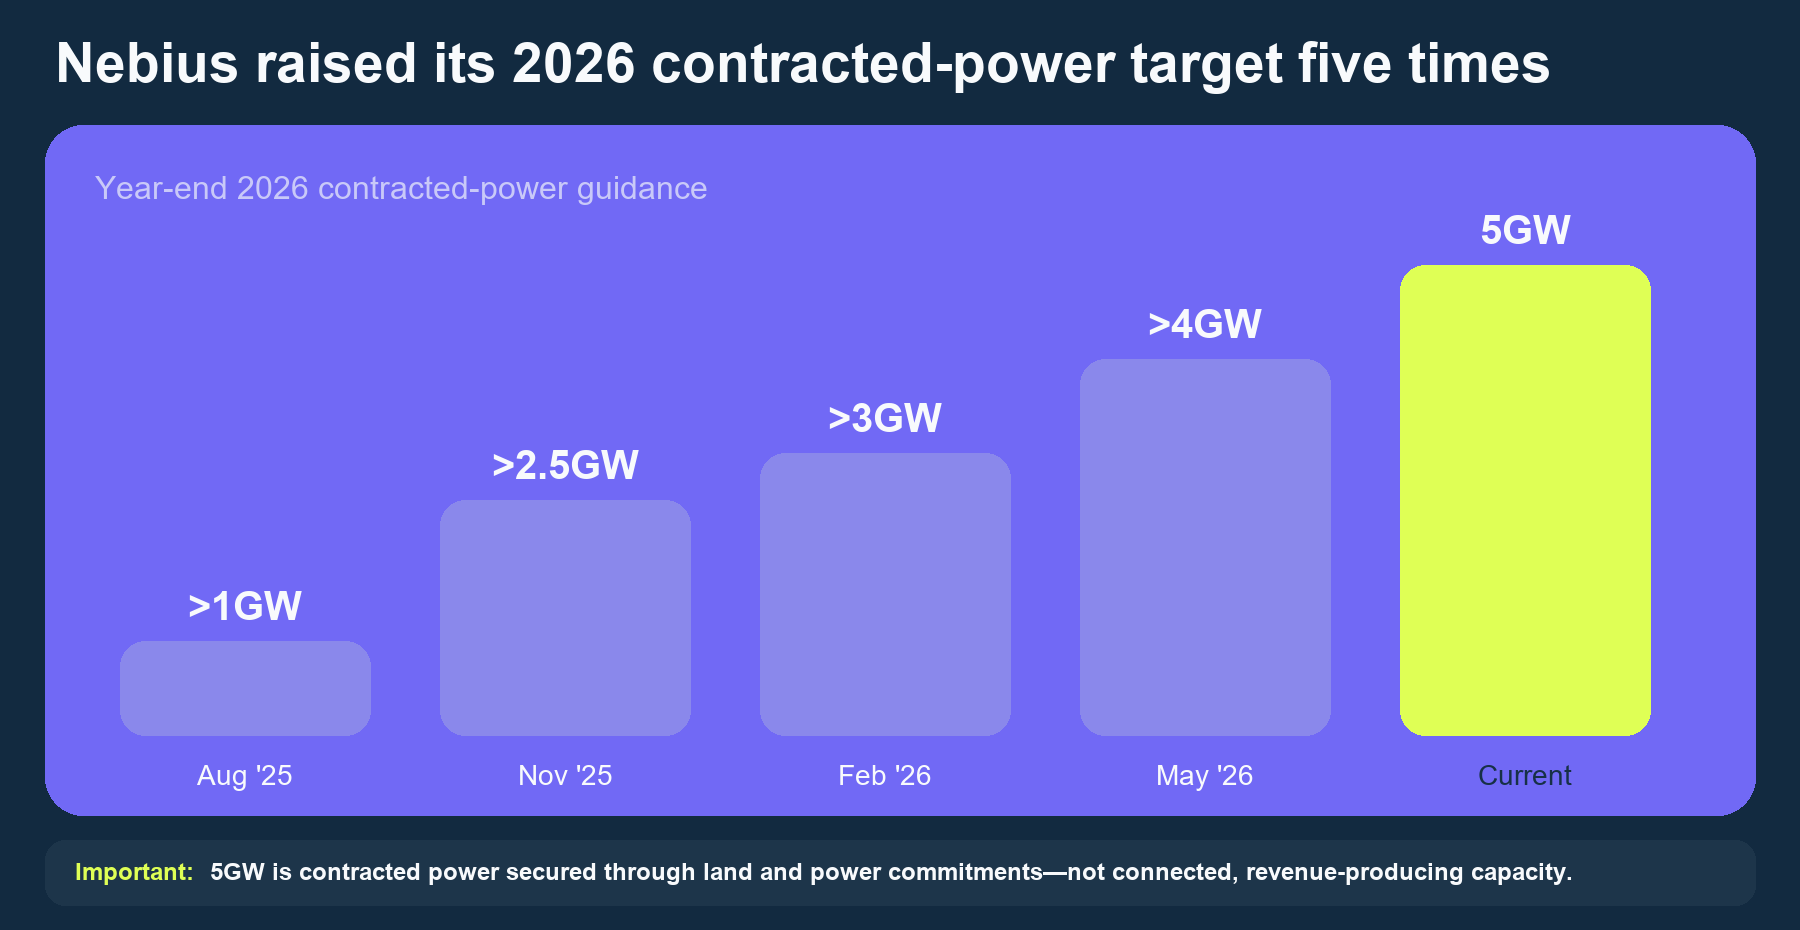
Power access is both the bottleneck and a potential competitive asset. Nebius raised its year-end contracted-power target to 5GW from just over 1GW a year earlier, but connected-power guidance remains 0.8GW-1.0GW - only 16%-20% of the contracted figure.
Source: Nebius
The gap is analytically important: contracted land and power secure a future pipeline, while revenue requires energized sites, delivered GPUs and networks, tested clusters and customer acceptance. Behind-the-meter generation and geographic flexibility may reduce dependence on individual grids, but the key KPI is how quickly and economically signed power becomes billable capacity.
Capital innovation improves funding efficiency, but not the underlying capital intensity. In July, Nebius secured its first ~$775mn asset-backed financing at SOFR plus 2.50%, backed by deployed GPUs and contracted cash flows from an investment-grade customer. Together with prepayments covering an estimated 50%–60% of related capex and its asset-light partnership model, this creates a potentially repeatable funding framework that reduces reliance on corporate cash and equity. However, Q2 capex of ~$5.7bn—almost 10 times quarterly revenue—shows that returns still depend on utilization, financing costs, depreciation and GPU residual value.
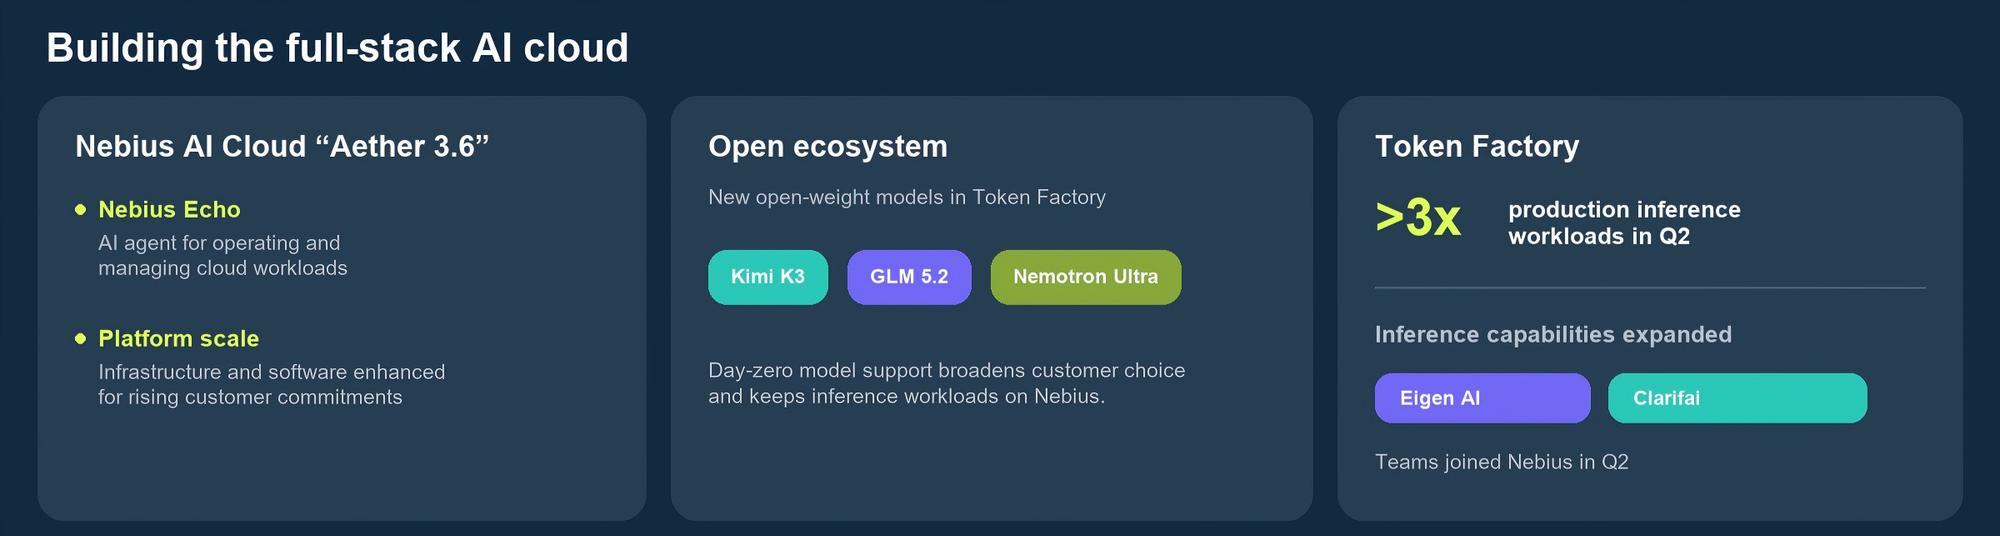
The open ecosystem and Token Factory raise the potential revenue density of the platform. Token Factory inference workloads more than tripled in Q2 as Nebius expanded day-zero support for open-weight models, while the platform added open-weight models including Kimi K3, GLM 5.2 and Nemotron Ultra.
Source: Nebius Q2 FY2026 shareholder letter
The integration of Eigen AI and Clarifai adds inference-optimization capabilities, while Aether 3.6 and Nebius Echo broaden workload management as customer volumes scale. These developments may increase platform usage, compute utilization and revenue per unit of infrastructure.
Market Reaction
Nebius shares rose more than 16% pre-market as Q2 results improved both the scale and quality of its growth outlook.
Revenue beat expectations, while Nebius AI delivered an adjusted EBITDA margin of about 50%, suggesting new capacity is translating into strong operating leverage. Forward visibility also improved after the company signed four major AI cloud contracts with average total contract value above $1bn and annual contract value of $20mn–$25mn per MW.
Pricing remained strong: Nebius’s first Blackwell auction cleared 15% above its previous peak price and 20% above standard pricing, supporting the value of keeping some capacity available for short-duration demand.
Financing concerns also eased after a ~$775mn asset-backed facility priced at SOFR +2.50%, alongside customer prepayments, expanded funding options beyond cash and equity.
Overall, the rally reflected stronger revenue, margins, pricing and financing flexibility, though depreciation, interest costs, dilution and future GPU capex remain key risks.
Key Debates
Can commissioned capacity keep selling at current prices?
Can 5GW of contracted power become connected capacity on schedule?
Do the three transaction models produce comparable lifetime returns?
Does financing innovation improve returns or mainly accelerate deployment?
When will Token Factory become financially measurable?
Taiwan’s latest disclosures point to sustained demand across three layers of the AI infrastructure stack: TSMC’s and UMC’s July 2026 revenue updates, and Hon Hai’s second-quarter operating results.
Together, the companies span distinct segments of Taiwan’s technology supply chain — advanced semiconductor manufacturing, mature and specialty foundry services, and AI server-system production. While all three are benefiting from the broader AI infrastructure buildout, the underlying growth drivers and the implications for margins differ significantly across companies.
Company
Latest revenue
MoM
YoY
AI supply-chain role
TSMC
US$14.61bn (Jul)
+5.6%
+44.7%
Advanced nodes / AI chips
UMC
US$745.1mn (Jul)
+3.1%
+19.0%
Mature and peripheral chips
Hon Hai
US$29.58bn (Jul)
+15.18%
+54.19%
AI servers and rack systems
TSMC: advanced manufacturing remains the primary growth engine
TSMC reported July revenue of approximately US$14.61bn, up 5.6% MoM and 44.7% YoY. Revenue for the first seven months reached approximately US$89.75bn, an increase of 37.0% YoY.
July was about 9% above the Q2 monthly average, indicating that third-quarter growth was not dependent solely on a late-quarter shipment increase. Leading-edge nodes used in AI accelerators and high-performance computing, together with advanced packaging, remained the main drivers.
In Q2, 7nm and more advanced processes represented 77% of wafer revenue, including 30% from 3nm and an initial 3% from 2nm. Management expects a steep 2nm ramp during Q3 and guided to quarterly revenue of US$44.6-45.8 billion. AI accelerators, custom processors and high-performance computing are supporting demand for both leading-edge wafers and advanced packaging.
Will TSMC's Aug 2026 revenue exceed that of July?
YesResult
0.00%
NoResult
0.00%
0 Polls
EndedTBD
UMC: mature-node utilization and product mix continue to improve
UMC reported July revenue of approximately US$745.1mn, up 3.1% MoM and 19.0% YoY. Seven-month revenue was approximately US$4.80bn, representing 12.4% YoY growth.
The improvement is not equivalent to TSMC's direct exposure to advanced AI processors. UMC supplies connectivity, display, power-management, consumer and networking applications. Q2 utilization rose to 85% from 79%, while 22/28nm increased to 37% of revenue and gross margin reached 32.5%.
July's performance is therefore consistent with higher utilization, a better product mix and more stable pricing, with AI infrastructure providing an indirect rather than exclusive demand channel.
Hon Hai: Q2 results underscore growth in AI server systems
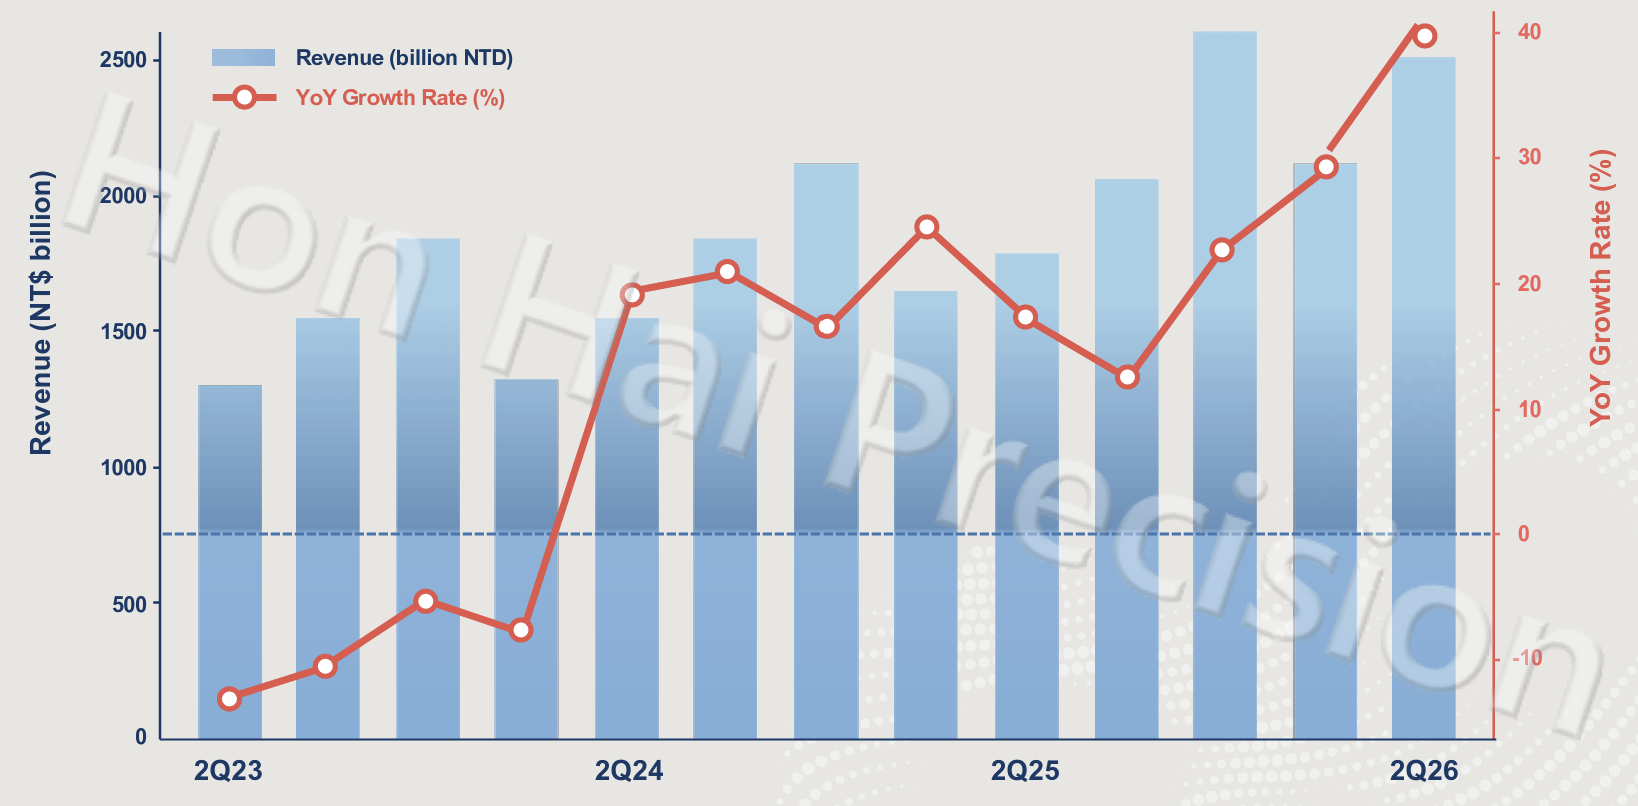
Hon Hai reported July revenue of approximately US$29.58bn, up 15.18% MoM and 54.19% YoY. The sharp sequential rise shows momentum continuing after an already strong Q2, when revenue reached approximately US$78.54bn, increasing 18.0% QoQ and 39.8% YoY.
AI infrastructure is driving revenue growth. Source: Hon Hai
The figures show AI demand reaching the system-production layer as Hon Hai expands from server assembly into integrated racks incorporating computing, networking, cooling, power and interconnect systems. Traditional second-half ICT seasonality also supported the July acceleration.
Will Hon Hai’s August revenue exceed July’s US$29.58bn?
YesResult
50.00%
NoResult
50.00%
2 Polls
EndedTBD
Cloud and networking products were the main growth driver, supported by AI servers and rack-scale systems. Company disclosures indicated that the segment accounted for close to half of group revenue, while industry research pointed to higher shipments of GPU-based racks and custom-ASIC systems for large cloud customers. Hon Hai is also extending its participation into networking, power, cooling and rack integration.
Revenue growth should nevertheless be considered separately from profitability. High-value accelerators can increase reported server revenue substantially, while component-procurement and consignment arrangements affect both revenue recognition and margins. Gross profit, operating margin and the mix between GPU and custom-ASIC programmes therefore remain important indicators of earnings conversion.
Operating read-through: the same AI cycle, different economics
The data support a three-layer transmission of AI capital expenditure through Taiwan: advanced chips at TSMC, peripheral and mature-node content at UMC, and server-system integration at Hon Hai.
The strongest combination of growth and profit conversion is currently at the advanced-chip layer. UMC provides evidence that demand is broadening but remains more exposed to the conventional semiconductor cycle. Hon Hai demonstrates the scale of AI deployment, while the central question is whether exceptional revenue growth produces durable margin and cash-flow improvement.
CoreWeave's Q2 was less about another quarter of exceptional AI demand than about the first credible signs that demand is converting into operating leverage. Revenue rose 112% yoy to $2.575bn, near the top of guidance and slightly above the ~$2.56bn consensus, while adjusted operating income of $128mn exceeded management's $30mn-$90mn range and lifted margin to 5% from 1% in Q1.
Will CoreWeave report >7% adjusted operating margin in 3Q2026?
YesResult
0.00%
NoResult
0.00%
0 Polls
EndedTBD
The inflection matters because it arrived before a roughly 25% July price increase cited on the call. But it is not yet proof of attractive corporate economics: adjusted operating margin remained far below 16% a year earlier, net loss was $626mn and quarterly capex reached $9.35bn.
The central question is no longer whether CoreWeave can sell scarce AI capacity; it is whether each new cluster can earn enough over its life to outrun depreciation, interest and technological obsolescence.
TL;DR: Key takeaways
The quarter strengthens the operating-leverage case, but does not complete it. Adjusted operating income rose by $107mn qoq on $497mn of incremental revenue, suggesting that already-built infrastructure is absorbing fixed costs more effectively as utilization increases. Q3 adjusted operating-income guide of $200mn-$260mn and low-double-digit Q4 margin target imply that this conversion should accelerate.
The caveat is the yoy comparison: adjusted operating income fell 36% and adjusted EBITDA margin slipped to 59% from 62%, reflecting depreciation and commissioning costs from the buildout. CoreWeave has shown a sequential turn, not yet a normalized margin.
Pricing and product mix provide a plausible route to the Q4 target.
Management said new contracts carry contribution margins 5-10 percentage points above those signed in recent quarters, reflecting pricing, newer systems and more storage, CPU, networking and software content.
Managed inference ARR increased from about $1mn at launch to more than $100mn, with at least $250mn targeted by year-end; non-GPU ARR exceeded $400mn.
These services can broaden the customer funnel and raise revenue per cluster, but remain small beside the core infrastructure business and are management-reported operating indicators rather than GAAP revenue categories.
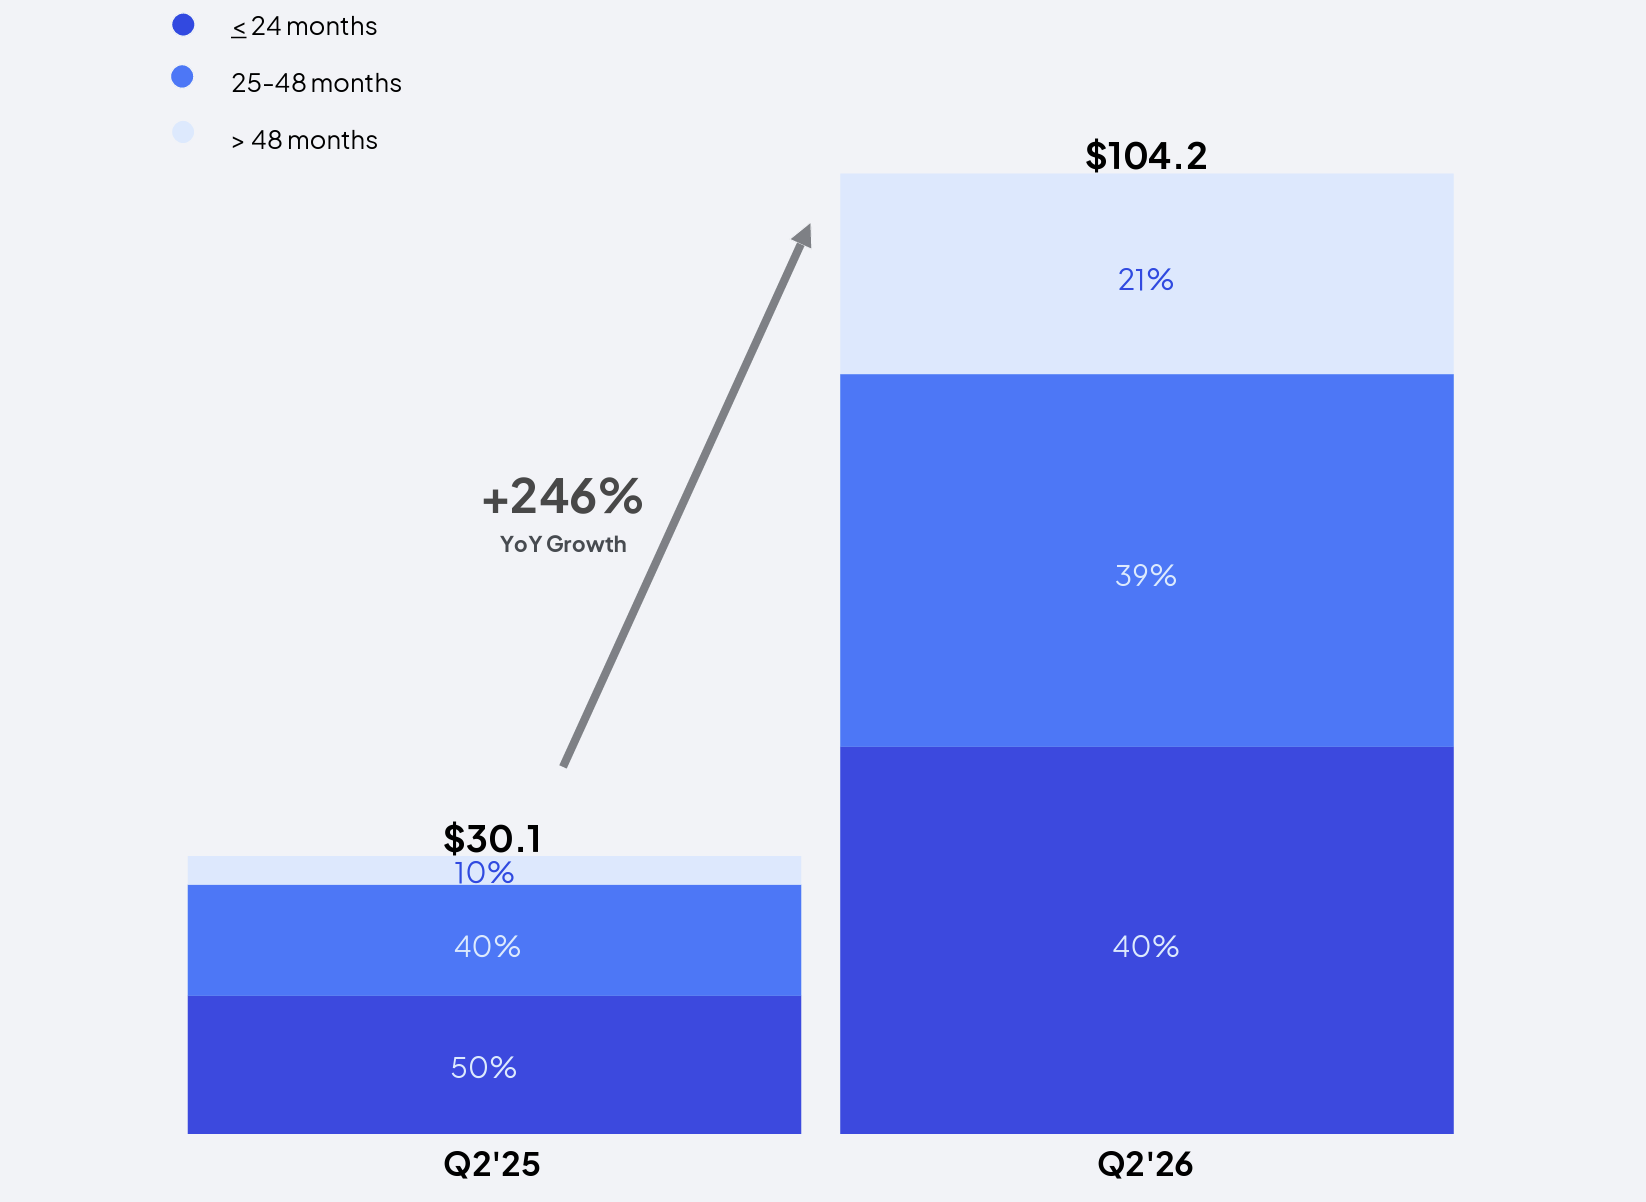
Backlog is becoming an execution schedule rather than a demand indicator. The $104.2bn balance was up 246% yoy and was followed by more than $25bn of early-Q3 commitments, leaving little doubt about customer appetite. What matters now is conversion: 40% is expected within 24 months, and recognition depends on delivery and service availability.
CoreWeave's 1.5 GW of active power and 4.2 GW contracted after quarter-end support future scale, but also expose the model to permitting, construction and supply-chain timing. Backlog has value only when powered capacity reaches customers at the underwritten return.
Q2 FY2026 Revenue Backlog. Source: CoreWeave
The A100 renewal is the call's most important evidence - and its easiest point to overstate. A customer extended use of the 2020-era GPU through 2029 at what management called attractive pricing. If the initial contract has repaid the associated debt, a second term could materially raise lifetime returns without another GPU purchase.
That suggests obsolescence may be slower than feared during a supply-constrained cycle. It does not make old hardware costless or appreciating: power, space and maintenance remain, and one renewal cannot establish fleet-wide residual value.
Financing innovation widens the market, while increasing the importance of discipline. Management said DDTL 5.5 can finance shorter-duration contracts preferred by enterprises, potentially opening a 2-3 year market that previously did not fit five-year asset-backed structures. Shorter contracts may command higher pricing, but leave more renewal risk. With FY2026 capex raised to $35bn-$39bn and interest expense already $640mn in Q2, cheaper or more flexible debt helps only if contract-level returns remain above the cost of capital.
Source: CoreWeave
Key debates
Will $104.2bn of backlog convert on schedule and at attractive returns?
Is the A100 renewal representative of the wider fleet?
Can financing costs fall faster than the asset base expands?
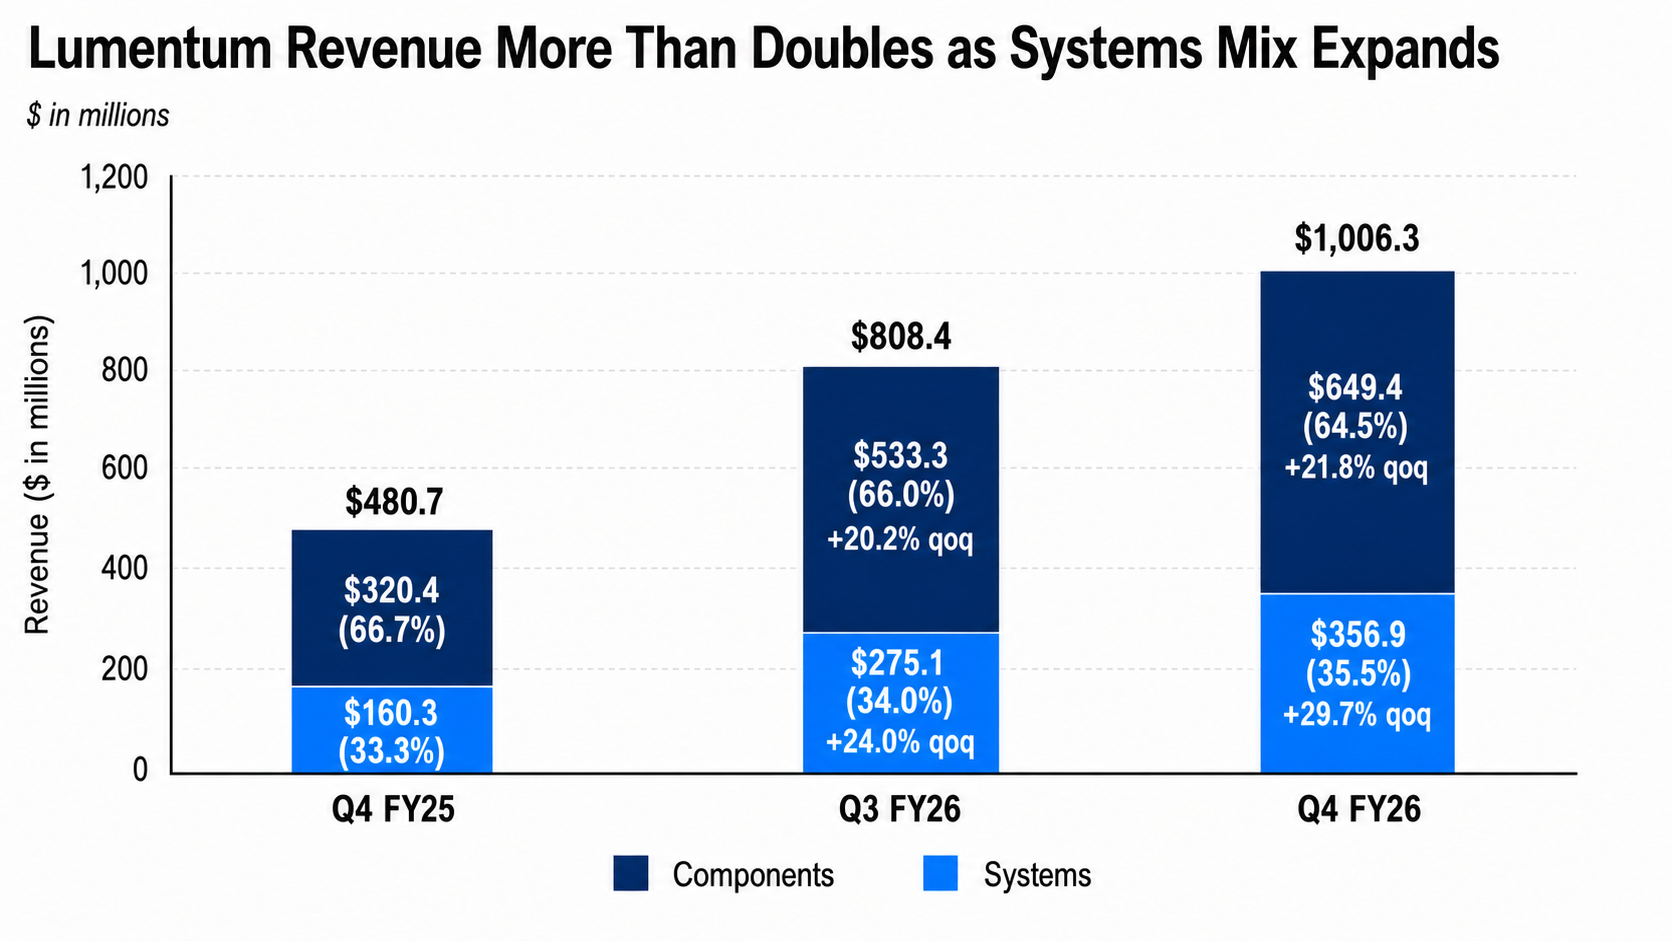
Lumentum delivered a broad Q4 FY2026 beat and issued Q1 guidance substantially above expectations, as AI-driven data-center demand lifted both optical components and systems revenue. Q4 revenue rose 109% yoy and 25% qoq to $1.01bn, ahead of consensus of ~$985mn, while non-GAAP EPS of $3.23 exceeded the $2.95 estimate.
Will Lumentum achieve Q1 FY2027 revenue above $1.25bn?
YesResult
0.00%
NoResult
0.00%
0 Polls
EndedTBD
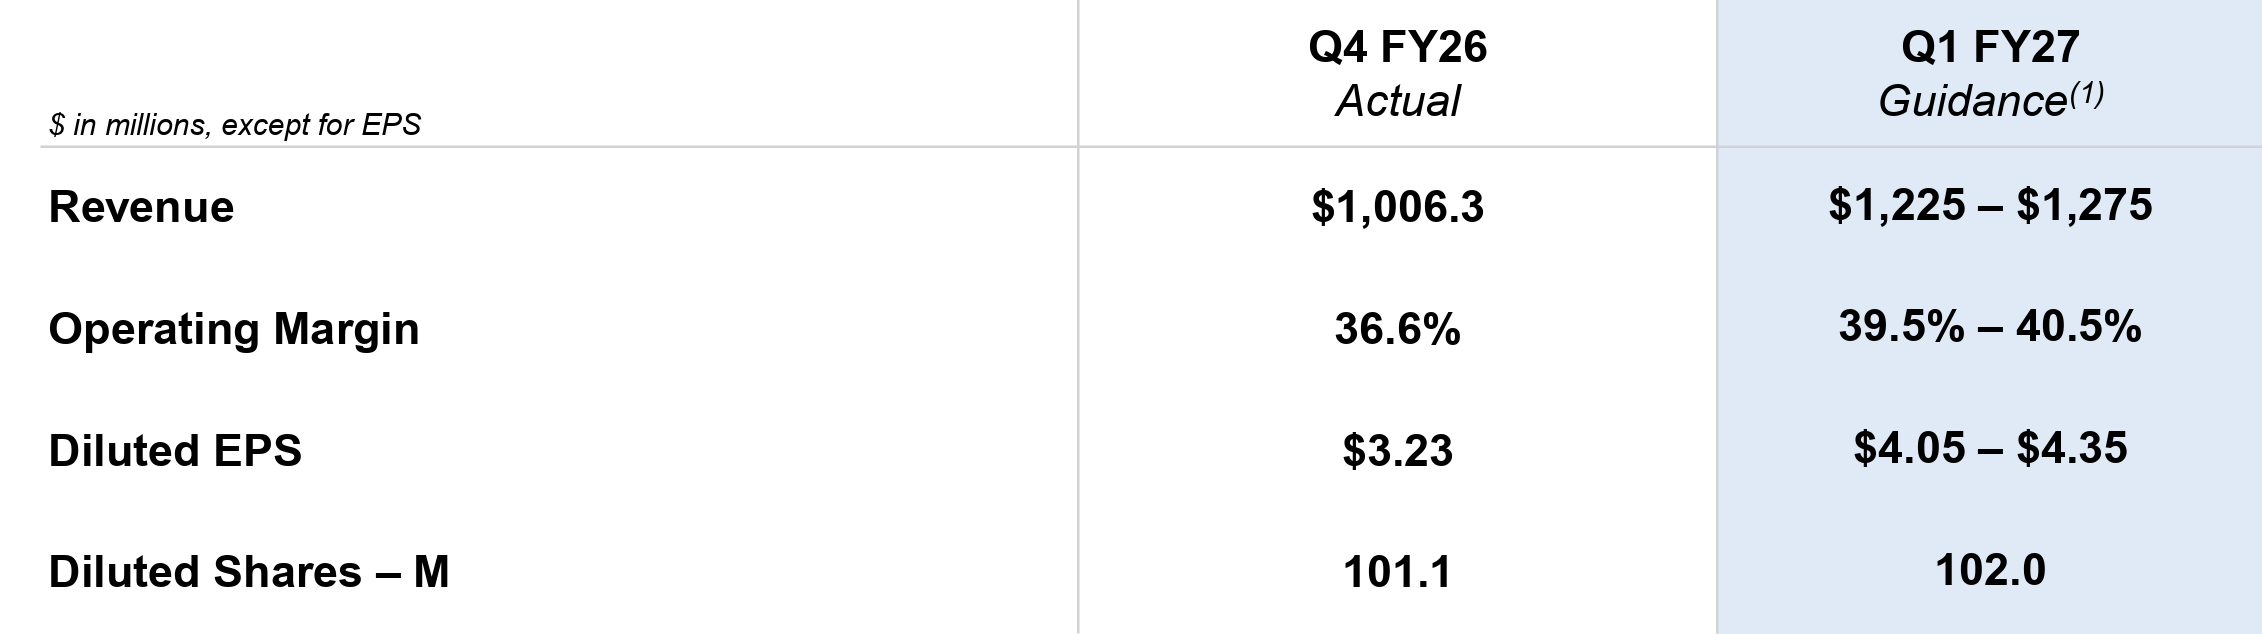
The headline GAAP net loss of $7.2bn primarily reflected a ~$7.8bn non-cash loss related to the conversion of convertible notes, rather than a deterioration in operating performance. The more consequential incremental information was management’s Q1 outlook: revenue guidance of $1.225bn-$1.275bn was well above consensus of ~$1.16bn, while the non-GAAP operating-margin outlook reached 39.5%-40.5%.
TL; DR: Key Takeaways
Revenue growth broadened across both reporting segments. Components revenue increased 103% yoy to $649mn, above consensus of ~$637mn, while systems revenue rose 123% to $357mn, also exceeding expectations. The faster systems growth suggests demand is extending beyond individual optical components toward more integrated connectivity products.
Source: Lumentum
Margins expanded faster than revenue. Non-GAAP gross margin reached 50.4%, versus 37.8% a year earlier and consensus of 48.8%. Non-GAAP operating margin rose to 36.6% from 15.0%, supporting non-GAAP net income of $326mn, up 416% yoy. The improvement may reflect a richer AI-related product mix, stronger utilization and operating leverage.
Q1 guidance reached the company’s target model more than one quarter ahead of schedule. Revenue guidance of $1.225bn-$1.275bn was substantially above consensus of ~$1.16bn. The $1.25bn midpoint implies ~24% qoq growth, while non-GAAP EPS guidance of $4.05-$4.35 exceeded expectations of ~$3.63. The 40% non-GAAP operating-margin midpoint also represents a further ~340 bps sequential expansion.
Source: Lumentum
The $7.2bn GAAP loss was driven by a non-cash debt-conversion charge. The loss was mainly caused by the difference between the carrying value of convertible debt and the fair value of equity delivered in its conversion. It did not represent a comparable cash outflow or operating loss. However, the transaction may reduce future interest expense while increasing share count and EPS dilution.
AI optics moved closer to the compute system. Management cited initial revenue from optical circuit switching, progress in 1.6T cloud modules, rising demand for high-power CPO lasers and initial orders for external laser-source modules. These developments support the view that optical connectivity is moving closer to the compute system, although the timing and scale of commercial adoption remain uncertain.
A muted share reaction reflected elevated expectations. The stock was little changed after hours despite the beat and strong guidance, following a 43% gain over the previous six months. That reaction does not diminish the operating results, but indicates that investors may now require continued upside to already-rising estimates.
Key debates
Is a ~40% non-GAAP operating margin sustainable?
When will 1.6T, CPO and optical circuit switching become material revenue contributors?
What is the continuing dilution impact of the debt conversion?
How exposed is the outlook to hyperscaler concentration?
Kioxia Holdings said on August 11 that a Bain Capital investment vehicle linked to SK hynix has become its largest shareholder after former parent Toshiba further reduced its stake.
Will SK Hynix exercise its rights and pass all regulatory steps to become Kioxia's largest shareholder by the end of 2027?
YesResult
0.00%
NoResult
0.00%
0 Polls
EndedTBD
Toshiba’s holding in the Japanese flash-memory maker fell to about 14.12% as of August 3, from 14.48%, leaving BCPE Pangea Cayman2 — a vehicle established by Bain Capital — as Kioxia’s biggest shareholder with a 14.19% stake.
The ownership structure is notable because SK hynix holds bonds that can be converted into substantially all of the voting rights of BCPE Pangea Cayman2. Kioxia has previously identified the arrangement as a potential conflict-of-interest risk, given that SK hynix is also one of its major competitors in the global memory-chip market.
The structure dates back to 2018, when a Bain-led consortium acquired Toshiba’s memory-chip business, later renamed Kioxia. SK hynix participated in the consortium but agreed to limit its voting rights in Kioxia to no more than 15% until 2028 unless Kioxia approves a larger stake.
The latest change does not mean SK hynix directly controls Kioxia, but it puts an investment vehicle closely tied to the Korean chipmaker at the top of Kioxia’s shareholder register. The arrangement could draw greater attention to governance, competitive conflicts and SK hynix’s longer-term position in Kioxia as the 2028 voting-right restriction approaches expiry.
Where chips become products — and the demand that pulls the whole chain
Will Hyperscalers raise their capex target again in upcoming quarterly results (Jul-Aug 2026)?
YesResult
0.00%
NoResult
0.00%
0 Polls
Ended
Executive summary
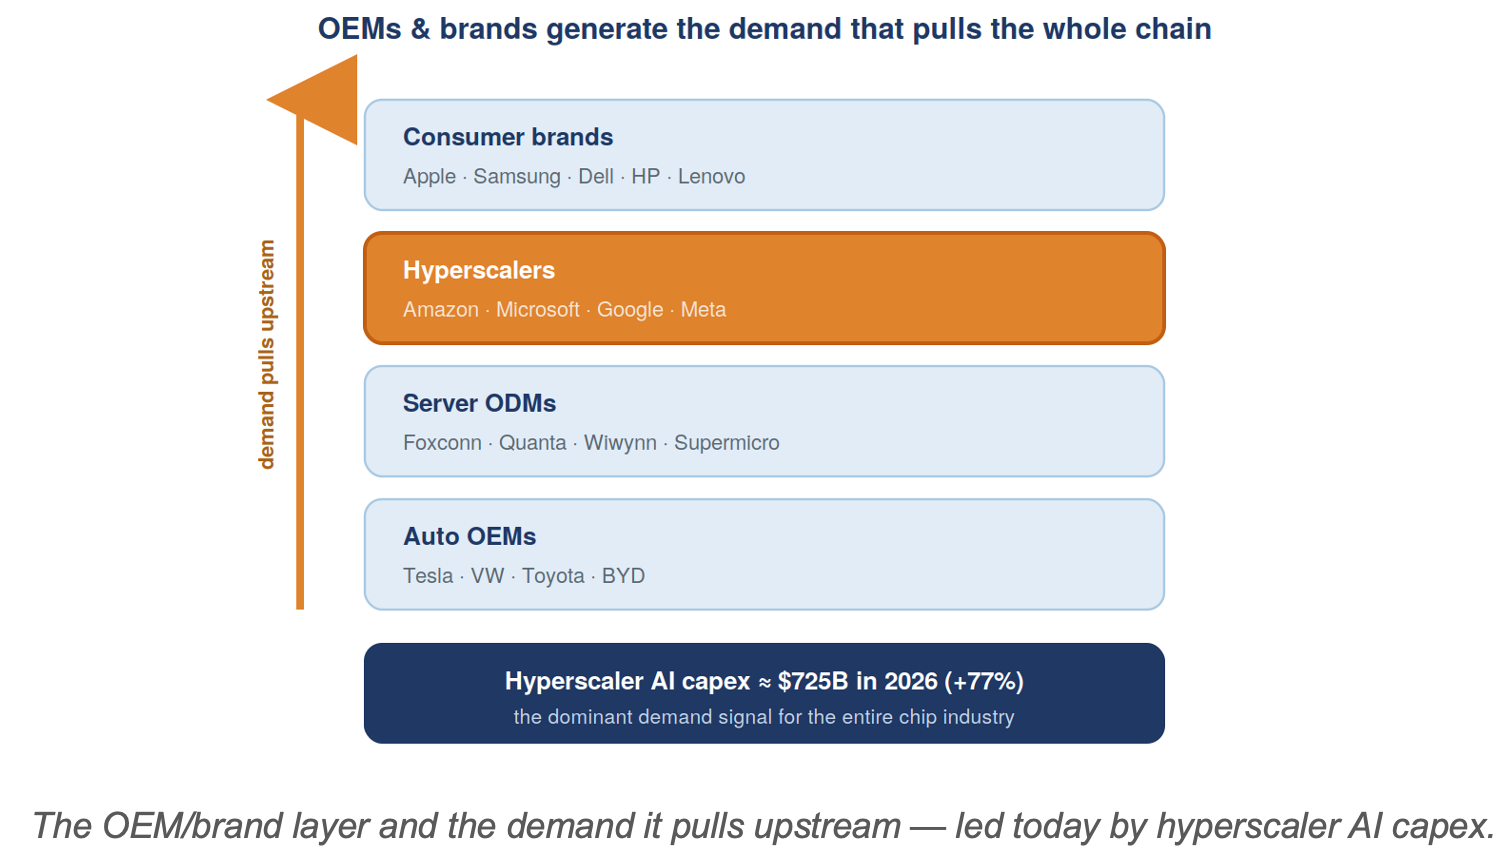
OEMs and brands are where chips become products — the device makers, server builders, and system companies that integrate semiconductors into things people and businesses buy. They are the origin of demand that pulls silicon through the entire value chain. The category spans consumer-device brands (Apple, Samsung, Dell, HP, Lenovo), data-center server ODMs (Foxconn, Quanta, Wiwynn, Supermicro), automakers, and — most importantly today — the hyperscalers whose AI-infrastructure spending now drives the cycle.
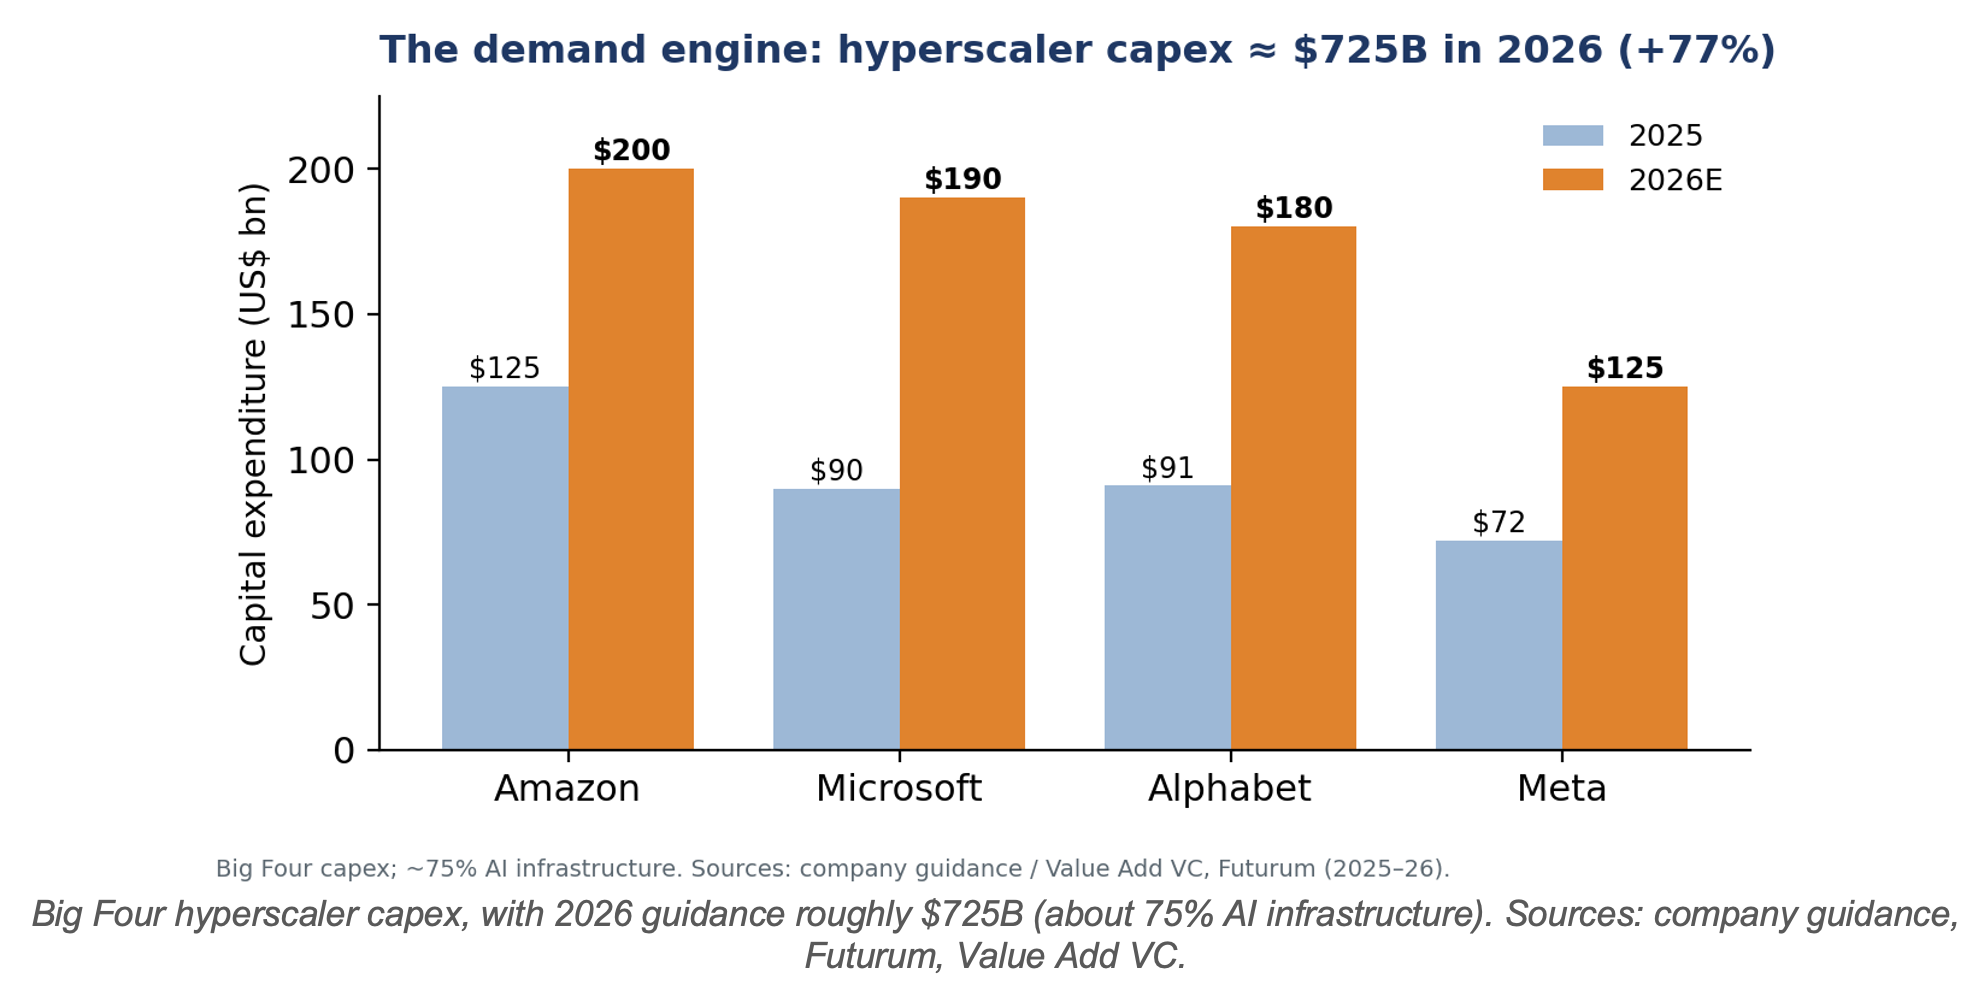
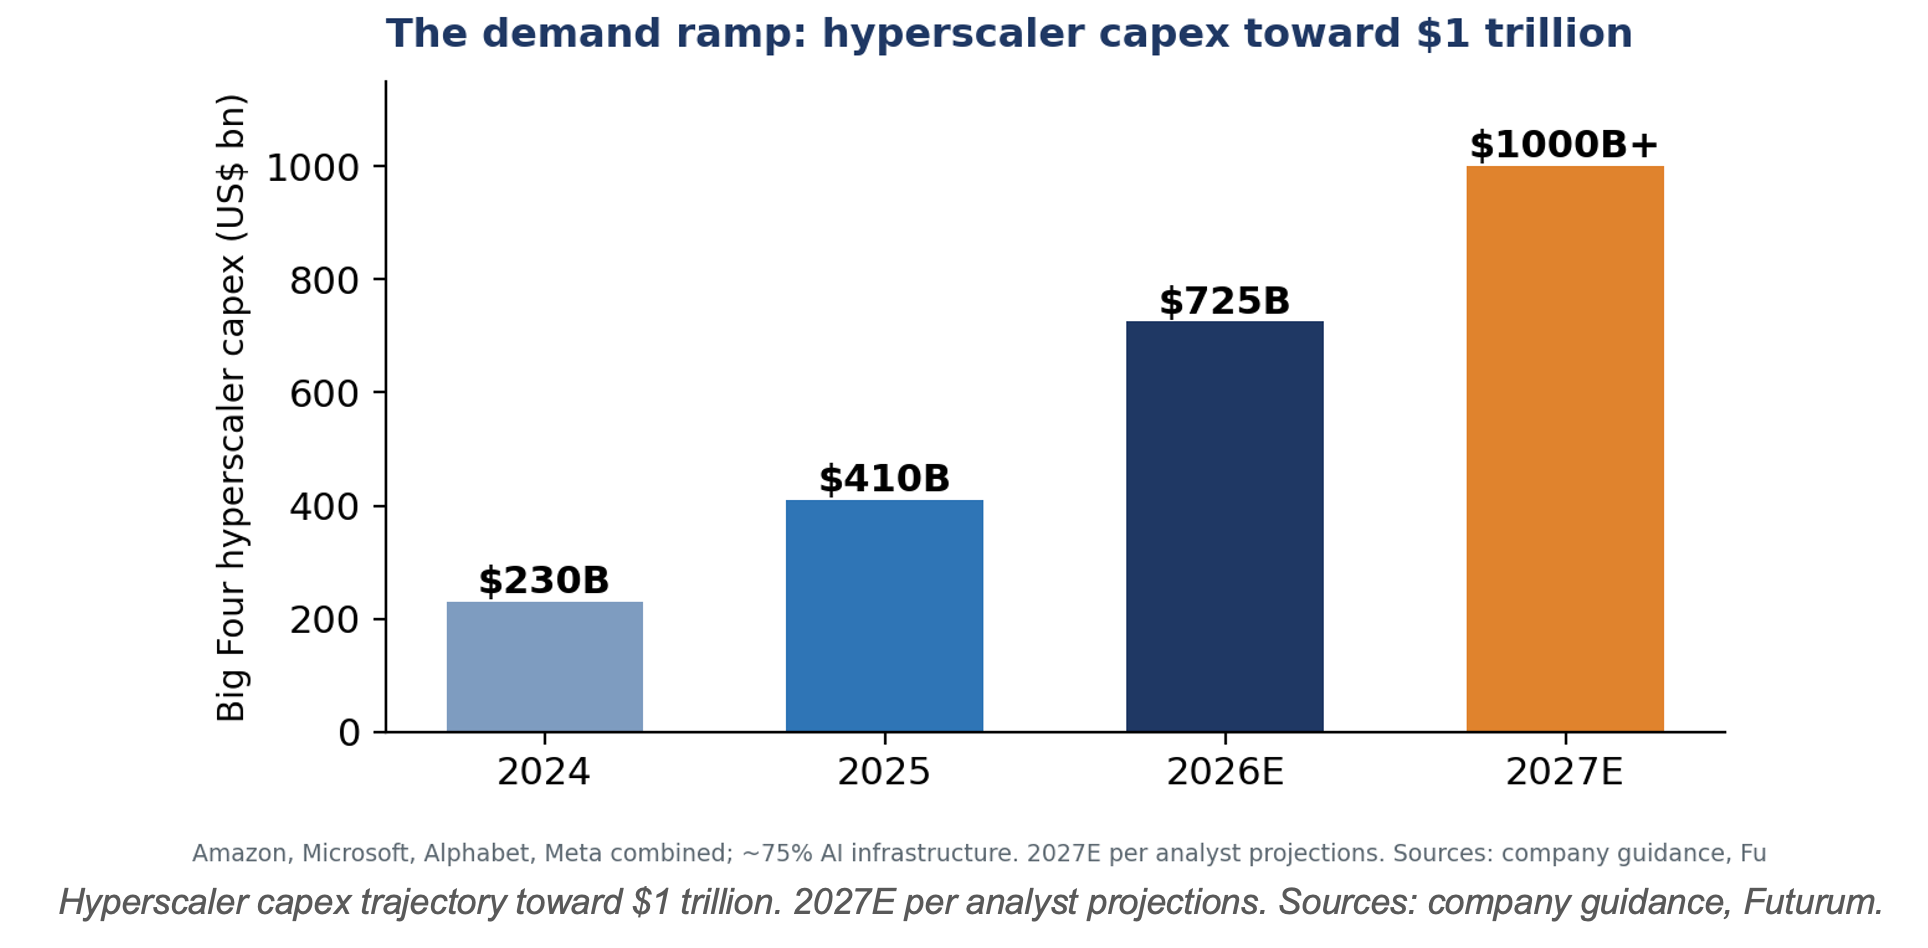
That demand signal is staggering: the four largest US hyperscalers are guiding to roughly $725 billion of capital expenditure in 2026, up about 77% from ~$410 billion in 2025, the overwhelming majority of it AI infrastructure, with analysts projecting big-tech capex above $1 trillion by 2027. This is the engine behind the foundry, fabless, memory, and packaging booms described in the companion primers.
1. Definition and strategic importance
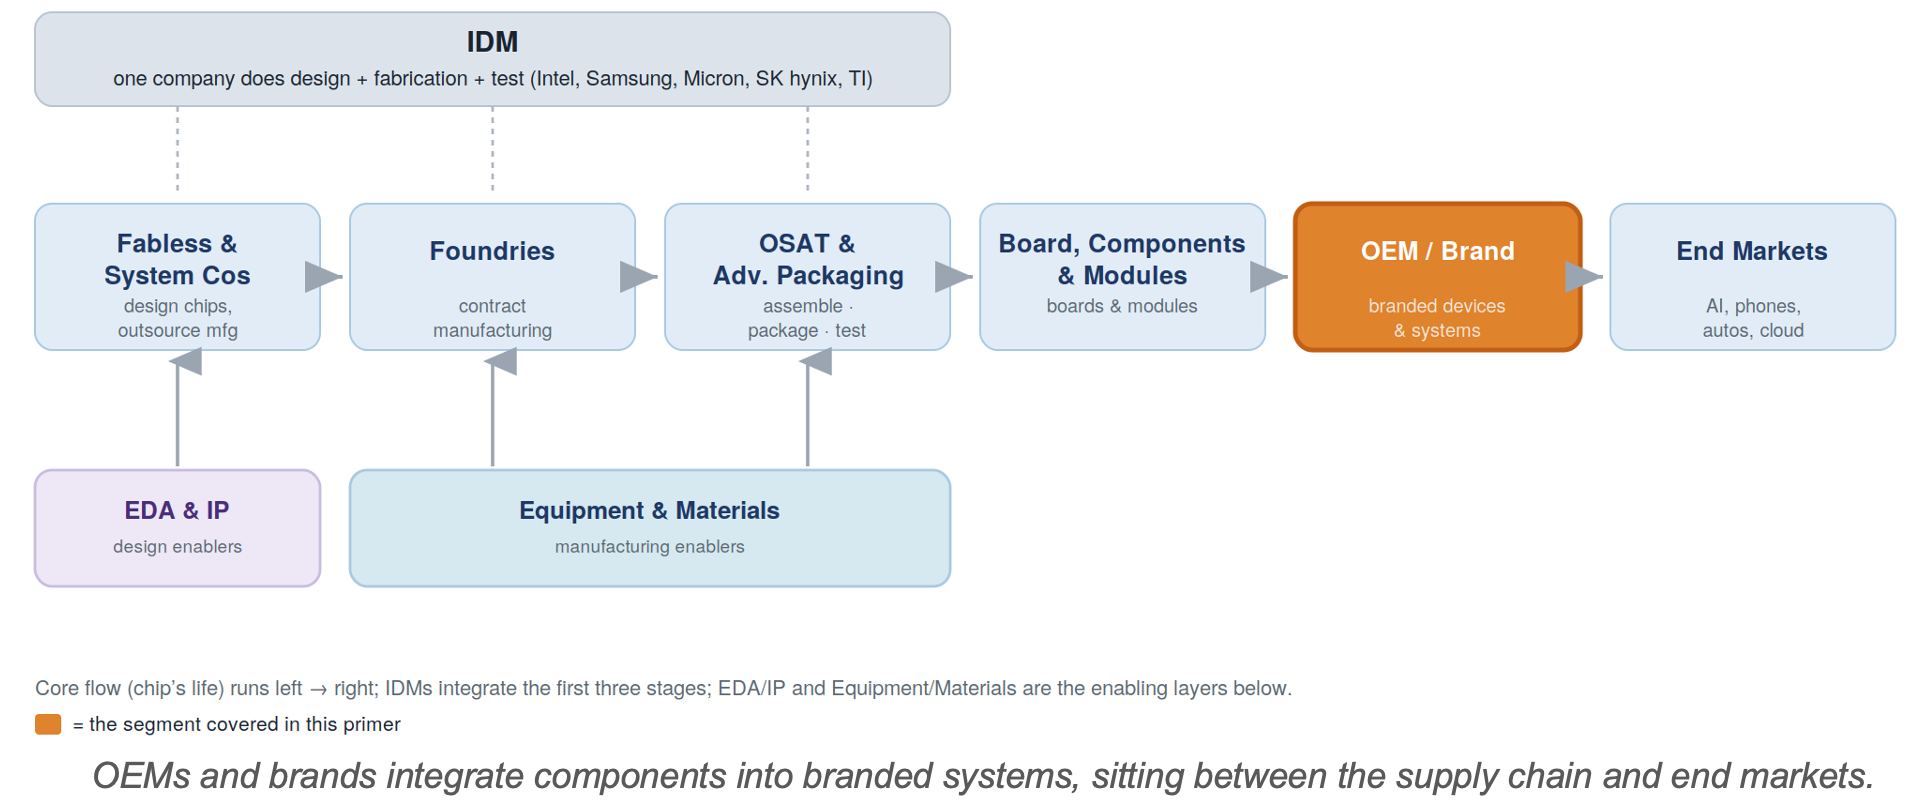
OEMs (original equipment manufacturers) and brands sit at the downstream end of the chain, buying chips, boards, modules, and components and assembling them into finished systems sold under a brand to end markets. They matter because demand starts here — every wafer TSMC makes and every tool ASML sells exists ultimately to satisfy an order that originates with an OEM or a hyperscaler.
2. Position in the value chain
A key nuance: the line between “brand” and “chip designer” is blurring. Apple and the hyperscalers now design their own silicon (covered in the Fabless primer), making them simultaneously the demand origin and an upstream design participant — a vertical integration reshaping the industry’s balance of power.
3. Structure: brands, ODMs, and hyperscalers
Consumer-device brands. Apple, Samsung, Dell, HP, Lenovo, Xiaomi and others design and sell branded phones, PCs, and electronics, capturing brand margin and owning the customer — often outsourcing physical assembly to contract manufacturers (e.g., Foxconn for Apple).
Server and data-center ODMs. The AI build-out is physically assembled by original design manufacturers — Foxconn (Hon Hai), Quanta, Wiwynn, Wistron, and Supermicro — which build the servers and racks that house GPUs and accelerators. These are high-volume, thin-margin businesses booming on AI orders.
Hyperscalers. Amazon, Microsoft, Google, and Meta are both the largest buyers of AI hardware and increasingly the designers of their own chips. Their capital spending is the dominant demand variable for the entire semiconductor industry today.
4. The demand engine: hyperscaler capital spending
The trajectory matters as much as the level: spending has roughly doubled each year and is projected to approach $1 trillion in 2027, with the five largest US hyperscalers reportedly planning to add around $2 trillion of AI-related assets by 2030.
5. Competitive structure and key players
The layer divides by role rather than by a single revenue ranking; margins differ sharply between brand owners and contract builders.
Category
Examples
Role in the
chain
Device brands
Apple, Samsung, Dell, HP,
Lenovo
Design/sell branded devices;
own the end customer; rich margins
Hyperscalers
Amazon, Microsoft, Google, Meta
Largest AI-hardware buyers; also design custom silicon
Server ODMs
Foxconn, Quanta, Wiwynn,
Supermicro
Build AI servers and racks
(thin-margin, high-volume)
Auto OEMs
Tesla, VW, Toyota, BYD
Rising semiconductor content per vehicle
6. Business model and economics
Economics vary enormously by role. Brand owners like Apple capture high margins by owning design, software, and the customer relationship, while contract ODMs (Foxconn, Quanta) run on razor-thin margins despite enormous revenue. Hyperscalers are not selling hardware at all — their chip and server spending is a cost of delivering cloud and AI services, which is why the return on that capex is so closely scrutinized.
7. Demand drivers
• AI infrastructure build-out. Hyperscaler capex (~$725B in 2026) is the single largest pull on advanced logic, memory, and packaging.
• Device refresh cycles. AI PCs and AI smartphones, plus normal replacement of the ~1.2 billion phones and ~250 million PCs shipped each year, provide a large volume base.
• Automotive content. Electrification and ADAS keep raising the dollar value of chips per vehicle.
8. Geopolitics and strategic dimension
OEMs sit atop globally distributed supply chains exposed to tariffs, export controls, and reshoring pressure. Device assembly is shifting (e.g., toward India and Vietnam); AI-server supply chains concentrate in Taiwan-linked ODMs; and the hyperscalers’ build-out is increasingly constrained not by chips but by power and data-center construction — the emerging physical bottleneck of the AI era.
9. A framework for financial analysis
• Follow the capex guidance. Hyperscaler capital-spending guidance is the leading indicator for the whole semiconductor cycle — watch it above almost anything else.
• Separate brand from contract economics. Apple’s margins and a server ODM’s are not comparable despite both being “OEMs.”
• Watch the ROI question. Whether AI revenue justifies the capex is the debate that could move the entire chain.
• Track the physical constraints. Power availability and data-center construction timelines increasingly gate demand.
10. Key debates
• Is the AI capex sustainable? Whether ~$725B+ of annual investment generates adequate returns — the industry’s biggest open question; a pullback would ripple through every upstream segment.
• Vertical integration. How far OEMs and hyperscalers take in-house silicon, eroding the merchant-chip market.
• Demand concentration. Whether reliance on a handful of hyperscalers makes the cycle more fragile.
11. Risk summary
• AI-capex sustainability — the dominant risk; valuations across the chain embed continued spending.
• Demand concentration — a few hyperscalers drive much of leading-edge demand.
• Margin asymmetry — contract ODMs are structurally low-margin and exposed.
• Physical constraints — power and construction bottlenecks; supply-chain and tariff exposure.
Assembly, test, and the packaging revolution reshaping the back end
Executive summary
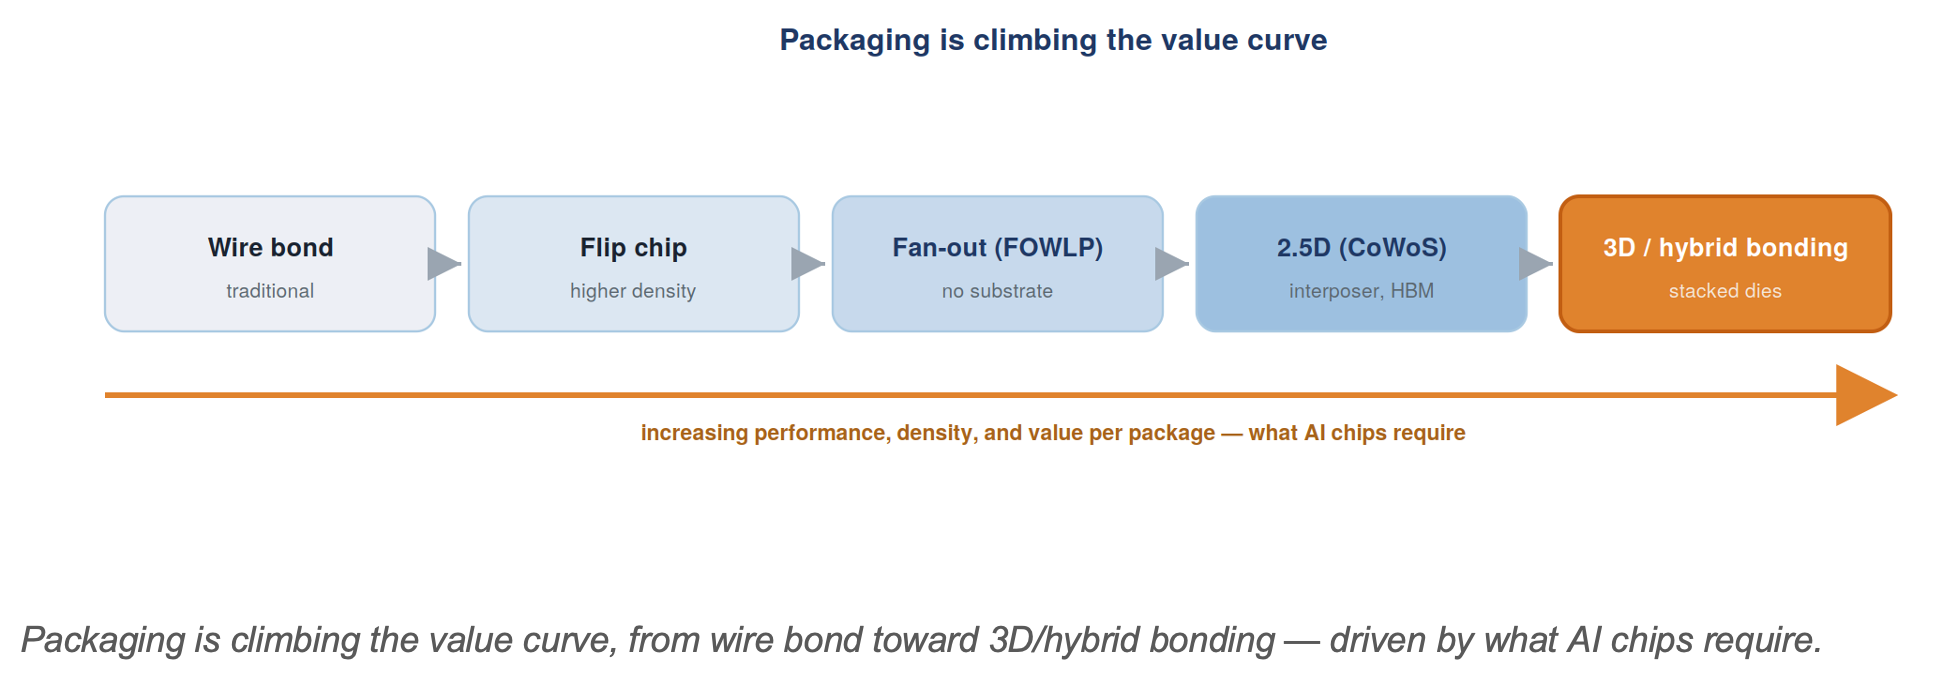
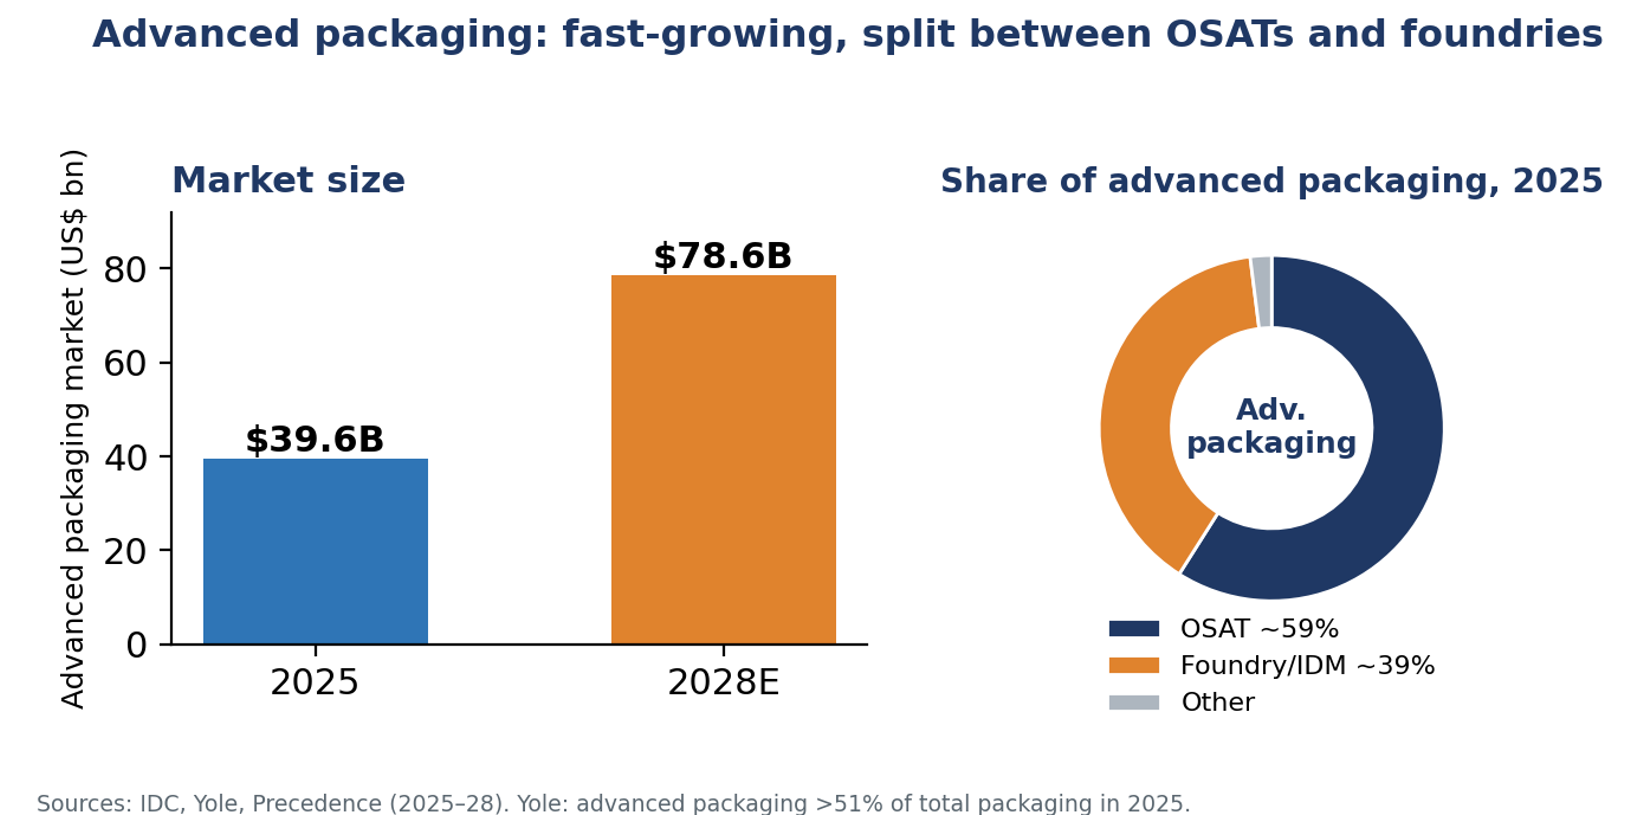
OSAT — outsourced semiconductor assembly and test — firms take finished wafers and turn them into packaged, tested chips. Historically the lowest-margin link in the chain, the back end has been transformed by advanced packaging: chiplets, 2.5D/3D stacking, hybrid bonding, and platforms like TSMC’s CoWoS that are essential to AI chips. The advanced-packaging market is growing from roughly $40 billion in 2025 toward ~$79 billion by 2028.
The competitive twist is that this lucrative new work is contested by three groups: the OSATs (ASE, Amkor, JCET), the foundries (TSMC), and the IDMs (Intel, Samsung). OSATs hold roughly 59% of advanced packaging and the foundry/IDM group about 39% — and the foundries are pushing in hard, because advanced packaging increasingly uses wafer-level, fab-style processes that blur the old front-end/back-end line.
1. Defining the sector and its strategic importance
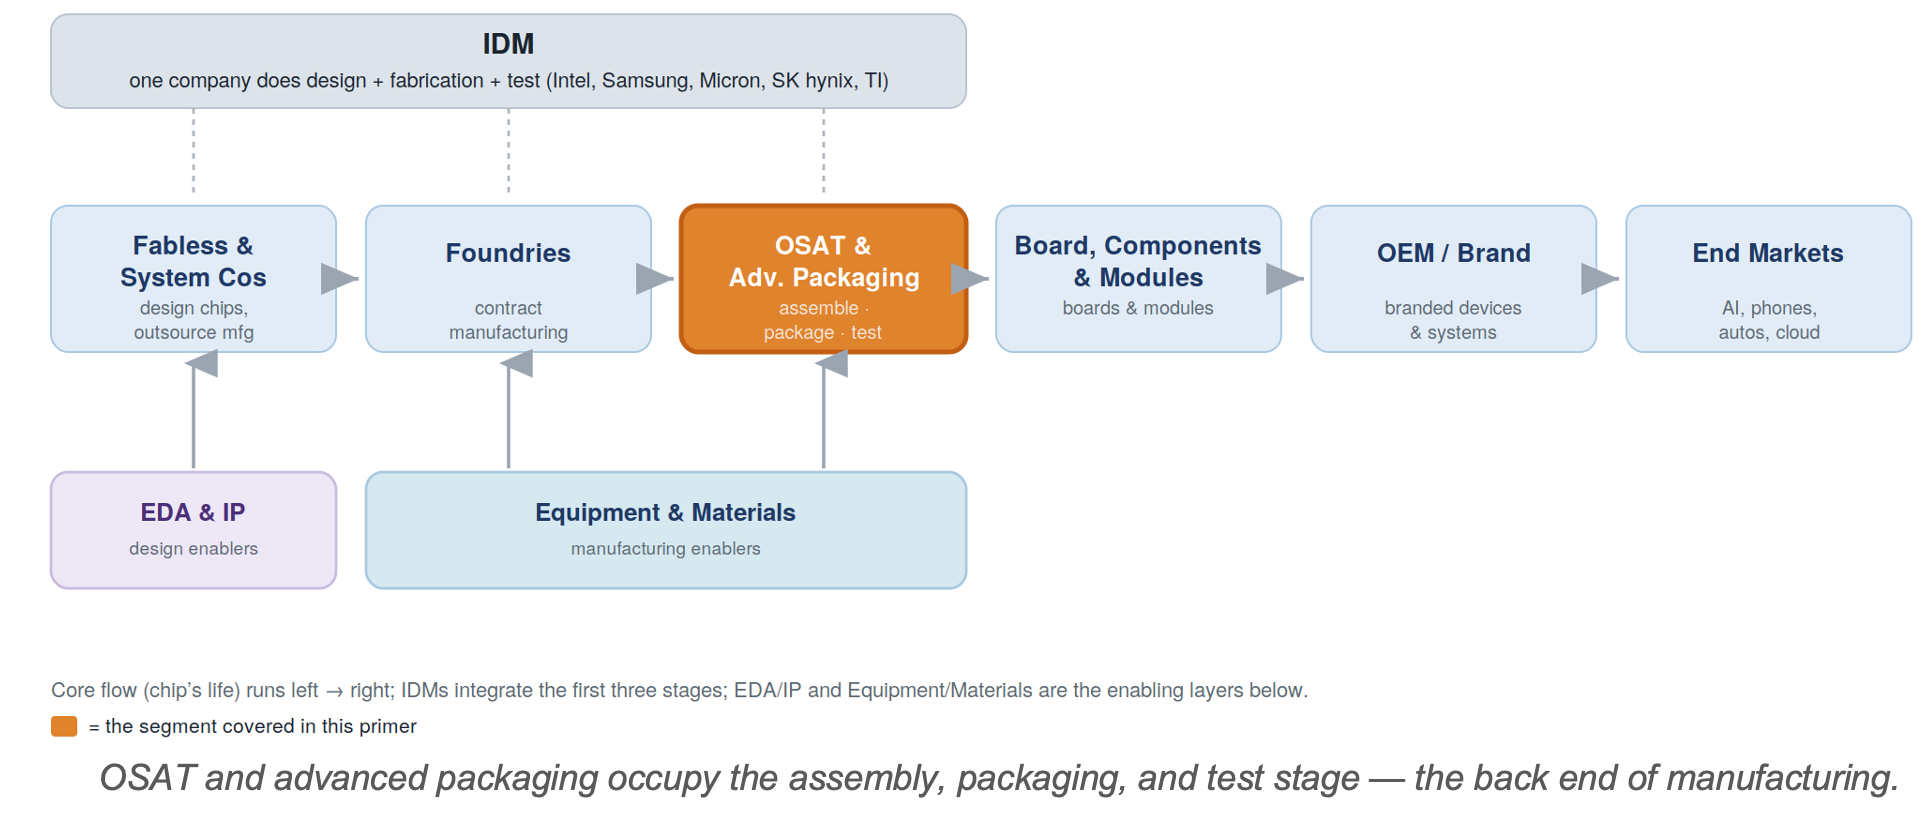
After a wafer leaves the fab, it must be diced into individual dies, connected and protected within a package, and tested. OSATs provide these back-end services under contract, just as foundries provide front-end manufacturing. Once an afterthought, packaging is now a primary determinant of chip performance — which has turned the back end into a strategic battleground.
2. Position in the value chain
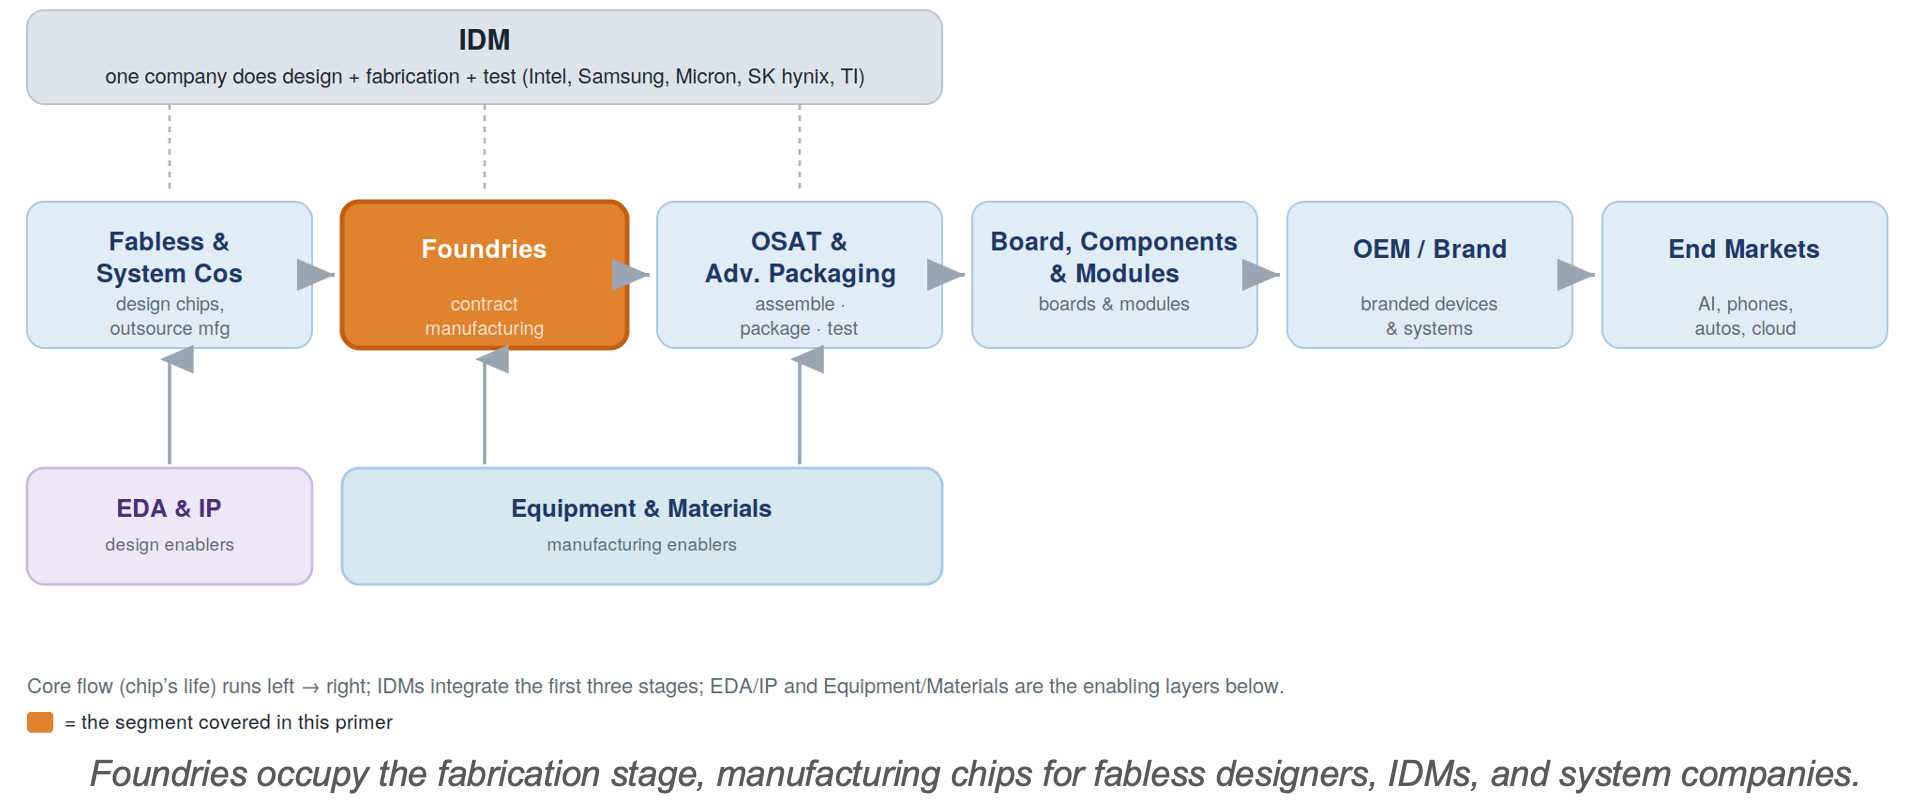
As noted in the Equipment primer, the OSAT service sits here in the chain, while the equipment used to perform it is upstream. Advanced packaging is now drawing front-end tools into the back end — the central structural shift in this segment.
3. Structure: from traditional assembly to advanced packaging
Traditional OSAT. High-volume wire-bond and flip-chip assembly and test for the bulk of the world’s chips — a thin-margin, scale-and-cost business (Amkor’s gross margin runs around 15%, a world away from foundry economics).
Advanced packaging. The high-value frontier: 2.5D/3D integration, chiplets, fan-out, and hybrid bonding that connect multiple dies and stacked HBM into one high-performance package. This is what AI accelerators require, and by some estimates it surpassed traditional packaging as a majority of total packaging value in 2025.
The players. ASE is the world’s largest OSAT (with a large electronics-manufacturing arm alongside assembly/test); Amkor is second and JCET is China’s leader, followed by Powertech, TFME, and test specialists such as KYEC. But TSMC (CoWoS, SoIC), Samsung (I-Cube, X-Cube), and Intel (Foveros, EMIB) now perform much of the cutting-edge packaging themselves.
4. Market size and segmentation
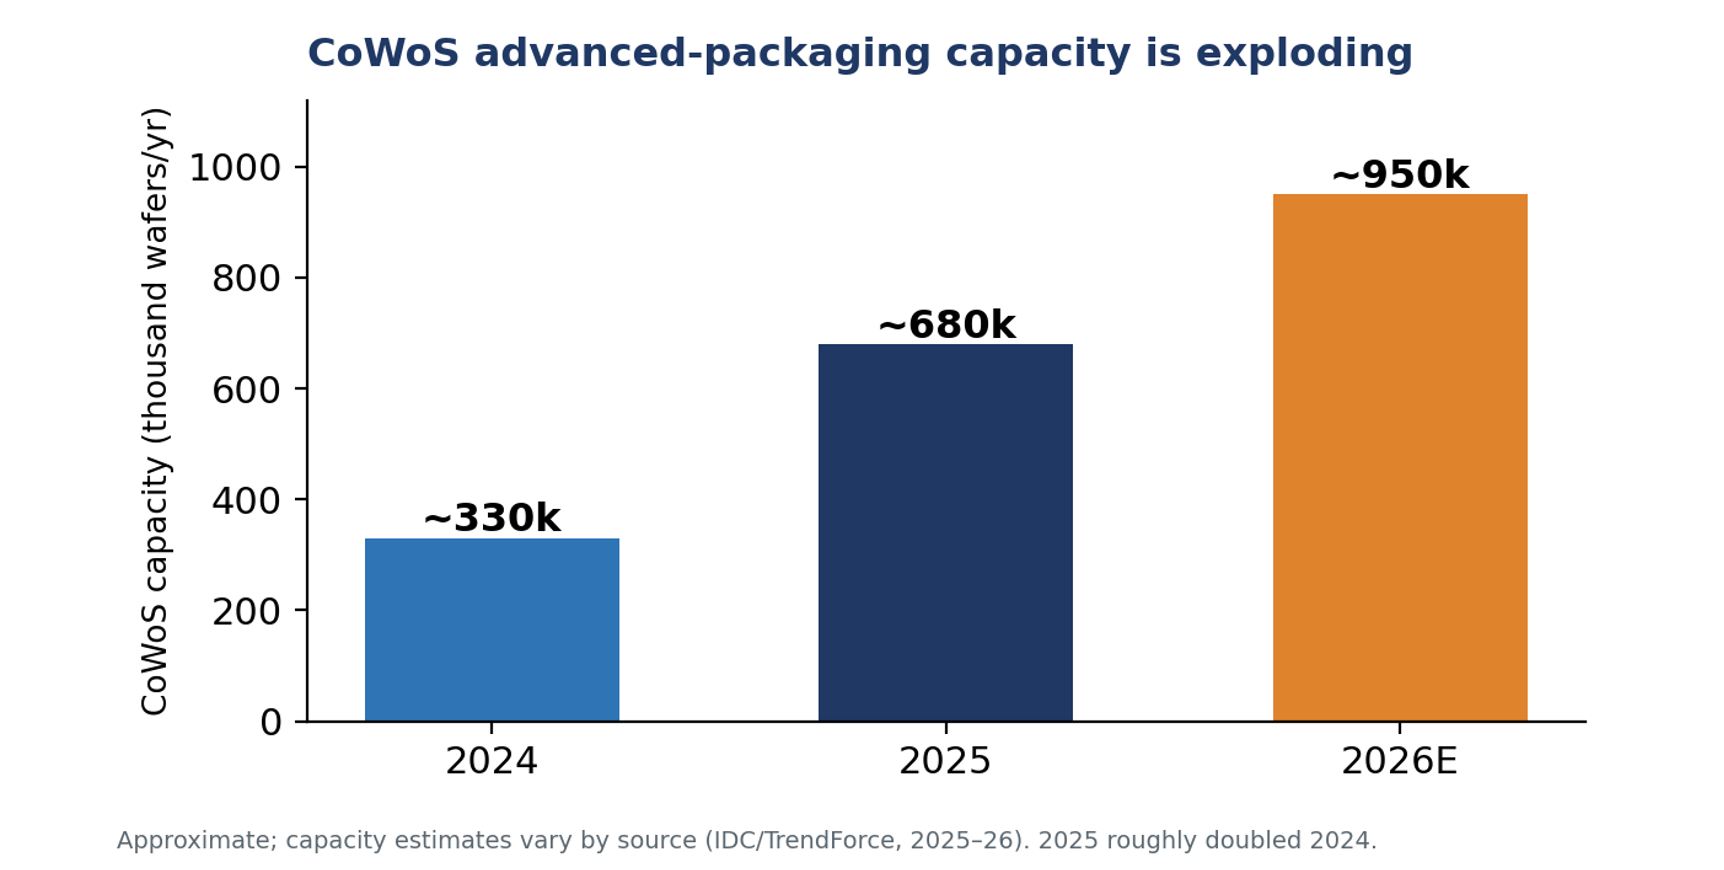
The growth is concentrated in AI-related advanced packaging, and the single most-watched capacity metric is TSMC’s CoWoS, which has roughly doubled year-on-year.
5. Competitive structure and company financials
OSATs are scaled but thin-margin; the foundry/IDM camp is capturing the most advanced (and most profitable) packaging.
Company
Position
Scale
Note
ASE Technology
#1 OSAT
~$20B group revenue
Advanced-packaging sales
~$1B in 2025; includes SPIL and an EMS arm
~680k CoWoS wafers in 2025; allocates to Nvidia, Google, others
6. Business model and economics
Traditional OSAT is a high-volume, low-margin business: gross margins in the mid-teens, competing on cost, scale, and geographic footprint. Advanced packaging offers a path to better economics, but it requires heavy investment in wafer-level, fab-style equipment — which is precisely why the better-capitalized foundries can compete for it. The result is margin pressure from both ends: commodity assembly below, foundry encroachment above.
7. Demand drivers
• AI and HBM. Stacking logic with high-bandwidth memory and integrating chiplets is the core of advanced-packaging demand.
• The end of easy scaling. As transistor shrinks get harder, more performance comes from packaging — structurally favouring this segment.
• CoWoS allocation. TSMC’s packaging capacity gates AI-GPU supply, with 2026 allocations reportedly reserved for Google’s TPU, Meta, OpenAI, and others.
8. Geopolitics and strategic dimension
Packaging has become a reshoring priority: the US CHIPS Act funds back-end capacity (Amkor’s ~$2 billion Arizona plant, with a 10-year TSMC agreement), and Europe is supporting its own. The US-China contest is also reshaping OSAT customer allocation, with Western firms diversifying away from China-based assemblers toward Vietnam, Taiwan, and the US. JCET and other Chinese OSATs, meanwhile, anchor a parallel domestic supply chain.
9. A framework for financial analysis
• Distinguish traditional from advanced. Advanced-packaging mix and growth are the value drivers; traditional assembly is a thin-margin base.
• Watch capex and utilization. A back-end capacity race raises overbuild risk; utilization is the cyclical signal.
• Track foundry encroachment. How much advanced packaging TSMC and Samsung keep in-house caps the OSAT opportunity.
• Mind margins. OSAT returns are structurally lower than foundries’ — advanced packaging is the path up, not a guarantee.
10. Key debates
• Who captures advanced-packaging value? OSATs versus foundries (TSMC) versus IDMs — the segment’s defining contest.
• Overbuild risk. Whether the simultaneous capacity race produces a glut in 2026–27.
• Hybrid bonding leadership. Which players master sub-10-micron hybrid bonding at high yield.
11. Risk summary
• Thin margins — structural, especially in traditional assembly.
• Foundry encroachment — TSMC capturing the most profitable packaging in-house.
The contract chip manufacturers — and TSMC’s extraordinary dominance.
What will TSMC's 3Q2026 operating margin be (guided 56-58%)?
<56%Result
0.00%
56-58%Result
0.00%
>58%Result
100.00%
1 Polls
EndedTBD
Executive summary
Foundries are pure-play contract chip manufacturers: they fabricate chips designed by others and own no end-product IP. Their existence is what makes the fabless model possible. The segment is defined by one company’s dominance — TSMC, with roughly 70% of global foundry revenue and an even larger share at the leading edge — arguably the single most strategically important company in technology. TSMC’s 2025 revenue reached $122.4 billion (+36%) at a 59.9% gross margin, and it guided 2026 capital spending of $52–56 billion.
Behind TSMC, Samsung Foundry (a distant second, hampered by yield issues), China’s SMIC (growing despite export controls), and the mature-node specialists UMC and GlobalFoundries compete in a far less profitable tier. Intel Foundry is a heavily funded but still nascent challenger. The economics at the leading edge are brutal in capital but, for TSMC, exceptional in pricing power — its 2nm wafers reportedly price around $30,000 each.
1. Defining the sector and its strategic importance
A foundry sells manufacturing capacity and process technology, not products. Customers — fabless firms, IDMs, and system companies — send designs to be fabricated at an agreed price per wafer. Because virtually all advanced chips in the world are made by a handful of foundries (and overwhelmingly by TSMC), the segment is the physical chokepoint of the entire digital economy and the focal point of industrial policy.
2. Position in the value chain
TSMC’s moat is built from process leadership, manufacturing yield, the breadth of its design ecosystem (IP, EDA support, and advanced packaging), and sheer scale — each reinforcing the others. Leading customers co-develop on its newest node, which funds the next node, which attracts the next generation of customers.
Companies that design and manufacture their own chips — memory, analog, power, and Intel.
Executive summary
Integrated device manufacturers (IDMs) both design and manufacture their own chips — the original structure of the semiconductor industry, predating the split into fabless designers and contract foundries. IDMs own fabs, control their process technology, and sell finished products under their own brand. They persist because, in their domains, product and process are inseparable. Today they fall into three families: memory (Samsung, SK hynix, Micron), analog/power/embedded (Texas Instruments, Analog Devices, Infineon, ST, NXP, Microchip, Renesas), and logic (Intel, now pivoting toward a foundry model).
The defining dynamic of the current cycle is the AI-driven memory supercycle. High-bandwidth memory (HBM) has transformed DRAM from a boom-bust commodity into a constrained, premium, strategically vital product — so much so that in 2025 SK hynix overtook Samsung in both DRAM revenue and, for the first time ever, operating profit. The analog/power family, by contrast, offers steadier, less cyclical growth tied to automotive and industrial electronics, while Intel’s foundry transition is one of the industry’s biggest open questions.
1. Defining the sector and its strategic importance
An IDM performs the entire chip lifecycle in-house: design, wafer fabrication, and assembly/test. This is the opposite of the disaggregated model, in which a fabless company designs and a foundry manufactures. IDMs remain vertically integrated where manufacturing know-how is itself the competitive advantage — the recipe for a DRAM cell or a precision data converter lives in the process, not in a licensable design file.
Their strategic weight is large: IDMs own the memory that every AI accelerator needs, the analog and power chips in every car and factory, and — through Intel — a substantial share of Western leading-edge manufacturing capacity. They also carry the heaviest financial burden in the industry, funding both R&D and multi-billion-dollar fabs.
2. Position in the value chain
In the value-chain map, an IDM effectively spans the first three stages — design, fabrication, and test — within a single company, rather than handing the chip between specialist firms.
This integration is increasingly the exception rather than the rule. Leading-edge logic largely abandoned it (fabless + foundry), and even some IDMs now outsource their most advanced nodes to TSMC while keeping mature production in-house — a “fab-lite” hybrid. Memory and analog remain the strongholds of full integration.
3. The three families of IDMs
IDMs are not one business but three, with very different economics. (This corrects a framing point: there are three families, not two — memory, analog/power/embedded, and logic.)
The design-enabler layer of the chip economy — the software and reusable IP that make every chip possible. A companion to Semiconductor Equipment & Materials primer.
Will Cadence Design Systems' IP segment revenue growth outpace its EDA segment growth by more than 500 basis points (5%) in FY2026?
YesResult
0.00%
NoResult
0.00%
0 Polls
Ended
Executive summary
Electronic design automation (EDA) and semiconductor intellectual property (IP) form the design-enabler layer of the chip industry. EDA is the software — and specialized hardware — used to design, simulate, verify, and sign off integrated circuits before they are manufactured. Semiconductor IP is pre-designed, pre-verified circuit blocks (processors, interfaces, memory controllers, analog functions) that chip designers license and reuse rather than build from scratch. Together they are the indispensable toolkit of every fabless company, IDM, and increasingly every hyperscaler designing its own silicon.
The sector is small in revenue but immense in leverage. The combined EDA-and-IP market is on the order of $20 billion a year — a fraction of the equipment market and roughly 2% of global semiconductor revenue — yet no chip reaches a fab without passing through it. That asymmetry, plus software economics, produces a remarkable financial profile: gross margins above 80%, recurring revenue of 70–80%+, customer retention above 95%, multi-year backlogs, and contractual price escalators that lift revenue from existing customers every year.
Structurally the sector is even more concentrated than equipment. EDA is a “Big Three” oligopoly — Synopsys, Cadence, and Siemens EDA — holding roughly three-quarters of the market between them. Processor IP is dominated by Arm, whose designs sit in the overwhelming majority of the world’s smartphones and a fast-growing share of data-center and automotive chips. Two forces now define the outlook: artificial intelligence (which both multiplies chip-design demand and is being embedded inside the design tools themselves), and geopolitics (the May–July 2025 episode in which the United States briefly cut China off from EDA tools demonstrated that design software is a chokepoint as potent as lithography).
1. Defining the sector and its strategic importance
EDA and IP answer a single problem: a modern system-on-chip can contain tens of billions of transistors, far beyond what any team could lay out by hand. EDA software automates the design, while IP supplies ready-made building blocks. A leading-edge processor might combine licensed CPU cores, a GPU, memory controllers, and high-speed interfaces — much of it third-party IP — stitched together and verified using tools from two or three EDA vendors.
The strategic point is leverage. The sector is often described as “small but mighty”: although EDA spending is only around 2% of the semiconductor industry’s revenue, it gates the other 98%. A fab can cost tens of billions of dollars, but it has nothing to build without a finished, verified design — and that design cannot exist without these tools. This is why EDA and IP command software-like margins and why they have become instruments of national technology policy.
Financially, the sector is also notably less cyclical than equipment and materials. Equipment demand tracks fab capital expenditure, which swings with the chip cycle; EDA and IP track customers’ R&D budgets and design activity, which are far steadier — companies keep designing through downturns. Combined with recurring-revenue contracts, this gives the sector unusually high earnings visibility.
2. Position in the value chain
In the layered view of the industry, two enabling layers sit beneath the core chip-making flow. Equipment and materials enable fabrication and packaging;IP and EDA enable design. This primer covers the latter — the layer feeding the very first stage of the chip’s life.
A useful contrast with the equipment sector: both are upstream enablers, but they attach to different stages and have different economics. Equipment is capital-intensive hardware sold into a cyclical capex budget; EDA and IP are capital-light software and licensing sold into steadier R&D budgets. The two also differ in customer breadth — EDA and IP serve every company that designs a chip, including fabless firms and hyperscalers that own no fabs at all.
3. The chip design flow — and where tools and IP fit
Each EDA tool category maps to a stage of the design flow, which runs from an architectural specification to “tapeout” (the point at which the finished design is sent to the foundry to make photomasks). IP blocks are inserted along the way rather than designed from scratch.
Two features of this flow drive the sector’s economics. First, verification is the single largest consumer of effort — frequently cited as 60–70% of design time — which is why simulation, emulation, and formal-verification tools (and the expensive hardware emulators that accelerate them) are such a large and profitable part of EDA. Second, the flow is sticky end-to-end: once a team builds a chip on a given vendor’s tools and qualified IP, switching mid-project risks schedule and yield, so customers rarely leave. Artificial intelligence is now compressing this flow — machine-learning optimizers can explore design options and close timing far faster than manual iteration, a capability the vendors are monetizing as a premium tier.
4. Market size and segmentation
As with equipment and materials, the two halves of this sector are best presented separately. Market-sizing also varies widely by methodology, so the figures below are indicative ranges anchored to the most authoritative tracker — SEMI’s Electronic Design Market Data (EDM) report, compiled from member-company filings.
4.1 Electronic design automation (EDA)
Core EDA — design, verification, and signoff software plus emulation/prototyping hardware — is roughly a $14–17 billion market growing at a high-single-digit to low-double-digit rate. SEMI’s EDM report, which combines EDA and IP, recorded $5.47 billion in the fourth quarter of 2025 alone (+10.3% year-on-year), implying a combined annual run-rate around $20–21 billion; computer-aided engineering (simulation/verification) was the largest single category at about $2.08 billion that quarter. Demand is broadly split across IC physical design and verification, verification/CAE, and PCB/system design.
4.2 Semiconductor IP
Licensable semiconductor IP is a smaller market — commonly estimated at $4–7 billion depending on whether processor royalties are fully counted — but it is strategically pivotal because it includes the processor architectures at the heart of most chips. The category divides into processor IP (CPU, GPU, NPU), interface IP (PCIe, USB, DDR/HBM memory, Ethernet, and the emerging UCIe chiplet interconnect), foundation IP (standard-cell libraries and memory compilers), and analog and security IP. Processor IP is the largest and most concentrated slice, dominated by Arm.
A structural quirk worth noting for analysts: in SEMI’s data the IP line is heavily influenced by a single dominant player, so reported IP “market” growth can swing with one company’s licensing timing rather than broad demand.
5. EDA tool segments and their leaders
EDA divides into several tool families, each with a clear duopoly or near-duopoly:
• Logic synthesis & digital implementation (turning RTL code into a physical layout) — Synopsys (Fusion Compiler, Design Compiler) and Cadence (Genus, Innovus).
• Verification (simulation, formal, and hardware emulation/prototyping) — the largest spend pool. Synopsys (VCS, Verdi, ZeBu) and Cadence (Xcelium, Palladium, Protium); emulation hardware is a high-value, fast-growing sub-segment driven by complex AI chips.
• Custom / analog & mixed-signal design — Cadence (Virtuoso) is the long-standing leader, with Synopsys (Custom Compiler) competing.
• Signoff (timing, power, and physical verification) — Synopsys (PrimeTime, IC Validator) and Cadence (Tempus, Voltus); Siemens EDA’s Calibre is the de facto standard in physical verification (DRC/LVS).
• PCB & system design — Cadence (Allegro), Siemens (Xpedition), with Altium and Zuken also present.
• Manufacturing / TCAD / DFM — Synopsys and Siemens; increasingly important as design and manufacturing co-optimize at advanced nodes.
6. IP segments and their leaders
• Processor IP (CPU/GPU/NPU) — dominated by Arm, whose architecture underpins essentially all smartphones and a rising share of data-center and automotive silicon. The open-standard RISC-V instruction set (commercialized by SiFive and others) is the principal long-term challenger. Synopsys (ARC) and Cadence (Tensilica) supply specialized processor and DSP cores; Imagination supplies GPU IP; Ceva supplies DSP/AI IP.
• Interface IP — high-speed connectivity (PCIe, DDR/HBM, USB, Ethernet, UCIe). Synopsys is the clear leader and this is its largest IP category; Cadence and Alphawave are significant competitors. Interface IP is booming with AI chips, which need enormous memory and chiplet bandwidth.
• Foundation, memory, analog, and security IP — standard-cell libraries and memory compilers (Arm, Synopsys), plus analog and security blocks. These are lower-profile but high-volume, deeply embedded in the foundry ecosystem.
7. Competitive structure and company financials
EDA is among the most concentrated software markets in existence. Per TrendForce, the three leaders held roughly Synopsys 31%, Cadence 30%, and Siemens EDA 13% in 2024 — about three-quarters of the market combined. The remainder is split among Keysight, Zuken, Ansys (now part of Synopsys), and a cohort of emerging Chinese vendors.
The financial profile across the leaders is exceptional — high growth, software margins, and large backlogs. The latest full-year results:
The defining corporate event was Synopsys’ $35 billion acquisition of Ansys, completed in July 2025, which extends the company from chip design into system-level simulation (thermal, electromagnetic, structural, and fluid dynamics). The logic is that modern chips cannot be designed in isolation from the systems they sit in — a 700-watt data-center GPU must be co-designed with its cooling. The deal expands Synopsys’ addressable market to roughly $31 billion and, to satisfy regulators, required divestitures (the Optical Solutions Group and PowerArtist). By mid-2025 Cadence and Synopsys each carried equity-market values around $75–80 billion — multiples that reflect their recurring revenue and moats more than their current sales.
8. Business model and economics
Two distinct monetization models operate in the sector. EDA is sold primarily through multi-year, time-based licenses — often large enterprise license agreements (ELAs) — supplemented by upfront emulation-hardware sales. IP is sold through a combination of upfront license fees and per-unit royalties collected for the life of the chip.
The EDA model is, in effect, a renewal engine. Time-based arrangements are 70–83% of Synopsys’ and Cadence’s revenue; customer retention exceeds 95% (and approaches 99% for signoff and analog tools); and contracts carry annual escalators, so a customer that signed a $10 million ELA in 2020 may renew at $12–14 million in 2025 without adding a single engineer. The result is large committed backlogs — Synopsys reported $11.4 billion (about 1.6 years of revenue) and Cadence roughly $7.8 billion — giving rare forward visibility for a technology business.
Arm’s IP model has a characteristic time lag that rewards patient analysis:
Because royalties lag licenses by two to three years, a surge in licensing today is an advance signal of royalty growth in 2027–28. Arm is also raising revenue per chip: its newer Armv9 architecture and pre-integrated Compute Subsystems (CSS) carry higher royalty rates than prior generations, and v9 already accounts for roughly a third of royalties. Annualized contract value (ACV) — a normalized measure of the licensing base — was growing around 28% year-on-year as of late 2025.
9. Demand drivers
Artificial intelligence — a double tailwind. AI raises demand in two ways. It multiplies the number and complexity of chips being designed (accelerators, networking, custom silicon), and it is being embedded inside the EDA tools themselves: ML-driven optimizers such as Synopsys’ DSO.ai and Cadence’s Cerebrus can close designs faster and better than manual methods, which the vendors sell as a high-margin premium.
Rising design complexity. Each new node (3nm, 2nm, gate-all-around) and each additional billion transistors increases verification and implementation effort, lifting tool consumption per design.
Chiplets, 3D-IC, and advanced packaging. Multi-die designs require new tools for partitioning, 3D floor-planning, thermal analysis, and die-to-die interconnect — a direct beneficiary of the same advanced-packaging wave reshaping the back-end, and a key motivation for the Synopsys-Ansys combination.
The custom-silicon boom. Hyperscalers designing their own chips (Google’s TPU, AWS’s Graviton and Trainium, Microsoft’s Maia, Meta’s MTIA) have multiplied the number of sophisticated design starts — each one a new consumer of EDA seats and licensed IP, often from customers who never previously designed silicon.
10. Geopolitics: design software as a chokepoint
EDA is a control point comparable to EUV lithography: the leading tools are supplied by two US companies and one US-based unit of a German firm, and they cannot be readily substituted. This was demonstrated vividly in 2025. On 23–29 May 2025, the US Bureau of Industry and Security imposed license requirements on EDA exports to China, abruptly cutting Chinese chip designers off from new tools, updates, and support. Barely six weeks later, on 2–3 July 2025, the restrictions were rescinded as part of a broader US-China framework that also eased China’s rare-earth export curbs.
The episode underscored several realities. China was a meaningful revenue source — roughly 16% of Synopsys and ~12% of Cadence revenue — so the controls hurt the vendors as well as their customers, and Siemens EDA reported a significant China revenue decline that quarter. It also accelerated China’s push for domestic EDA (Empyrean, Primarius, X-EPIC, and newer entrants such as Univista), though Chinese tools remain far behind on full-flow, leading-edge design. RISC-V adds a parallel dimension: as an open, license-free instruction set not owned by any single country’s company, it is attractive to Chinese designers seeking to reduce dependence on Arm.
Will US-headquartered EDA vendors see their total revenue share from the Asia-Pacific region (excluding Japan) drop below 20% in audited fiscal year 2026?
YesResult
0.00%
NoResult
0.00%
0 Polls
Ended
11. A framework for financial analysis
• Value the recurring base and backlog. Time-based revenue mix, retention rates, and committed backlog (e.g., Synopsys’ $11.4 bn) are the core quality signals; they make revenue unusually predictable.
• For Arm, watch licensing as a leading indicator. Licensing and ACV today foreshadow royalties two to three years out; royalty-per-chip (the v9 and CSS mix) is the key margin lever.
• Track the AI attach rate. Adoption of AI-driven tools (DSO.ai, Cerebrus) is both a growth driver and a test of pricing power.
• Remember the sector is R&D-cycle, not capex-cycle. EDA/IP revenue is tied to customers’ design budgets, which are steadier than fab capital spending — a defensive quality versus the equipment names.
• Mind valuation. These are high-multiple equities; much of the value rests on durable growth and moats, so they are sensitive to any deceleration or to regulatory and geopolitical shocks.
PredictionMarkets Org disclaimer: This article is an educational overview, not investment advice, and does not constitute a recommendation to buy or sell any security.
12. Key debates to watch
• RISC-V versus Arm. Whether the open instruction set erodes Arm’s royalty economics in volume markets, or remains complementary at the edges.
• Arm moving up the stack. Arm’s shift toward pre-integrated subsystems (CSS) — and reports of its own chips — raises potential channel conflict with the customers it licenses to.
• AI in EDA: boon or pricing pressure? Whether AI tools mainly expand the premium tier, or eventually let customers do more with fewer seats.
• China’s domestic EDA. How quickly local vendors can close the gap on full-flow, leading-edge design — the sector’s equivalent of the EUV question.
• Concentration and antitrust. The Synopsys-Ansys deal required divestitures; further consolidation will draw scrutiny.
13. Risk summary
• Geopolitical/regulatory — export controls can cut off a ~10–16% revenue market overnight, as 2025 showed.
• Disruption risk — RISC-V (to Arm) and open-source EDA efforts (to the Big Three), though both remain early.
• Customer concentration and consolidation — a handful of large designers and foundries drive much of demand.
• Valuation/multiple risk — rich multiples leave little room for growth disappointment.
• Integration risk — absorbing Ansys is a large undertaking for Synopsys.
The capital-equipment and materials layer that enables all semiconductor's manufacturing — its structure, economics, leaders, and strategic risks.
Executive summary
The semiconductor equipment and semiconductor materials industry supplies the capital tools and consumable inputs required to manufacture every integrated circuit produced worldwide. It sits at the apex of the chip supply chain: its customers are the chip designers/fablesses, foundries, integrated device manufacturers (IDMs), and outsourced assembly-and-test houses (OSAT) that together constitute the rest of the industry. Because no advanced chip can be fabricated without these tools and materials, the sector functions as the binding constraint on global computing capacity — a position that confers both unusual pricing power and acute strategic sensitivity.
Three characteristics define the sector’s investment profile. First, structural concentration: a handful of firms control the majority of each process step, and several occupy de facto monopolies. 2) Second, deep and durable barriers to entry: leading-edge tools embody decades of accumulated process physics and are co-developed with customers years ahead of production, making displacement rare. Third, geopolitical centrality: because controlling the means of production is the most effective lever for controlling who can manufacture advanced chips, the sector has become the principal instrument of export-control policy between the United States, its allies, and China.
On the latest data, total semiconductor equipment sales reached a record $135 billion in 2025 and are forecast by SEMI to surpass $150 billion for the first time in 2027 (~$156 billion) (SEMI), while the separately-reported materials market set a record of $73.2 billion in 2025 (SEMI). The current cycle is distinguished less by unit volume than by complexity: artificial intelligence, high-bandwidth memory, and advanced packaging are reshaping where capital is deployed across the manufacturing flow.
1. Defining the sector and its strategic importance
For semiconductor equipments, a useful starting point is the economics of a modern fabrication plant (“fab”). A single leading-edge logic fab now requires a capital outlay on the order of $20–30 billion or more, of which the great majority — commonly 70–80% — is spent on process equipment rather than the building itself, based on our channel check and industry analysis. The equipment industry therefore captures the largest share of every wave of fab investment, and its revenues are a direct function of the capital-expenditure decisions of a small number of very large manufacturers (for example, TSMC, Samsung, Intel, and the memory producers).
The materials industry operates on a different rhythm. Where equipment is a periodic capital purchase, materials — silicon wafers, photoresist, process gases, substrates — are consumed continuously as long as a fab is running. This gives the materials business steadier, utilization-linked revenue that is far less volatile than equipment demand, an important distinction for portfolio construction.
Taken together, the sector is best understood not as a supplier of components but as the owner of the enabling technology for the entire digital economy. Its products are the precondition for every downstream activity, which is why a relatively modest revenue base (roughly $200 billion across equipment and materials combined in 2025, according to SEMI) commands disproportionate strategic and financial attention.
2. Position in the value chain
The chip moves through a sequential value chain, with equipment and materials feeding in from upstream. Crucially, equipments & materials supply both ends of manufacturing — the front-end fabs that build circuits on the wafer, and the back-end houses that package and test finished devices. The equipment vendor is always upstream of whoever operates the tool.
This distinction resolves a common point of confusion. “Assembly, packaging, and test” denotes both a service (performed downstream by OSAT firms such as ASE and Amkor) and the equipment used to perform it (supplied upstream by tool vendors). The back-end equipment is upstream of back-end manufacturing; the naming overlaps, but the economic roles do not.
3. How chips are made — and where each tool fits
Understanding the sector requires understanding the manufacturing flow, because each major equipment category maps to a specific process step. Fabrication divides into a front-end phase (building the transistors and interconnect on the wafer) and a back-end phase (singulating, packaging, and testing the finished chips).
Front-end: a repeated build-up of layers
The front-end does not run once; it is a cyclical process repeated 50 to more than 100 times, once for each layer of the device. A simplified cycle proceeds as follows:
Each pass deposits material, patterns it with light, and etches away what is not needed, with doping, planarization, and cleaning interspersed. Because the cycle repeats so many times, even small per-step improvements in yield or throughput compound enormously — which is why customers are reluctant to switch qualified tools and why incumbents enjoy such durable positions. As devices migrate to advanced architectures (FinFET and now gate-all-around transistors, plus 3D memory stacking), the number of deposition and etch steps has risen sharply, increasing the equipment intensity of each wafer and benefiting the deposition/etch leaders in particular.
Back-end: from wafer to packaged, tested chip
Once the wafer is complete, the back-end dices it into individual dies, attaches and connects them within a package, and tests the result. Historically a lower-value, slower-growing segment, the back-end has been transformed by advanced packaging, which increasingly uses wafer-level, fab-style processes and so blurs the traditional front-end/back-end boundary.
4. Market size and segmentation
We summarize semiconductor equipment and materials in two separate SEMI data sets. The equipment figures come from SEMI’s Year-End Total Semiconductor Equipment Forecast; the materials figures come from SEMI’s annual Materials Market report. The two markets differ in size, segmentation, and cyclicality, so combining them obscures more than it reveals.
4.1 The equipment market
Per SEMI’s Year-End Total Equipment Forecast (16 December 2025), total semiconductor manufacturing equipment sales reached a record $133 billion in 2025 (+13.7% year-on-year), and are projected to grow to $145 billion in 2026 and $156 billion in 2027 — surpassing $150 billion for the first time. Wafer fab equipment (WFE) dominates, while the back-end (test and packaging) has rebounded sharply off a smaller base.
Equipment
segment
2025 sales
2025 growth
Trajectory
to 2027
WFE (front-end)
$115.7 bn
+11.0% (from $104 bn in
2024)
→ $135.2 bn by 2027
(advanced logic, DRAM/HBM)
Test equipment (ATE)
$11.2 bn
+48.1%
+12.0% 2026, +7.1% 2027 (AI/HBM test complexity)
Assembly & packaging
$6.0 bn
+19.6%
+9.2% 2026, +6.9% 2027
(advanced packaging)
Total equipment
$133 bn
+13.7%
→ $145 bn 2026 → $156 bn 2027
Within WFE, foundry-and-logic applications alone accounted for roughly $66.6 billion in 2025 (+9.8%), reflecting resilient leading-edge spending. China, Taiwan, and Korea are expected to remain the top three equipment-buying regions through 2027.
4.2 The materials market
Per SEMI’s Materials Market report (12 May 2026) — a wholly separate release — global semiconductor materials revenue reached a record $73.2 billion in 2025 (+6.8% year-on-year). Materials are consumables purchased continuously as fabs run, so this market is steadier and less cyclical than equipment. It divides into wafer fab materials (used in front-end fabrication) and packaging materials (used in back-end assembly).
Substrates, bonding wire, lead frames, encapsulants
Total materials
$73.2 bn
+6.8%
—
Geographically, the materials data show where chips are actually built. Taiwan was the largest consumer for the 16th consecutive year (~$21.7 billion in 2025), followed by China (~$15.6 billion) and South Korea (~$11.2 billion). A related SEMI release (Feb 2026) noted that silicon wafer shipments rose 5.8% in 2025 to a record area, even as wafer revenue dipped slightly — a sign that AI-driven demand is concentrated in higher-value advanced wafers.
Top
materials consumers (2025)
Revenue
Taiwan (16th consecutive
year as #1)
~$21.7 bn
China
~$15.6 bn
South Korea
~$11.2 bn
5. Equipment segments and their leaders
The front-end equipment market is segmented by process step, with a clear leader (often a near-monopolist) in each:
· Lithography — the highest-value and most concentrated step, patterning circuits onto the wafer with light. ASML is the sole producer of extreme-ultraviolet (EUV) systems, which use 13.5-nanometer light to print the smallest features; its next-generation High-NA EUV tools cost in excess of $350 million each. ASML also leads advanced deep-ultraviolet (DUV) immersion lithography, with Canon and Nikon present at older nodes.
· Deposition — building up thin films via CVD, PVD, ALD, and epitaxy. Led by Applied Materials, Lam Research, and Tokyo Electron (TEL). Atomic-layer deposition in particular has grown with gate-all-around transistors and 3D memory.
· Etch — selectively removing material. Lam Research and Tokyo Electron lead, with Applied Materials present; high-aspect-ratio etch for 3D NAND and advanced logic is a key battleground.
· Process control (metrology & inspection) — measuring dimensions and detecting defects to protect yield. KLA holds a commanding position, and its importance rises as devices grow more complex; this segment also carries the highest margins in the industry.
· Other front-end steps — cleaning and surface preparation (TEL, SCREEN), ion implantation (Applied Materials, Axcelis), chemical-mechanical planarization (Applied Materials, Ebara), and thermal processing. Notably, TEL holds an estimated 88–90% share of the coater/developer (“track”) tools that pair with lithography.
Back-end equipment is more fragmented but faster-growing:
· Assembly & packaging tools — wire, die, flip-chip, and hybrid bonders; leaders include ASMPT, Kulicke & Soffa, and Besi. Hybrid bonding is the critical enabler of 3D stacking.
· Test equipment (ATE) — a duopoly of Teradyne and Advantest; Advantest in particular has benefited from the surge in testing intensity for AI accelerators and HBM.
6. Materials segments and their leaders
Materials feature their own deep moats: a contaminant measured in parts-per-billion can destroy a wafer, qualification cycles run for years, and switching costs are high.
• Silicon wafers — the substrate, led by Shin-Etsu and SUMCO of Japan, with GlobalWafers and Siltronic also major. Worldwide wafer shipments rebounded in 2025–26 on AI demand (SEMI).
• Photoresist and ancillaries — light-sensitive chemicals central to lithography. Japanese suppliers — Tokyo Ohka Kogyo (TOK), JSR, and Shin-Etsu — together hold more than half the global market, with leadership in EUV and ArF-immersion resists. This is among the most R&D-intensive material categories.
• Specialty gases and wet chemicals — Air Liquide, Linde, Merck, and others; consumption rises with process-step count.
• Photomasks, CMP slurries/pads, and sputtering targets — specialized consumables across the front-end flow.
• Packaging materials — substrates (notably ABF substrate), bonding wire (cost tied to gold prices), lead frames, and encapsulants. The fastest-growing materials sub-segment, driven by advanced packaging and the higher material intensity of multi-die AI chips; packaging materials grew 9.3% to $27.4 billion in 2025 (SEMI).
7. Competitive structure and company financials
The sector’s defining commercial feature is oligopoly with monopoly pockets. The five largest equipment suppliers — Applied Materials, ASML, Tokyo Electron, Lam Research, and KLA — together command an estimated 56–66% of the equipment market, and the leader in each individual step typically holds a far higher share still.
The financial signature of this structure is high and persistent margins, substantial recurring service revenue, strong returns on equity, and large capital returns. The latest full-year results illustrate the point:
Company
Core
franchise
FY2025
revenue
Gross margin
Net income
ASML
Lithography (sole EUV maker)
€32.7 bn (~$35 bn)
52.8%
€9.6 bn
Applied Materials
Broadest front-end + services
$28.4 bn
48.7%
~$7.0 bn
Lam Research
Etch & deposition +
services
$18.4 bn
48.7%
$5.36 bn
KLA
Process control / inspection
$12.2 bn
~60.9%
$4.06 bn
Several financial themes emerge from these disclosures:
• Margin hierarchy reflects competitive intensity. KLA’s ~61% gross margin — well above the ~49–53% of the others — reflects its dominant, lightly-contested position in process control. ASML’s margins are buoyed by the EUV monopoly.
• Recurring service revenue is a stabilizer. Service (spares, upgrades, field options on the installed base) is roughly 23% of revenue at ASML, Applied Materials, and KLA, and a notably higher ~43% at Lam Research — a meaningful cushion against the equipment cycle.
• Returns and capital allocation are aggressive. All five majors generate returns on equity above 30%. ASML authorized a new buyback of up to €12 billion (through 2028); Applied Materials repurchased ~$4.9 billion of stock in fiscal 2025. These are cash-generative, capital-light franchises.
• Customer and geographic concentration is high. Applied Materials’ two largest customers represented roughly 19% and 15% of revenue in FY2025; Lam Research derived 34% of fiscal-2025 revenue from China. Concentration is both a source of scale economics and a risk.
Tokyo Electron, the largest Japanese supplier and the third/fourth-largest globally, rounds out the front-end “big five” with its track dominance and strong etch/deposition franchises; precise figures follow its own (April-ending) fiscal calendar.
8. Demand drivers: an AI- and complexity-led cycle
The present up-cycle is driven by architecture and complexity rather than unit volume. The principal drivers:
Artificial intelligence and high-performance computing. Training and serving large models requires vast quantities of leading-edge logic and high-bandwidth memory (HBM), pulling WFE for advanced nodes and for DRAM/HBM capacity. KLA’s management has explicitly tied its return to leading-edge growth to “expanding AI and high-performance computing investments.”
The end of easy transistor scaling and the rise of advanced packaging. As shrinking transistors becomes harder and costlier, performance increasingly comes from packaging — stacking and interconnecting multiple dies and memory. The advanced-packaging market was roughly $33–38 billion in 2024–25, growing at a double-digit CAGR, and by some estimates surpassed traditional packaging as a majority of total packaging value in 2025 (Yole). TSMC’s CoWoS platform is the marquee example: CoWoS wafer demand is forecast to rise roughly 40% year-over-year into 2026, driven overwhelmingly by Nvidia.
Memory as a strategic asset. HBM has converted DRAM from a boom-bust commodity into a constrained, high-value product, prompting elevated memory-equipment spending. This is the proximate cause of the upward revisions to WFE forecasts through 2027.
Because advanced packaging increasingly relies on wafer-level processes, front-end-style tools (deposition, etch, lithography) are migrating into the back-end, expanding the addressable market for the large front-end vendors and partly explaining their strategic push into packaging.
9. The dominant risk: geopolitics and export controls
Export controls now move the sector’s share prices. The governing logic is that controlling the tools is more effective than controlling the chips: a lithography system is a ~$200 million asset requiring years of vendor servicing, whereas a finished chip is a commodity that can be rerouted. The United States and its allies (the Netherlands and Japan, home to ASML, TEL, Nikon, Canon, SCREEN, and Advantest) have progressively restricted exports of advanced equipment to China.
The state of play as of mid-2026:
• EUV is fully denied to China. ASML’s EUV tools have never been sold there; no domestic alternative exists, and China’s SMEE remains far behind on indigenous lithography.
• DUV and servicing are the live battleground. SMIC and Hua Hong still use ASML’s DUV immersion tools, applying multipatterning to reach 7nm-class chips. Proposed US legislation (the MATCH Act) would tighten DUV and etch controls and press allies to align.
• Western vendors’ China exposure is falling sharply. China’s share of ASML sales declined from roughly 41% (2024) to 33% (2025), with guidance toward ~20% in 2026.
• China is accelerating self-sufficiency. Beijing has reportedly mandated at least 50% domestic equipment sourcing, with a 15th Five-Year-Plan target of ~80% self-sufficiency by 2030, a fully domestic 7nm equipment line, and stable 14nm production. Domestic suppliers (NAURA, AMEC, and SiCarrier-linked entities) are gaining share in mature-node and packaging tools.
The widely noted irony is that aggressive controls are accelerating China’s domestic investment, pushing the world toward two parallel supply chains. For investors this is double-edged: a near-term loss of a large market for Western vendors, and the longer-term emergence of subsidized domestic competitors at the low-to-mid end.
10. A framework for financial analysis
Several principles help in evaluating companies in the sector:
• Track the capex cycle through leading indicators. Equipment demand follows customer capital budgets; monitor the capex guidance of TSMC, Samsung, Intel, and the memory makers, plus fab-utilization rates and company backlog and bookings (ASML’s quarterly net bookings, which reached €13.2 billion in Q4 2025, are a closely watched signal).
• Use “WFE intensity” as a structural lens. Because each node transition adds deposition, etch, and patterning steps, WFE spending per wafer tends to rise structurally even when wafer volumes are flat — a secular tailwind beneath the cycle.
• Value the recurring base. Service and installed-base revenue is higher-margin and far steadier than tool sales; a larger service mix (e.g., Lam’s ~43%) warrants a more defensive valuation.
• Watch margin persistence and R&D intensity. Sustained high gross margins signal pricing power; sustained heavy R&D (ASML alone spent €4.7 billion in 2025) is the price of staying ahead — falling R&D is a warning, not a saving.
• Pair equipment with materials. Equipment offers torque to the capex cycle and the highest margins; materials offer steadier, utilization-linked revenue. Holding both balances cyclicality.
This document is an educational overview, not investment advice, and does not constitute a recommendation to buy or sell any security.
11. Key debates to watch
• Durability of the AI capex cycle — multi-year structural build-out versus eventual digestion and over-build.
• Who captures advanced packaging — foundries (TSMC), OSATs (ASE, Amkor), and equipment makers are all advancing; the economics of process and tool ownership are still being decided.
• Pace of China’s indigenization — mature nodes and packaging appear achievable; EUV and the most advanced steps remain a steep, multi-year climb.
• HBM/memory cyclicality — whether HBM stays supply-constrained or swings back to a glut is a key swing factor for memory-exposed equipment demand.
12. Risk summary
• Cyclicality in fab capital expenditure, amplified for the most equipment-levered names.
• Customer concentration — a few foundries and memory makers drive a large share of demand.
• Geopolitical and regulatory risk — export controls can remove a large market quickly and are subject to political change.
• Technology-transition risk — a missed node or packaging transition can permanently shift share.
• Long qualification cycles in materials can delay new-product revenue.
Will ASML's full-year 2026 net sales beat €40 billion (guided in April 2026?
YesResult
75.00%
NoResult
25.00%
4 Polls
Ended
Which company will see the biggest gross margin increase for its fiscal year vs prior fiscal year?







 YU GU
YU GU